Modern Economy
Vol. 3 No. 1 (2012) , Article ID: 16795 , 11 pages DOI:10.4236/me.2012.31014
Bank Non-Performing Loans (NPLS): A Dynamic Model and Analysis in China*
School of Economics & Management, Beijing University of Technology, Beijing, China
Email: zengshihong2000@yahoo.com.cn
Received July 16, 2011; revised August 28, 2011; accepted September 29, 2011
Keywords: Bank Non-Performing Loans; Finance Frangibility; Chinese Banking System
ABSTRACT
In this paper we report on a utility function (loss function) and model that we designed by using optimal control theory based on previous studies. we found that: 1) the Hamiltonian multiplier of the bank NPLs growth rate in the model was obtained using the negative derivitive of the utility (defined as loan function minus non-performing loan function) with respect to the NPLs multiplied by a factor which expresses the rate of change in NPLs over time with respect to the NPLs, the formula is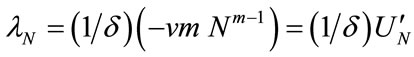 ; 2) the model determines the equilibrium value of the saddle point of the bank NPLs; 3) the model can explain the NPLS phenomenon in the Chinese banking system as mainly significant in the state owned banks (SOBS); 4) The paper supports the following hypothesis by considering the situation in China: the equilibrium value of the bank NPLs is dependent on micro-economic factors but influenced by macro-economic factors.
1. Introduction
The reason that we researched bank NPLs is straightforward: They are “financial pollution” and may be harmful to economic growth and social welfare when present (Minsky 1964 [1]; Minsky, 1995 [2]; Stiglitz and Weiss 1981 [3]; Mankiw 1986 [4]; Gonzales-Hermosillo 1999 [5]; Levon Barseghyan 2010 [6]). Ramírez (2009) [7] reported that the US financial crisis of 1893 affected state output growth: a 1% increase in bank instability reduced output growth by 2% - 5% between 1900 and 1930.
Financial fragility emerged during the reform period as a result of the evolving triangular relationship among the state owned enterprises (SOES), state owned banks (SOBS), and the fiscal system (Huang and Yang 1998 [8]).
Bonin and Huang (2001) [9] offered some modest proposals for dealing with the bad loans of Chinese banks. Chinese banks suffer from serious financial fragility manifested by high proportions of NPLs and low capitaladequacy ratios. A key policy introduced by the Chinese government to reduce financial risks was the establishment of four asset management companies (AMCs) to deal with bad loans. Drawing on the experiences of the Resolution Trust Corporation in the United States and bank restructuring in the Central European transition economies, Bonin and Huang (2001) [9] argued that the original AMCs design would not be successful in resolving the existing NPLs, and this design could not prevent the creation of new bad loans. They recommended a modification of the current proposal, which redefined the relationship between the parent banks and the AMCs by transferring the deposits of problem enterprises together with their NPLs from the parent banks to the AMCs.
Lu, Thangavelu, and Hu (2005) [10] used an empirical panel data set of public listing companies in China to explore the relationship between banks’ lending behaviour and NPLs. They showed that SOEs received more loans than other firms and those SOEs with high default risks were able to borrow more than the low-risk SOEs and non-SOEs. This suggests that Chinese banks had a systematic lending bias in favour of SOEs, particularly in relation to those with high default risks during the period under investigation.
Wunner (2000) [11] formed a two-period model, which showed that a lending bias existed in favour of old debtors resulting in the large share of NPLS in transition economies.
The paper aims to develop a model by using optimal control theory as well as creating a utility function (loss function) based on a study by Forster (1980) [12], which set up a differential equation of the state variable. In the model, the loan balance (L) is a control variable, the NPLs (N) is a state variable. We assume that the loan balances have two levels of credit risk: L (high risk) and L (low risk). It is known from the literature that these would have different probabilities of becoming NPLs (N).
Ferri (2009) [13] reported that state-owned comercial banks burdened with non-performing loans from un-profitable state-owned enterprises from 1998-2005. Ferri (2009) [13] reported that reform of state-owned commercial banks is necessary to bring better banking to China.
Berger, Hasan and Zhou (2009) [14] found that Big Four banks are by far the least efficient; foreign banks are most efficient; and minority foreign ownership is associated with significantly improved efficiency from 1994 to 2003. The three of the Big Four banks have been listed banks; minority foreign owners may be increase really Chinese bank efficiency and decrease bank non-performing loans (NPLs).
This study will discuss the following questions based on the above literature. Section 2 of this article presents both a utility function (loss function) and a hypothesis. Section 3 designs a model about NPLs using optimal control theory as well as an analysis of the model. Section 4 analyzes the effect of variables on N. Section 5 seeks to explain the NPLs in China’s banking system using the optimal bank NPLs dynamic model. Section 6 of this study is the conclusion.
2. Utility Function (Loss Function) and Hypothesis
2.1. Utility Function (Loss Function)
First, as the loan balance (L) can increases production and service capacities, it also increases total consumption (C) and social utility. However, since bank NPLs (N) is “financial pollution (P)” and is harmful to social welfare, it decreases social utility. The process is described below.
Let
where L: loan balance; N: NPLs;
Thus .
.
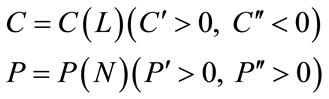
As the social utility function is dependent upon the total consumption (C) as well as bank NPLs (N), it is reasonable to assume the following relationship:
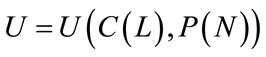 .
.
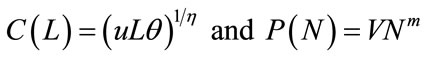
This simple illustration obtains the social utility function as follows.1 If
substitute
into

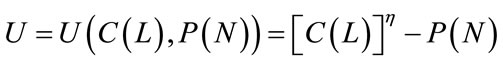
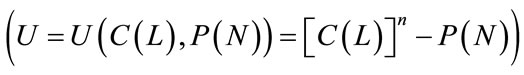
Then the utility function becomes
 where
where
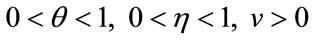 .
.
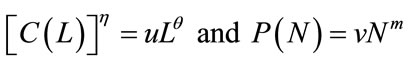
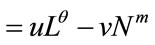
It is evident that a loan balance (L) results in a positive social utility, as shown by uLθ, but bank NPLs (N) leads to negative social utility, which is shown as –vNm.
More analysis can be performed as shown below:
If
Then
 .
.
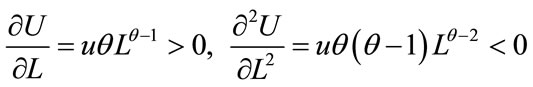
The above equation implies that the marginal utility of a loan balance (L) is an increasing function and the social utility (U) function is concave relative to loan balance (L).
The other scenario can be also analyzed below:
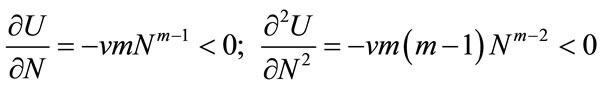
If
Then
 .
.
Similarly, the above analyses indicate that the marginal utility of bank NPLs (N) is positive and a decreasing function and that the social utility (U) function is concave in relation to bank NPLs (N).
2.2. Assumptions and Lemma
2.2.1. Assumptions
For further analyses, we make the following assumptions and discuss their meanings.
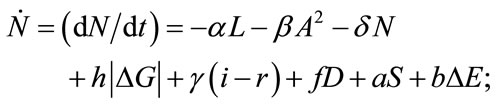
Assumption 1
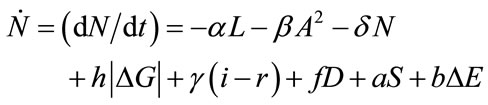
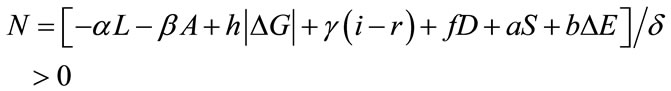
where N is bank NPLs; (dN/dt) is the growth rate of the bank NPLs; L is the loan balance; A is the effort of internal bank management; G is the economic growth rate; |ΔG| is the amplitude of the economic growth rate; i is the nominal interest rate; r is the profit margin of an enterprise; i – r is the difference between the nominal interest rate and the profit margin of the enterprise; D is the degree of openness to the outside world; S is the animal spirit of the enterpriser (an increase in an enterpriser’s irrational behavior); and ΔE is amplitude of the exchange rate.
Assumption 2
 ;2
;2 ;
; ;
; ;
; ;
; ;
; ;
;  in which
 ,
,  , etc. are the coefficients of the variables described above.
This implies the following lemmas.
2.2.2. Lemmas
Lemma 1
Suppose  < 0, the relationship of the change in rate of NPLs (N) with respect to time and total loan balance (L) is (dN/dt)/dL = –
 > 0. This means that the change in rate of NPLs (N) through time is an increasing function of the total loan balance (L). The higher the total loan balance (L), the greater the variation in the rate of NPLs (N) with respect to the length of time. For example, along with an increase in the total loan balance (L), (dN/dt) might change from –0.1 (tril. per year) to 0.01 (tril. per year).3
Lemma 2
Suppose β > 0, A stands for a bank’s internal management effort, in which an institutional reform effort with respect to property rights could affect β. The value of β in a society which has a clear property right is greater than β in a society having an unclear property right. (dN/dt)/dA = –β < 0, means that the change in rate of NPLs (N) with respect to time decreases through strengthening a bank’s internal management effort. For example, along with an increase in a bank’s internal management effort, dN/dt might change from 0.1 (tril. per year) to –0.01 (tril. per year).
Lemma 3
Suppose δ > 0, N stands for NPLs. (dN/dt)/dN = –δ < 0, which means that with an increase in NPLs (N), the change in rate of NPLs with respect to time decreases.
For example, along with an increase of NPLs (N), dN/dt might change from 0.1 (tril. per year) to 0.01 (tril. per year).4
Lemma 4
Suppose h > 0, |ΔG| stands for the absolute value of the variation in the economic growth rate. (dN/dt)/d|ΔG|, we will discuss two conditions:
1) Suppose an economic growth rate , in which the economic growth rate is increasing rapidly, that is, the economy is overheating. People are so afraid of losing the chance tp make money that they do bad business by financing unsecured loans. This results in an increase in the change in rate of NPLs (N) with respect to time. For example, along with the increase of NPLs (N), dN/dt might change from –0.1 (tril. per year) to 0.01 (tril. per year).
2) Suppose a economic growth rate , in which the economic growth rate decreases rapidly, causing an economic depression. When supply exceeds demand, the price decreases, products hardly sell, corporate profit drop, causing an increase in the variable rate of NPLs (N) with respect to time. For example, along with the increase in NPLs (N), dN/dt might change from –0.5 (tril. per year) to 0.01(tril. per year).
Lemma 5
Suppose γ > 0, i – r is the difference between the nominal lending rate(i) and the factual yield rate of a corporation (r). (dN/dt)/d(i – r) = γ > 0 means that the change in rate of NPLs (N) with respect to time is a increasing function of i – r. The greater i – r, the larger the change in rate of NPLs (N) with respect to time. For example, along with the increase of i – r, dN/dt might change from –0.1 (tril. per year) to 0.01 (tril. per year). Because i is the cost of financing, a higher cost of financing or a lower factual yield rate of a corporation causes a greater difference between the nominal lending rate and the factual yield rate income of the corporation, that is to say, the change in rate of NPLs (N) with respect to time increases.
Lemma 6
Suppose f > 0, D stands for the degree of openness to the outside world. (dN/dt)/Dd = f > 0 means that the change in rate of NPLs (N) with respect to time is an increasing function of D. The higher D is, the greater the change in rate of NPLs (N) with respect to time becomes. For example, along with the increase in D, dN/dt might change from –0.1 (tril. per year) to 0.01 (tril. per year). Because of a higher degree of openness to the outside world, corporations are faced with increasing challenges and competition from overseas. The more uncertain factors are, the larger the change in rate of NPLs (N) with respect to time becomes (Note: we have not mentioned the impact of variable exchange rates, because they will be discussed in Lemma 8).
Lemma 7
Suppose a > 0, S stands for an enterpriser’s animal spirit. (dN/dt)/dS = a > 0, means that the change in rate of NPLs (N) with respect to time is an increasing function of S. The greater S is, the higher the change in rate of NPLs (N) with respect to time is. For example, along with an increase in S, dN/dt might change from –0.1 (tril. per year) to 0.02 (tril. per year). Because of the increase in an enterpriser’s animal spirit, S, specifically an increase in an enterpriser’s irrational behavior, increases along with the wave of an economic period. When there is excess expansion or excess contraction, enterprisers increase or decrease investments rapidly at the same time, so the rate of the increase in NPLs increases.
Lemma 8
Suppose b > 0, ΔE stands for variable exchange rates. If we use the method of direct quotation, variable exchange rates ΔE > 0, (dN/dt)/d(ΔE) = b > 0 means a depreciation in domestic currency. Corporations who borrow foreign loans aggravate their debt burden, because their foreign loans that are calculated using domestic currency increase. The likelihood of a corporation’s deficit and the change in rate of NPLs (N) with respect to time increases. If we use the method of direct quotation, ΔE < 0, (dN/dt)/d (ΔE) = b > 0 means an appreciation of the domestic currency. Corporations who borrow foreign loans reduce their debt burden because their foreign loans that are calculated using domestic currency decrease. Therefore, the likelihood of corporation’s deficit and the change in rate of NPLs decrease with time.
3. Design of a Model for NPLs by Optimal Control Theory and Analysis of the Model
3.1. Model of NPLs Using Optimal Control Theory
We write the social objective function as:
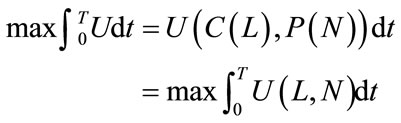 (1)
(1)
And the social utility functions as:
 (2)
(2)
This satisfies the constraint conditions as follows:
1) (3)
(3)
2) ,
,  Then
Then
 ;
;
3) 
Then

4)  freedom.
3.2. Demonstration of the Economic Meaning of the Shadow Price in the Optimal Bank NPLs Dynamic Model
The Hamiltonian function can be found as:
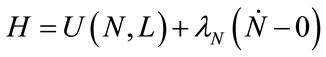 (4)
(4)
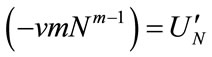
 . (5)
. (5)
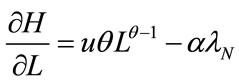
For Then the following condition is true
 (the Kuhn-Tucker conditions)
when  (the complementary slackness conditions), then
 .
.
Therefore
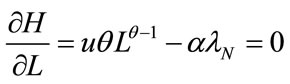 . (6)
. (6)
The follow equation can be obtained by (6)
 (7)
(7)
 ,
,  , thus
 .
.
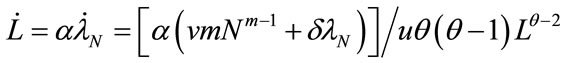
The differential form of Equation (6) relative to time is given by
 (8)
(8)
where 
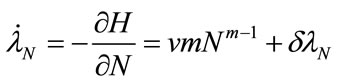 . (9)
. (9)
Equation (9) is the Hamiltonian characteristic. When Equation (9) equals 0, that is
 (10)
(10)
We find that
 (11)
(11)
If substituting Equation (7) into (9), we see that
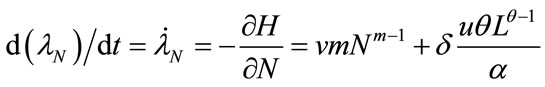 (12)
(12)
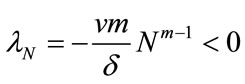
And find that  increases with N. Furthermore, based on (11), we get
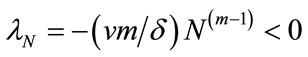 , that is
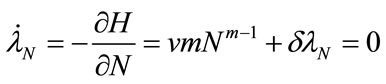
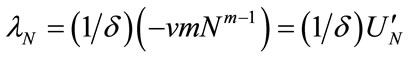
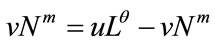
As the above analyses indicate, the parameter,  , is the Hamiltonian multiplier of the bank NPLs growth rate in the model, which is the shadow price of bank NPLs. The shadow price was obtained using the negative derivitive of the utility (defined as loan function minus nonperforming loan function) with respect to the NPLs multiplied by a factor which expresses the rate of change in NPLs over time with respect to the NPLs. Specifically, the parameter is given by
 , and the economic meaning can been seen from two perspectives, described as follows.
The first aspect implies that, for a given binding capital requirement (e.g. Basel II), keeping NPLs on the books makes a bank intrinsically riskier and therefore increases the amount of required regulatory capital, because these loans reduce the amount of available resources the bank can invest in new profitable loans. This aspect is also part of the shadow price of bank NPLs.
The second perspective is given from a macro point of view. An excessive number of NPLs in the banking system can lead to an inefficient allocation of resources and may decrease economic growth. This latter variable is assumed to be an exogenous factor in the model. We have concluded that the negative impacts of the NPLs on the economy are an essential part of an enterprise’s cost or shadow price.
3.3. Resolving the Equilibrium Solution Value of the Above Model in an N-L Phase Diagram
Equation (9) into Equation (8) gets
 (13)
(13)
Equilibrium solution value of the above model show as Equation (14) and Equation (15) from Equation (3) and Equation (13)
 (14)
(14)
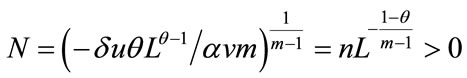 (15)
(15)
The above equation is an exponential function.
For Then
Then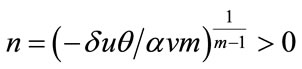 .
.
Suppose N > 0, that is
We find that

The slope of dN/dt = 0 curve is positive for α < 0, –α > 0.
Figure 1 shows the equilibrium solution value of the above model in N-L phase diagram.
It can be seen from Figure 1, that the differential equations of Equation (1) and Equation (2) constitute the saddle point equilibrium solution of E0. Suppose the initial location is at point X and Y, it can be seen from the social utility function
 that N and
 will shift to the saddle point E0 from the saddle point path XE0 and YE0. They will not change at the saddle point E0. The slope of the dL/dt = 0 curve is negative, and the assumption is that
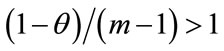 .
.
3.4. Analysis of the Effect of Changes in Parameter θ or m on the Equilibrium Solution Value of the Above Model
3.4.1. Parameter θ Decreasing or m Increasing Consistently
Parameter θ decreasing or m increasing means that  decreases. For example,

 decreases from 2 to 1.5. The absolute value of the slope of the dL/dt = 0 curve will decrease at the same L value.5
The magnitude of θ and m is decided by factors such as anthropogeography and world economy.
The social utility U will decrease when parameter θ decreases or m increases according to 

 , the value of
  also decreases when the absolute value
 .
.
The dL/dt = 0 curve has two movements. One is the absolute value of the slope of the dL/dt = 0 curve decreasing at the same L value, whilst the other movement, dL/dt = 0 curve shifts downward, Figure 1 becomes Figure 2.
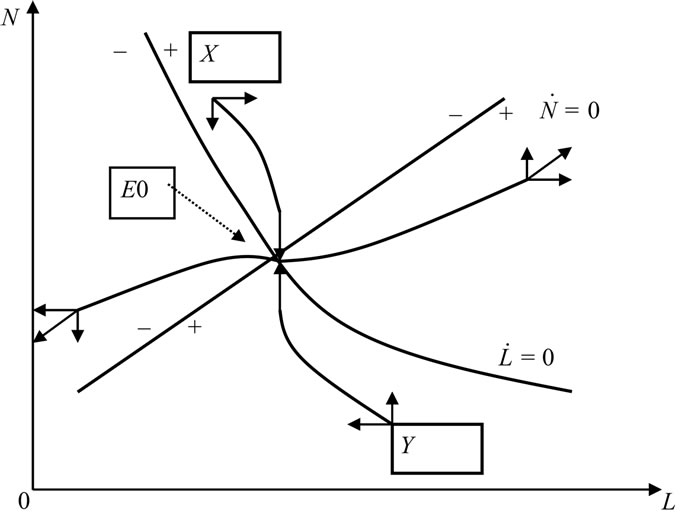
Figure 1. The phase diagram in space of N and L.
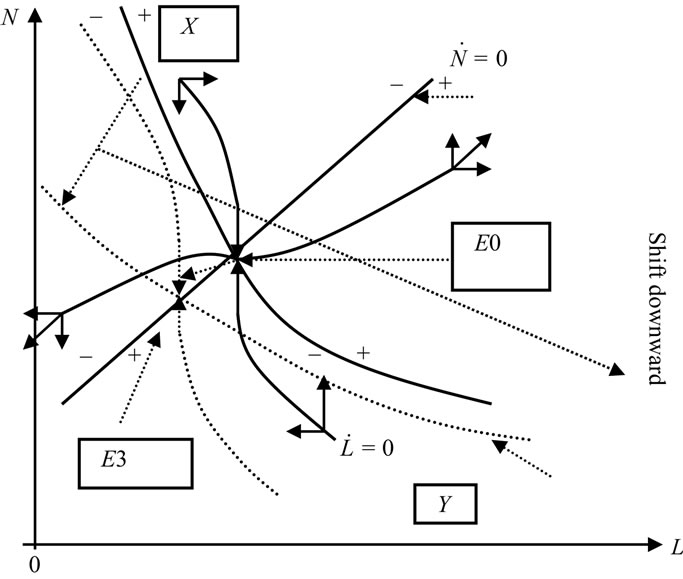
Figure 2. The phase diagram in space of N and L when the decrease of θ or the increase of m is consistent.
It can be seen from Figure 2 that the equilibrium point in space of N and L will move from point E0 to point E3 if the decrease in θ or the increase in m is consistent6; then the value of N and L will decrease.
3.4.2. Parameter θ Increasing or m Decreasing
3.4.2.1. Analysis of the Effect of Parameter θ-Increasing or m Decreasing Consistently Parameterθincreasing or m decreasing consistently means  is decreasing consistently. For example,
  increases from 1 to 2, the absolute value of the slope of dL/dt = 0 curve will increase at the same L value. The magnitude of θ and m is decided by factors such as anthropogeography and world economy.
The social utility U will increase consistently when parameter θ increases or m decreases according to 

 , the value of
 also increases when the absolute value
 . The dL/dt = 0 curve has two movements, one is that the absolute value of the slope of dL/dt = 0 curve increases at the same L value. The other is that when the dL/dt = 0 curve shifts upward Figure 1 becomes Figure 3.
The equilibrium point E0 will shift to E4 in N-L Phase Diagram when parameter θ increases or m decreases consistently, the value of N and L will increase consistently as in Figure 3.
2.4.2.2. Analysis of the Effect of Parameter θ Increasing or m Decreasing Temporarily on the Equilibrium Solution Value of the Model Parameter θ increasing or m decreasing temporarily means  is decreasing temporarily.
The social utility U will increase temporarily when parameterθ increases or m decreases according to 
 , the value of
 also increases temporarily when the absolute value
 .
.
The dL/dt = 0 curve has two movements, one is that the absolute value of the slope of dL/dt = 0 curve increases temporarily at the same L value. The other is that when the dL/dt = 0 curve shifts temporarily upward, Figure 3 becomes Figure 4.
The equilibrium point E0 will at first shift to E4 in the N-L Phase Diagram when parameter θincreases or m decreases temporarily. The value of N and L will increase temporarily as shown in Figure 4, and then will shift back to its original site.

Figure 3. The phase diagram in space of N and L when the increase of θ or the decline of m is consistent.
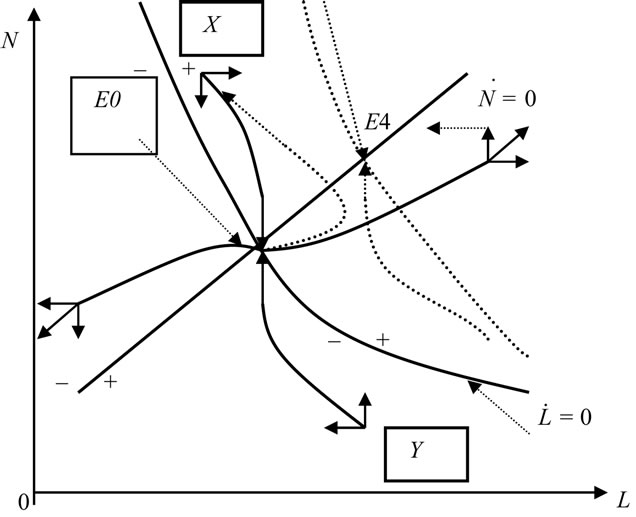
Figure 4. The effect of parameter θ increasing or m decreasing temporarily on the equilibrium solution value of the model.
The magnitude of θ, m is decided by factors such as anthropogeography and world economy. For example, the utility of the same L will decrease when equity capital financing increases, therefore, θ decreases. The negative utility of the same N will increase when equity capital financing increases, therefore, m increases.
4. Analysis of the Effect of Variables
4.1. Analysis of the Effect of A and r Increasing Consistently on the Equilibrium Solution
The influence of the increase in the effort of internal bank management (A). Or the increase in the profit rate (r) of an enterprise, or the increase in both these factors on the curve (dL/dt = 0), means a reduction in NPLs.
If the effort of internal bank management is consistent, namely A increases; or if the increase in the profit margin of an enterprise (i – r)7 is consistent, or if the increase of both of these factors is consistent, then the curve (dL/dt = 0) shifts downward in the quadrant defined by the N and L axes.8 According to the above analysis, Figure 1 becomes Figure 5.
It can be seen from Figure 5 that the saddle point and equilibrium point moves from point E0 to point E1. This situation yields the most ideal condition in that the loan balance (L) increases while the NPLs (N) decrease.
According to the social utility function, which is written as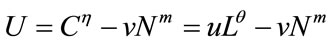 , we can find that the social utility increases when the other conditions are uniform.
If A decreases or r declines, or the two factors both decrease, the conclusion will be the opposite to the above.
4.2. Analysis of Other Variables for the Increase of the NPLs (N)
It can be seen from the above assumptions as follows: an increase in the amplitude of the economic growth rate (|ΔG|); the nominal interest rate (i); the degree of openness to the outside world (D); the animal spirit of the enterpriser (S); and the amplitude of the exchange rate (ΔE) can make the NPLs increase. Therefore, the equilibrium result of N and L can be calculated from dN/dt = 0 and dL/dt = 0, that is Equation (14) and Equation (15), dL/dt = 0 shifts upwards. According to the above analysis, Figure 1 will change to Figure 6.
5. Explanation of the NPLs in China’s Banking System Using the Optimal Bank NPLs Dynamic Model
5.1. Analysis of the NPLs Generation from the Perspective of the Development of the Chinese Banking System (A and β Will Vary in the Above Model)
There has been a great change in the Chinese banking
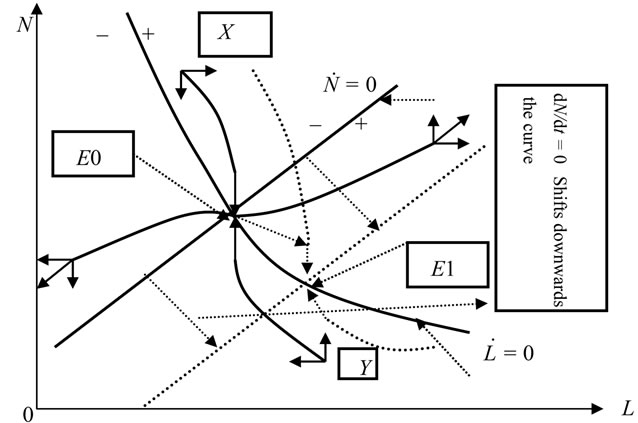
Figure 5. The phase diagram in space of N and L when the increase of A or the increase of r is consistent.
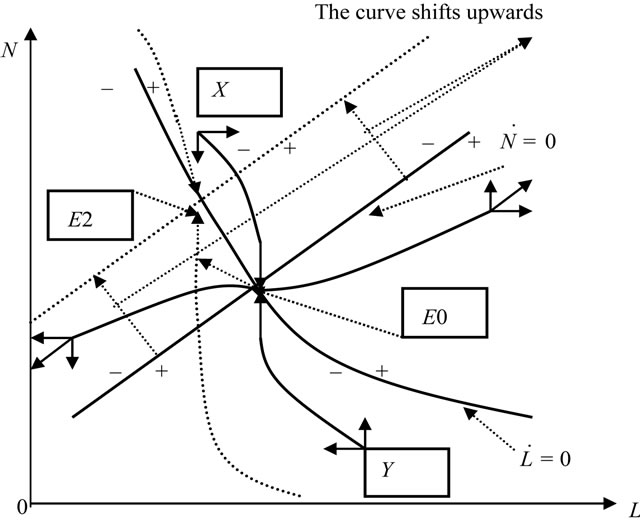
Figure 6. The phase diagram in space of N and L When analyzing other variables for the increase of the NPLs (N).
system since reform and opening to the outside world was initiated in China in 1978. The Bank of China; the Industrial and Commercial Bank of China; the Agricultural Bank of China; and the China Construction Bank, have become successively separated from the Central Bank and have emerged as specialized banks. Then, regional commercial banks and non-banking financial institutions with characteristics that are similar to those of banks come into being such as city credit unions;trust and investment corporations ;financial companies which are started by enterprises; financial leasing companies; and credit rating agencies, which all participate in debit and credit activities.
5.1.1. Analysis of the NPLs Generation from the Perspective of the Development of State Owned Commercial Banks
Before policy-related banks were founded, these four SOBs commercial banks took on a huge amount of policy-related loans at the beginning of reform. Their business objects were mainly state enterprises because the nation had the ownership of state enterprises, so that it was difficult to be an independent bank in such a business operation market. The main reason for the generation of NPLs in the four commercial banks was that the state-owned commercial banks were influenced by state macro-economic conditions and government policies. For example, banks are forced to make some loans due to government control, even though it is obvious that these loans will become the NPLs.
The character of state commercial banks in China minimizes the effect of the bank’s internal management effort (A), and makes β less than in developed countries.
After the foundation of policy-related banks, the NPLs condition in the four state commercial banks improved very little due to inertia in the thinking and operation of management, as well as in the state ownership of state enterprises and state commercial banks.
5.1.2. Analysis of the NPLs Generation from the Perspective of the Development of Stock-Holding Commercial Banks and Regional Commercial Banks
The stock-holding commercial banks include the nationwide stock-holding commercial banks and regional commercial banks.
The nationwide stock-holding commercial banks include the Bank of Traffic; the Hua Xia Bank; and the China Minsheng Banking Corp., Ltd.
As a representative for the nation, the Central Bank holds 50% of the Bank of Traffic shares, Local government and state enterprises hold the rest of the shares. From the beginning the Bank of Traffic did not need to actualize appointed loans based on China’s governmental policy but was able to respond to market conditions. When founded, the Hua Xia Bank was invested in exclusively by the Beijing Capital Steel Company, and is now composed of scores of shareholders. Following the approval of the State Department Committee, China Minsheng Banking Corp., Ltd. was founded in 1995, and 59 shareholders are members of the association of industry and commerce.
The regional commercial banks include Guangdong Development Bank; Shenzhen Development Bank; China Merchants Bank; Fujian Industrial Bank; Shanghai Pudong Development Bank, etc.
Because many stock-holding commercial banks and regional commercial banks are organized by local governments and enterprise groups, these banks surpass the four state commercial banks in the structure of property rights. However, they are still restrained by local government and enterprise groups.
The character of the stock-holding commercial banks in China causes lower effects of bank internal management effort (A). It makes β less than developed countries, which is one of the reasons for the generation of the NPLs in stock-holding commercial banks and regional commercial banks.
5.2. Analysis of the NPLs Generation from the Perspective of Hidden Guarantees that the Government Supplies to Banks (the Moral Hazard). Hidden Guarantees or Moral Hazards Will Cause A and β to Vary in the Above Model
The Chinese Government adopted progressive reform since 1978 because of the long-term highly concentrated planned economy, which was initiated after 1949. The Bank of China; the Industrial and Commercial Bank of China; the Agricultural Bank of China; and the China Construction Bank, which were successively separated from the Central Bank, become specialized banks. Then, the national Stock-holding Commercial Bank; the Regional Commercial Bank; and the non-banking financial institutions with characteristics that are similar to those of banks emerged, such as city credit unions. These have become the present city commercial banks.
Bank management departments believe that the central government and local governments can supply hidden guarantees, if these financial institutions suffer from risk and bankruptcy. This hidden guarantee increases the moral hazard of these financial institutions and decreases the conscientiousness of management (including internal management and client follow-up investigations management) and the credit risk, so that it increases the activities of these financial institutions in seeking for loans that are in the bank management’s self-interest. The hidden guarantee that the government supplies in China lowers the effect of internal management effort (A)making β less than in developed countries. All the above factors have influenced the increase in the NPLs.
5.3. Analysis of the NPLs Generation from the Perspective of the Asymmetry and Imperfection of Information, Which Will Make A and β Vary in the Above Model
Besides the reasons for the generation of the NPLs which are analyzed above, adverse selection is also a cause regardless of whether the banks were state owned sole proprietorship (such as the Bank of China; the Industrial and Commercial Bank of China; the Agricultural Bank of China; and the China Construction Bank) or national stock-holding commercial banks; regional commercial banks; or the non-banking financial institutions with characteristics similar to banks (such as the evolution of city credit unions into the present city commercial bank). The meaning of adverse selection is described as follows: after an increase in interest rates, a borrower with low profits and high security may give up applying for a loan since the profits cannot offset the loan costs, Banks are unable to differentiate the degree of the project’s security and profitability due to asymmetric and imperfect information. Therefore, adverse selection results in. Interest rates increase not only because of the general market principles governing interest rates, but also because of the clients seeking for excessive loans just because the government will guarantee the bank’s success. This will generate adverse selection. Further, the adverse incentive necessarily generates for an increase in the interest rate as a result of the pursuit of excessive loans. Adverse incentive means that high cost projects are not profitable because of high interest rates. People will select the project that has high risks and high profits due to limited liability. When China experienced deflation from 1998- 2000, adverse selection and adverse incentives increased. The asymmetric and imperfect information in China lowers the effect of bank internal management effort (A). It also makes β lower than in developed countries. Therefore, the asymmetric and imperfect information produces adverse selection and adverse incentive. According to the above model, from 1994 to 2000 China experienced adverse selection and adverse incentive, which lead to the increase in the NPLs (as shown in the Table 1).
5.4. Analysis of the NPLs Generation from the View of the National Animal Spirit (S), Which Will Make the Parameters a and S Increase in the Above Model
The NPLs will increase if the national animal spirit is enhanced. Though the economic system of a socialist market economy was established in 1992, the interplay of animal spirit and economic overheating led to an increase in banks’ blind loans and enterprises’ speculative debts from 1992 to 1997. This was because of the weak credit base and a culture that was unused to credit, which factors resulted from China’s sudden reversal of the longterm highly concentrated planned economy that had existed from 1949 to 1991.
The combination of a weak credit base and a weak credit culture created a national animal spirit, which therefore produced an increase in the parameter “a” and “S”. According to the above model, from 1992 to 1997, China experienced an increase in the NPLs.
5.5. Analysis of the NPLs Generation from the Perspective of the Upgrading of Industrial Structure Producing More Loans (L) and Low Real Interest Rate (r) in the Above Model
Due to the great change in world economic structures during the 1980s and 1990s, the rapid development of information technology and the upgrading of industrial structures, most enterprises formed by loan investment lacked comparative advantages. The income of enterprises declined so rapidly that the enterprises could not afford to pay their debts. In order to enable the enterprises to pay the debt in the future, banks supplied more loans (L) which were induced by various means such as bribery; thus some enterprises became bankrupt because of higher and higher debts.
5.6. Analysis of the NPLs Generation from the Perspective of the Change in the Degree of Openness to the Outside World (D), Which Makes the Parameter f and D Increase in the Above Model
The degree of openness of China has increased gradually since 1978. With the increase in the degree of openness,
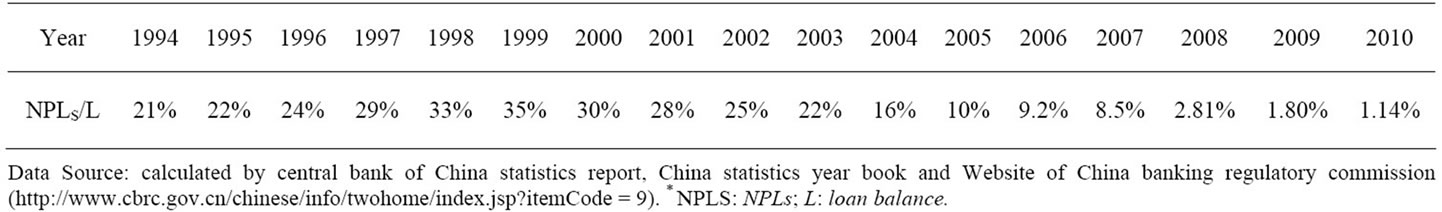
Table 1. The rate of NPLs to loans balance (NPLs/L)* at the state owned commercial banks in China from 1994 to 2010.
enterprises were liable to suffer from strikes and competitions abroad because of the new immature planned economy and an incomplete law system. The loss of enterprises increased with the uncertain factors, leading to an increase in the growth rate of the bank NPLs.
5.7. Analysis of the NPLs Decrease at the State Owned Commercial Banks in China from 1999 to 2010 According to the Above Model
Between 1999 and 2010, the proportion of NPLs compared to the total loan balance decreased at the state owned commercial banks in China from 35% to 1.14%. One reason is four asset management companies (AMCS) set up for dealing with the NPLs in 1999. Banks transferred 1394 billion RMB yuan NPLs into the AMCS. At the same time, the state owned commercial bank reform bank internal management and the bank internal management effort (A) increased and the absolute value |α| decreased in the above model. The rate of NPLs to loans balance decreased also when the loans’ balance was constant or increasing. Moreover, deflation ended after 2002, enterprise real yield rate increased, and the parameters r and γ increased in the above model. As a result, NPLs decreased, and the rate of NPLs to loan balance decreased also when loan balance was constant or increasing.
Another reason is Fu and Heffernan (2009) [15], who reported that new policies had directed at encouraging market entry and increasing the market share of the most efficient banks in China.
6. Conclusions
Bank NPLs are “financial pollution”, and when present, may be harmful to economic growth and social welfare. This paper studies the influence of bank NPLs on social welfare from the point of view of the optimal control theory. The author attempted to find: 1) the Hamiltonian multiplier of the bank NPLs growth rate in the model was obtained using the negative derivitive of the utility (defined as loan function minus non-performing loan function) with respect to the NPLs multiplied by a factor which expresses the rate of change in NPLs over time with respect to the NPLs, the formula is ; 2) a model that demonstrates the equilibrium value of the saddle point of the bank NPLs; 3) a model explaining the NPLS phenomenon in the Chinese banking system-mainly the state owned banks (SOBS); 4) A test of the following hypothesis by the facts in China: the equilibrium value of the bank NPLs is dependent on micro-economic factors under the circumstances of macro-economic factors. Micro-economic factors include a bank’s internal management; macro-economic factors include the degree of openness to the outside world and government policy.
According to the model, to obtain a decrease in the NPLs in China, the banks’ internal management effort must be enhanced. Similarly, the share structure of property rights should reform, decreasing the hidden guarantees that the government supplies, as well as decreasing asymmetric and imperfect information. Enterprises should be more rational and the national animal spirit should decrease.
REFERENCES
- H. P. Minsky, “Longer Waves in Financial Relations: Financial Factors in the More Severe Depressions,” The American Economic Review, Vol. 54, No. 3, 1964, pp. 324- 335.
- H. P. Minsky, “Longer Waves in Financial Relations: Financial Factors in the More Severe Depressions II,” Journal of Economic, Vol. 29, No. 1, 1995, pp. 83-96.
- J. E. Stiglitz and A. Weiss, “Credit Rationing in Markets with Imperfect Information,” American Economic Review, Vol. 71, No. 3, 1981, pp. 393-410.
- N. G. Mankiw, “The Allocation of Credit and Financial Collapse,” Quarterly Journal of Economics, Vol. 101, No. 3, 1986, pp. 455-470. doi:10.2307/1885692
- B. Gonzales-Hermosillo, “Developing Indicators to Provide Early Warnings of Banking Crises,” Finance & Development, (Financial Markets), Vol. 36, No. 2, 1999, pp. 36-39.
- L. Barseghyan, “Non-Performing Loans, Prospective Bailouts, and Japan’s Slowdown,” Journal of Monetary Economics, Vol. 57, No. 7, 2010, pp. 873-890. doi:10.1016/j.jmoneco.2010.08.002
- C. D. Ramírez, “Bank Fragility, ‘Money under the Mattress’, and Long-Run Growth: US Evidence from the ‘Perfect’ Panic of 1893,” Journal of Banking & Finance, Vol. 33, No. 12, 2009, pp. 2185-2198. doi:10.1016/j.jbankfin.2009.05.020
- Y. P. Huang and Y. Z. Yang, “China’s Financial Fragility and Policy Responses,” Asian-Pacific Economic Literature, Vol. 12, No. 2, 1998, pp. 1-9. doi:10.1111/1467-8411.t01-1-00037
- J. P. Bonin and Y. P. Huang, “Dealing with the Bad Loans of the Chinese Banks,” Journal of Asian Economics, Vol. 12, No. 2, 2001, pp. 197-214. doi:org/10.1016/S1049-0078(01)00082-3
- D. Lu, S. M. Thangavelu and Q. Hu, “Biased Lending and Non-Performing Loans in China’s Banking Sector,” Journal of Development Studies, Vol. 41, No. 6, 2005, pp. 1071-1091. doi:10.1080/00220380500155361
- N. Wunner, “Bad Loans, Soft Budget Constraints and the Political Economy of Financial Market Reform in Transition Economies,” Journal of Policy Reform, Vol. 4, No. 1, 2000, pp. 51-74. doi:10.1080/13841280008523413
- B. A. Forster, “Optimal Energy Use in a Polluted Environment,” Journal of Environmental Economics and Management, Vol. 7, No. 4, 1980, pp. 321-333. doi:10.1016/0095-0696(80)90025-X
- G. Ferri, “Are New Tigers Supplanting Old Mammoths in China’s Banking System? Evidence from a Sample of city Commercial Banks,” Journal of Banking & Finance, Vol. 33, No. 1, 2009, pp. 131-140. doi:10.1016/j.jbankfin.2007.06.013
- A. N. Berger, I. Hasan and M. M. Zhou, “Bank Ownership and Efficiency in China: What Will Happen in the World’s Largest Nation?” Journal of Banking & Finance, Vol. 33, No. 1, 2009, pp. 113-130. doi:10.1016/j.jbankfin.2007.05.016
- X. Q. Fu and S. Heffernan, “The Effects of Reform on China’s bank Structure and Performance,” Journal of Banking & Finance, Vol. 33, No. 1, 2009, pp. 39-52. doi:10.1016/j.jbankfin.2006.11.023
NOTES
*The research was achievements of the current stage of a subtopic of 2011 Chinese philosophy & Social Science research Major Program (11&ZD140); 2011 Beijing philosophy & Social Science research program (11JGB029); SRF for ROCS, SEM (No 32011012201101); 2011 Beijing Education Committee key project (No. SZ201110005003) and (01100054R6002); (011000541211506); (ER2011-B22); (011000542211023).
1The concept of the social utility function of the paper originates from the study by Bruce A. Forster: “Optimal Energy Use in a Polluted Environment,” Journal of Environmental Economics and Management, 1980, pp. 321-333. The paper develops a social utility function from the viewpoint of bank non-performing loans, which are “financial pollutions. Different problems may have different social utility functions. For example, the social utility function is given by U = 1/2(y – y*)2 + 1/2(π – π*)2 when inflation is studied, where π is inflation rate, π* is rational inflation rate, y is output, y* is equilibrium output.
2If α > 0 then , and the conclusion will be the same as that when α < 0. Assumption 1 changes accordingly to dN/dt = –αL – βA 2– δN + h|ΔG| + γ(i – r) + fD + aS + bΔE .
3Why do non-performing loans increase faster when total loans balance increase? Because in the conditions that the other variables are uniform, more total loans balance means that bank’s loan inspection is looser. That is why non-performing loans increase faster.
4Because along with the addition of NPLs, bank credit departments and bank supervising departments would take action to reinforce censors before loaning, in loaning and after loaning and enhance the usage of credit capital.
5dL/dt = 0 curve is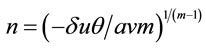 , the absolute value of the slope of dL/dt = 0 curve is |dN/dL| of the curve.
6If the financing by stock rights in a country increases dramatically, the utility of the counterpart of the loan balance, that means θ will decrease. By the same token, if the financing by stock rights in a country increases dramatically, the disutility of the counterpart of the nonperforming loans balance (N) will increase, which leads to the increase of m.
7An increase in the profit margin of an enterprise (r) derives from improvement in techniques.
8Because α < 0, –α > 0, the slope of the curve dN/dt = 0 in the area of N and L is positive.