Journal of Environmental Protection
Vol. 3 No. 10 (2012) , Article ID: 23899 , 10 pages DOI:10.4236/jep.2012.310158
A Study on the Radioactivity Level in Raw Materials, Final Products and Wastes of the Phosphate Fertilizer Industries in Bangladesh
![]()
1Department of Physics, Jahangirnagar University, Savar, Bangladesh; 2Health Physics and Radioactive Waste Management Unit, Institute of Nuclear Science and Technology, Atomic Energy Research Establishment, Savar, Bangladesh; 3Department of Physics, Comilla University, Comilla, Bangladesh.
Email: *rahmanmahbubur@ymail.com
Received July 16th, 2012; revised August 17th, 2012; accepted September 15th, 2012
Keywords: Raw Materials Radioactivity; Phosphate Fertilizers and HPGe Detector
ABSTRACT
A study on the detection of probable radionuclides and their activity concentrations in the raw material (phosphate rock), final product (fertilizer) and waste samples collected from all the phosphate fertilizer factories (total two factories—A Diammonium Phosphate, DAP and a Triple Super Phosphate, TSP factory) in Bangladesh were carried out. A total of seven types of samples (grossly divided into solid and liquid types); liquid waste, waste-mixed river water, normal river water, phosphate rock, phosphate fertilizer, solid waste and normal soil; were analyzed under this study. Raw material samples were collected only from the TSP fertilizer factory. Fertilizer, solid and liquid waste samples were collected from both the factories under study. Moreover, normal soil and natural surface water samples from the suitable areas adjacent to the factories were also collected for the comparison purpose. The samples were analyzed by gamma ray spectrometry technique using a Hyper-Pure Germanium (HPGe) detector of 40% relative efficiency. The analysis of the samples showed that only natural radionuclides such as 226Ra, 232Th and 40K were present in the samples and no traces of artificial radioactivity were found in any of the samples. 40K was found below the detection limit in some samples. The analysis of the samples in the case of TSP fertilizer factory showed that the average activity concentrations of 226Ra and 232Th and 40K in raw materials were 851.27 ± 7.10, 19.63 ± 6.57 and 54.06 ± 5.93 Bq/kg, respectively, in final product 211.90 ± 4.74, 42.48 ± 10.56 Bq/kg and ND (Not Detected), respectively, in solid waste 187.49 ± 4.88, 70.06 ± 11.76 and 289.27 ± 40.24 Bq/kg, respectively and in liquid waste 6.26 ± 0.63, 10.01 ± 1.39 Bq/L and ND, respectively. The measured results in the case of samples collected from DAP fertilizer factory showed that the average activity concentrations of 226Ra and 232Th and 40K in the final product were 17.31 ± 3.92, 69.74 ± 9.88 and 48.46 ± 17.22 Bq/kg, respectively, in solid waste 24.47 ± 4.15, 164.62 ± 11.08, 191.52 ± 33.74 Bq/kg, respectively and in liquid waste 3.59 ± 1.05, 37.08 ± 3.30 Bq/L and ND, respectively. Considering the stored raw materials and wastes the part of the ambient environment of the factory, radium equivalent activity, radiation hazard index and external annual effective dose to the workers and public due to these materials were also calculated and compared with world average values.
1. Introduction
Numerous types of human practices and non-nuclear industries contribute to further concentrate some of the natural radionuclides that can be found in the earth’s crust affecting the human and the environment. Fertilizer industries, specifically the phosphate fertilizer industries, are important sources of exposure to ionizing radiation of the people and possible contamination of the environment as phosphate fertilizers, raw materials and by-products contain elevated level of radionuclides of 238U, 232Th decay series as well as radioisotopes of 40K [1]. The production process of phosphate fertilizer redistributes radionuclides throughout the environment and introduces them into the final products and byproducts [1,2].
Natural radioactivity in phosphate fertilizer plants is principally due to raw materials (phosphate rock), dehydrated calcium sulphate (phosphogypsum) generated as by-product during production of phosphate fertilizer [2], the liquid wastes from the production process and nevertheless the final product (phosphate fertilizer). Phosphate fertilizers are used in huge amounts in cultivable lands in Bangladesh as the means of increasing the food production to feed its ever-increasing population. The natural resource from which agricultural phosphorus is obtained is phosphate rock, found in sedimentary formations, usually interbedded with marine shales or limestones [2]. The phosphate rock used as a raw material for producing phosphate fertilizer incorporates in its composition radionuclides of the U and Th natural series [3]. Several types of phosphate fertilizers are produced and are usually blended for application in the crop fields. The radium and uranium tend to separate in the process of producing phosphoric acid, an important step in fertilizer manufacture. Phosphoric acid is the starting material for triple superphosphate (TSP), single superphosphate (SSP), monoammonium phosphate (MAP) and diammonium phosphate (DAP), NPK (Nitrogen-Phosphorus-Potassium) fertilizer and di-calcium phosphate (DCP) [1]. The environmental impact of fertilizer depends on the source of raw materials, production processes and the status of the pollution control equipment. In addition, phosphate fertilizer plants cause detrimental environmental effect through emissions of process specific chemicals into the air, discharges into water and storage solid waste problems.
The radioactivity released from the fertilizer plants could produce an unambiguous radioactive impact in their surrounding environment through radionuclides from phosphogypsum waste, liquid discharge as well as fertilizer itself. The analyses of radionuclide concentration levels in the starting material, final product and byproduct would provide us with interesting information to evaluate the extension, degree and routes of the radioactive impact, as well as the knowledge of the different pathways followed for the radioactive contamination to disturb the natural system. Taking this into account, the main objective of the proposed study is to determine the content of radioactivity in raw materials, final products and wastes generated from the phosphate fertilizer factories in Bangladesh and to estimate the radiological impact due to the use of the products and release of the wastes in the environment.
2. Materials and Methods
2.1. Sampling
The samples were collected from TSP and DAP fertilizer factories situated in Chittagong in the south-east region of Bangladesh. The factories stand on the bank of Karnaphuli river with the following geographical coordinates: latitude 22˚16'27"N & longitude 91˚47'45"E (TSP) and latitude 22˚14'15"N & longitude 91˚49'45"E (DAP). The locations of the factories are shown in Figure 1. Karnaphuli river is also the main source of water for local irrigation.
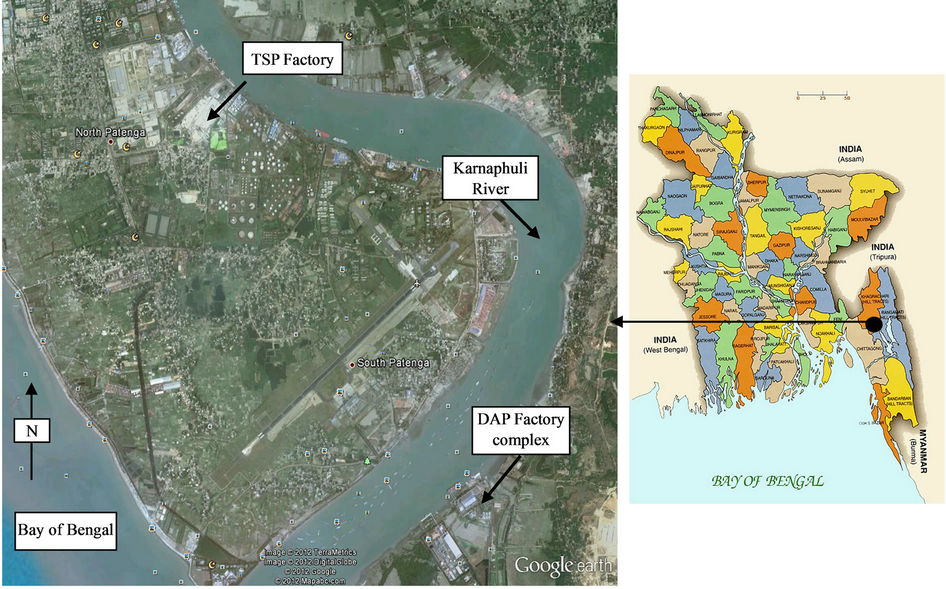
Figure 1. Location of the TSP and DAP fertilizer factory complexes on the bank of Karnaphuli river and nearby to Bay of Bengal.
Phosphoric acid, phosphate rock and NH3 are used as the starting material for producing TSP whereas imported phosphoric acid and NH3 are used for producing DAP fertilizer in Bangladesh. The phosphoric acid in TSP factory is produced by reacting concentrated sulphuric acid with phosphate rock. Phosphate rock and sulphuric acid are imported by Bangladesh from different countries of the world.
A total of 49 (forty-nine) samples of seven different types namely; 1) liquid waste, 2) waste-mixed water from the liquid waste disposal point of the Karnaphuli river, 3) normal water from Karnaphuli river, 4) phosphate rock (TSP only), 5) final product (fertilizer), 6) solid waste and 7) normal soil adjacent to the factory were collected from both the factory complexes and their nearby areas. Of these 49 samples, 22 are liquid and 27 are solid. In the 22 liquid samples, there are ten liquid waste samples, six waste-mixed water samples and six normal water samples collected from the two factories. Whereas of the 27 solid samples, there are 5 raw materials samples, 10 solid waste samples, 6 fertilizer samples and 6 normal soil samples collected from both the factories. Equal numbers of samples were collected from each factory for all the cases except in the case of raw materials samples which were collected only from the TSP fertilizer factory. Standard methods were followed to process the samples for characterization [4].
2.2. Processing of Liquid Samples
Marinelli type beakers (2 liter capacity) were used to process and measure the liquid samples. At the start of the sample processing steps, the beakers were made contamination-free by cleaning those well using light hydrochloric acid solution and deionized water. The beakers were then dried using a temperature-controlled oven and the empty weights of the beakers were noted. The beakers were then filled with liquid samples. The net weights of the samples were found from the difference of weights of sample-filled and empty beakers. Finally, the beakers filled with samples were closed by caps, wrapped with thick vinyl tape about their caps and kept for 30 days for achieving the secular equilibrium between gaseous and non-gaseous decay products of naturally occurring radioactive series.
2.3. Processing of Solid Samples
The solid samples were dried in the sun for several days. In order to obtain representative samples, they were thoroughly mixed, sieved to remove stones, pebbles, grass roots, straws etc. The samples were then crushed into small pieces and dried again in a temperature controlled oven at 100˚C for 24 hours in order to remove the moisture content in the samples. The dried samples were ground to fine powder and passed through a sieve of mesh size of 200 µm. The samples were then filled in cylindrical plastic containers of 6 cm diameter and 7 cm height with a volume of 180 ml. The weights of all the samples were taken by an electronic balance and the net weights of the samples were noted. Finally, the plastic containers were closed by caps and wrapped with thick vinyl tape about their necks to seal the containers tightly. The samples were then stored for about 30 days to assure secular equilibrium between the 238U and 232Th series and with their daughters [5].
2.4. Measurement Set-Up
The detection and measurement of radionuclides in the samples were carried out by gamma spectrometry technique using a vertical coaxial cylindrical HPGe detector of 172 cm3 active volume and of 40% relative efficiency. The p-type HPGe detector supplied by CANBERRA (Model-GC4020) had a resolution of 2 keV at 1332 keV of 60Co gamma ray line. The detector was coupled to a 16 k-channel analyzer. The spectra of all samples were perfectly analyzed using Genie-2000 spectra analysis software (which matched various gamma energy peaks to a library of possible radionuclides) to calculate the concentrations of 238U, 232Th and 40K. The detector was enclosed in a cylindrical shielding container made of lead and iron with 11.3 cm thickness, 51 cm height and 28 cm internal diameter and having a fixed bottom and moving cover to reduce the external g-ray background [6]. All the samples were counted for 10 ks. Prior to the measurement of samples, the environmental gamma background at laboratory site was determined with an identical empty Marinelli beaker and plastic container used in the sample measurement. The energy regions selected for the corresponding radionuclides were 295 keV and 352 keV of 214Pb and 609 keV, 1120 keV and 1764 keV of 214Bi for 226Ra, 583 keV and 2614 keV of 208Tl, 911 keV and 969 keV of 228Ac for 232Th and 1460 keV for 40K [7].
2.5. Calibration of the Detector
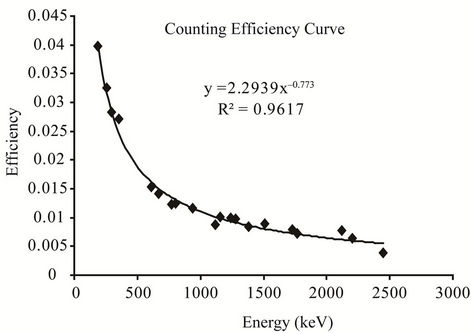
The efficiency calibration of the detector was performed by standard sources of solid and liquid matrices prepared using 226Ra standard solutions [8]. The standard sources were prepared using identical containers used for the measurement of the samples, e.g., 2L Marinelli beakers for liquid and 180 ml plastic container for solid samples. The preparation process of standard sources had been reported elsewhere [9]. The detector efficiency calibration curves as a function of energy for both liquid and solid matrices are shown in Figure 2. The energy calibration of the detector was performed by 137Cs and 60Co point sources.
 (a)
(a)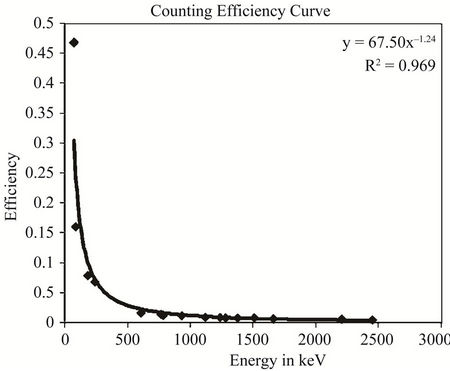 (b)
(b)
Figure 2. Efficiency curve for (a) liquid matrix and (b) solid matrix.
3. Result and Discussions
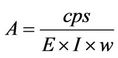
Following the spectrum analysis, count rates for each detected photopeak and activity per mass unit (specific activity or activity concentration) for each of the detected nuclides were calculated. Calculation of count rates for each detected radionuclides depend on the establishment of secular equilibrium reached between 238U and 232Th and for their decay products. Since the detection system gives only the count rate that is proportional to the amount of radioactivity in the samples, the radioactivity concentration in the environmental samples was obtained using the following formula [10]:
 (1)
(1)
where, A = Activity of the sample in Bq·kg–1 or Bq·L–1; cps = the net counts per second = cps for the samplecps for background value; E = the counting efficiency of the gamma energy; I = absolute intensity of the gamma ray; and w = samples net weight (in kg).
The errors in the measurement were expressed in terms of standard deviation (±σ), where σ is expressed as [11]:
 (2)
(2)
where, Ns is the sample counts measured in time Ts and Nb is the background counts measured in time Tb. The standard deviation ±σ in cps was converted into activity in Bq·kg–1 or Bq·L–1 according to Equation (1).
The radionuclides detected and their corresponding activity concentrations in different samples are summarized in Tables 1-7. The radionuclides found in the samples
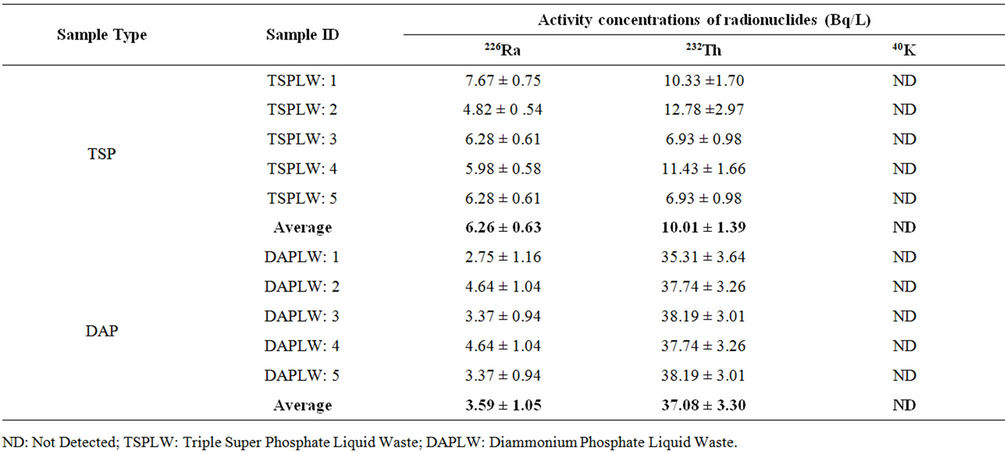
Table 1. Activity concentration of liquid wastes collected from TSP and DAP fertilizer factories.
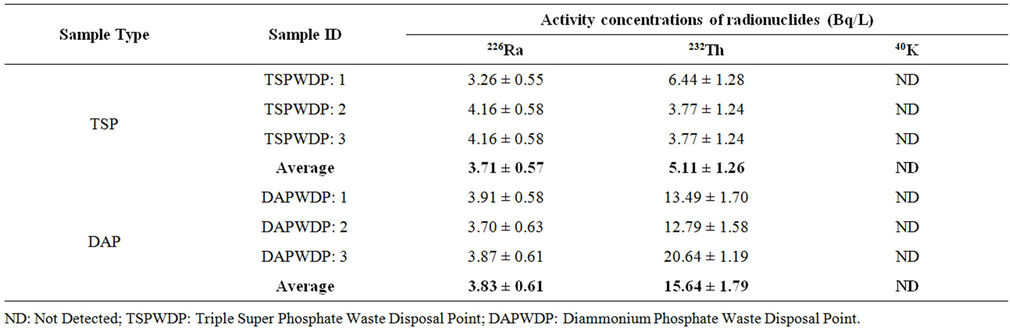
Table 2. Activity concentration of waste-mixed water samples collected from liquid waste disposal point at the Karnaphuli river for both TSP and DAP fertilizer factories.
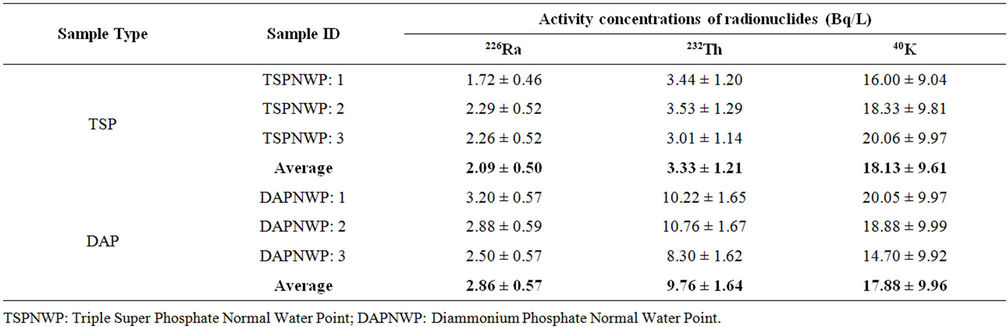
Table 3. Activity concentration of normal river water samples collected from Karnaphuly river adjacent to the TSP and DAP fertilizer factories.
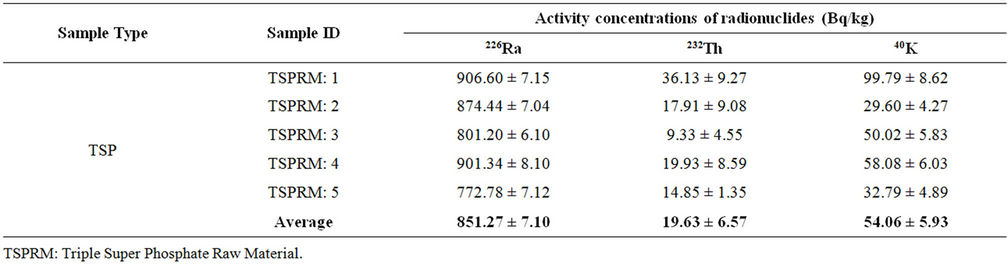
Table 4. Activity concentrations of phosphate rock samples collected from TSP fertilizer factory.
were 214Pb, 214Bi, 228Ac, 208Tl (due to 238U and 232Th decay) and 40K. Only the natural radionuclides were found in the investigation and no artificial radionuclide, such as 137Cs or 89Sr, was detected in any of the samples. It was also observed that no 40K was found in some of the samples. This was due to the fact that the activity present in the samples was below the detection limit of the detector for those samples.
3.1. Activity Concentration of Liquid Samples
The activity concentrations of liquid samples under study (liquid waste, liquid waste-mixed water and normal river water sample) are shown in Tables 1-3. Table 1 shows the activity concentrations of the radionuclides 226Ra, 232Th and 40K detected in the liquid waste samples collected from liquid storage ponds of both TSP and DAP fertilizer factory. The average values of activity
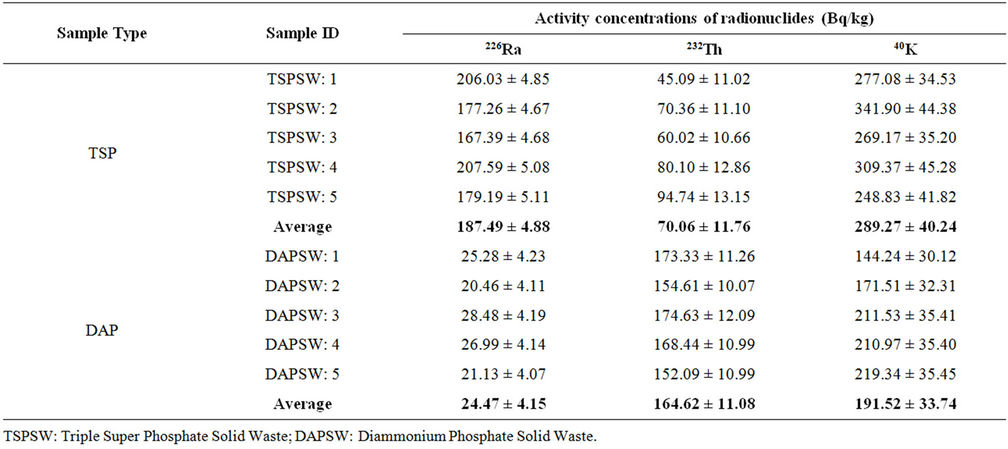
Table 5. Activity concentrations of solid wastes collected from TSP and DAP fertilizer factories.
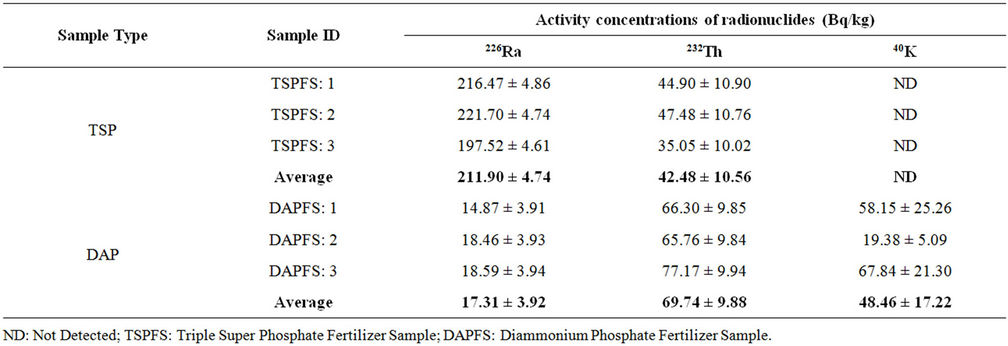
Table 6. Activity concentrations of TSP and DAP fertilizers.
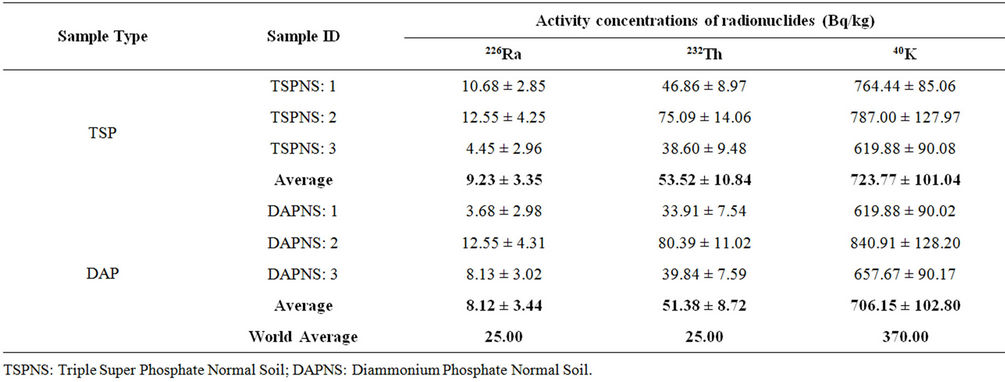
Table 7. Activity concentrations of normal soil samples collected from nearby areas of TSP and DAP fertilizers factories under study.
concentrations of 226Ra, 232Th in these samples were found to be 6.26 ± 0.63 & 10.01 ± 1.39 Bq/L for TSP and 3.59 ± 1.05 & 37.08 ± 3.30 Bq/L for DAP, respectively. However, no 40K was detected in any of the ten samples measured under this category.
The radionuclides and their activity concentrations found in the 6 waste-mixed water samples collected from the liquid waste disposal point of the Karnaphuli river for both TSP and DAP fertilizer factories are shown in Table 2. The activity concentrations of 226Ra, 232Th in these samples were found to be 3.71 ± 0.57 & 5.11 ± 1.26 Bq/L for TSP and 3.83 ± 0.61 & 15.64 ± 1.79 Bq/L for DAP, respectively. Again, no 40K has been found in any of these samples for both the factories. Besides, the concentration levels of the detected radionuclides were also less than those found in the liquid waste samples. This may be attributed to the fact that the liquid wastes were diluted with the river water and consequently, the activity concentration decreased.
Normally, the fertilizers samples which are derived directly from phosphoric acid, i.e., the DAP fertilizer, presents in their composition activity concentrations much lower around the detection limits of the counting system for 226Ra whereas for 232Th, the concentrations found in DAP is more significant. Such results indicate that in the processing of the phosphate rock, a significant amount of 232Th is migrating to phosphoric acid. On the other hand, TSP which is obtained by mixing phosphoric acid with different amount of phosphate rock and NH3, presents higher concentrations of radionuclides 226Ra, 232Th and 40K than DAP [1]. In the current study, the concentrations of 232Th in liquid waste and waste-mixed water samples collected from DAP factory is higher than those of 226Ra which agrees with the above report, however, the values of 226Ra and 232Th detected in the liquid waste and waste-mixed water samples collected from TSP factory are lower than those of DAP factory, except 226Ra in liquid waste sample. This may be attributed to the probable difference in concentration levels of the fertilizer wastes of two factories in the liquid phases.
The activity concentrations of radionuclides of the river water samples collected from the Karnaphuli river flowing by the side of the TSP and DAP fertilizer factories are shown in Table 3. A total of six samples, three samples form the adjacent area of each factory complex, were collected for the investigation and comparison purpose. The activity concentration of 226Ra, 232Th and 40K varied in the range 1.72 ± 0.46 to 3.20 ± 0.57 Bq/L, 3.01 ± 1.14 to 10.76 ± 1.67 Bq/L and 14.70 ± 9.92 to 20.06 ± 9.97 Bq/L, respectively for these samples. The average values of the activity concentrations for these samples are less than those detected in the liquid waste and wastemixed water samples given in Tables 1 and 2. However, these values of activity concentrations are higher than other published data on surface water [12,13]. The comparison of activity concentrations of the detected radionuclides in the liquid waste and normal water samples collected for both the factories shows that the concentrations of 226Ra and 232Th in the liquid waste samples are higher than those of normal water samples.
3.2. Activity Concentration of Solid Samples
The activity concentrations of solid samples under study are shown in Tables 4-7. The activity concentrations of radionuclides in raw materials (phosphate rock) are shown in Table 4. As no phosphate rock is used as the starting materials for producing DAP in Bangladesh, therefore, phosphate rock samples were collected only from the TSP fertilizer factory. A total of five phosphate rock samples were collected and analyzed. The average value of activity concentration of 226Ra, 232Th and 40K were 851.27 ± 7.10, 19.63 ± 6.57 and 54.06 ± 5.93 Bq/kg, respectively with the minimum and maximum values 772.78 ± 7.12 to 906.60 ± 7.15 Bq/kg for 226Ra, 9.33 ± 4.55 to 36.13 ± 9.27 Bq/kg for 232Th and 29.60 ± 4.27 to 99.79 ± 8.62 Bq/kg for 40K. The value of the activity concentration of 226Ra was quite high in this sample. However, this value is consistent with other studies on phosphate rock [1, 14].
The activity concentrations of 226Ra, 232Th and 40K in the solid waste samples collected from both TSP and DAP fertilizer factories are shown in Table 5. A total of ten samples (five samples from each factory) were collected from the two factory complexes. The average values of 226Ra, 232Th and 40K in the samples of TSP factory were 187.49 ± 4.88, 70.06 ± 11.76 and 289.27 ± 40.24 Bq/kg, respectively and that of DAP factory were 24.47 ± 4.15, 164.62 ± 11.08 and 191.52 ± 33.74 Bq/kg, respectively. Relatively higher values of mean activity concentrations of 226Ra and 40K were found in solid waste samples collected from TSP factory than those of DAP factory. However, the activity concentrations of 232Th in waste samples of DAP factory were higher than those of TSP ones.
The activity concentrations of radionuclides in TSP and DAP fertilizers are summarized in Table 6. The value of activity concentration of 40K was below the detection limit for the case of TSP fertilizer, however, it was detected in the case of DAP fertilizer. Moreover, elevated levels of 226Ra in TSP and 232Th in DAP were observed. However, the activity concentrations of the detected radionuclides were comparable or less than the other reports for both TSP and DAP [1,15-17].
The activity concentrations of radionuclides in the normal soil samples collected from the adjacent areas of the TSP and DAP factories are shown in Table 7. The activity concentrations in both types of samples were found to be comparable. The average concentrations of 226Ra, 232Th and 40K in the normal soil samples collected from the adjacent areas of TSP fertilizer factory were found to be 9.23 ± 3.35, 53.52 ± 10.84 and 723.77 ± 101.04 Bq/kg, respectively and those of DAP fertilizer factory were found to be 8.12 ± 3.44, 51.38 ± 8.72 and 706.15 ± 102.80 Bq/kg, respectively. The world average values for these radionuclides for normal soil samples are also quoted in the table [18]. The comparison of concentration data between solid samples (phosphate rock, fertilizer and solid waste) and normal soil samples collected from the two factories shows higher values of 226Ra, 232Th concentrations in the solid samples than those of soil samples except the concentrations of 232Th in phosphate rock samples. However, higher values of 40K were found in the soil samples than those of solid samples.
3.3. Radiological Impact Analysis
The raw materials (phosphate rock) and the wastes (both liquid and solid wastes) generated from the production process of the TSP and DAP fertilizers were stored in the open environment; therefore, these raw materials and wastes have become the constituents of the ambient environment of these factory complexes. Therefore, these wastes could be treated as the part of the ambient environment of the factories contributing to the radiation exposure of the workers of the factories and the general public. From the radiation protection point of view, high activity concentration of natural radionuclides (especially high radium content) of fertilizer and its wastes are significant in two ways regarding the radiation exposure. These may cause external as well as internal radiation exposure to the humans. The external exposure is caused to workers as well as end-users during production process and handling of the raw materials, final products (fertilizers) and by-products. The internal exposure is caused in two ways. First, the accumulation of large quantities of phosphate fertilizers in warehouses increases the radon concentration in the surrounding air which along with the inhalation of fertilizer dust by the workers and end-users may cause to expose internally. Second, the contribution of radioactivity from fertilizer and waste to agricultural lands and eventually to the food chain may contribute to the internal exposure.
Therefore, the radium equivalent activity (Raeq), external radiation hazard index (Hex), absorbed gamma dose rate (D) and annual effective dose (E) for these stored items as well as the normal soil samples (for the purpose of comparison) were calculated using the following equations [19]:
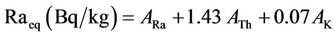 (3)
(3)
where ARa, ATh and AK are the activity concentration in Bq/L or Bq/kg of 226Ra, 232Th and 40K, respectively.
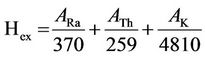 (4)
(4)
where ARa, ATh and AK have the same meaning as in Equation (3).
 (5)
(5)
where ARa, ATh and AK have the same meaning as in Equation (3).
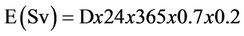 (6)
(6)
In order to estimate the annual effective dose rates, the conversion coefficient from absorbed dose in air to effective dose (0.7 Sv·Gy–1) and outdoor occupancy factor (0.2) proposed by UNSCEAR (2000) were used [20]. The calculated values of Raeq, Hex, D and E are summarized in Table 8. The maximum values of these parameters were found to be 965.24 Bq/kg, 2.61, 444.86 nGy/h and 0.546 mSv/y, respectively in the raw material sample of the TSP fertilizer factory.
The world quoted values for Raeq, Hex, D and E are 370 Bq/kg, 1.0, 55 nGy/h and 0.115 mSv/y, respectively [20]. It is observed that the calculated values of these parameters for raw material and waste samples are higher than those of world average values but lower in the case of normal soil samples except the absorbed dose. However, as per International Commission for Radiological Protection, ICRP [21] the permissible limit of the annual effective dose for public is 1 mSv. Therefore, the annual effective dose from the ambient environment of the factory complex is below the permissible limit and is safe from any immediate health effect. However, between the two factories, the workers of the TSP fertilizer factory and the public adjacent to this factory are more vulnerable to higher radiation exposure than the DAP one. Moreover, the workers of TSP fertilizer factory may get higher external radiation exposure from the phosphate rock if they work longer time around the stock-pile of this material.
4. Conclusion
Detection and determination of activity concentrations of natural radionuclides in raw materials, final products and wastes (both solid and liquid) samples collected from the phosphate fertilizer factories of Bangladesh were carried out. The samples were divided into two types; namely, solid and liquid. The radionuclides detected in the samples were all natural and no artificial radionuclide was found in the study. Normal soil and water samples were also collected and measured for comparison with the solid and liquid samples collected from the fertilizer industries. The hazard index, Hex and annual effective dose,
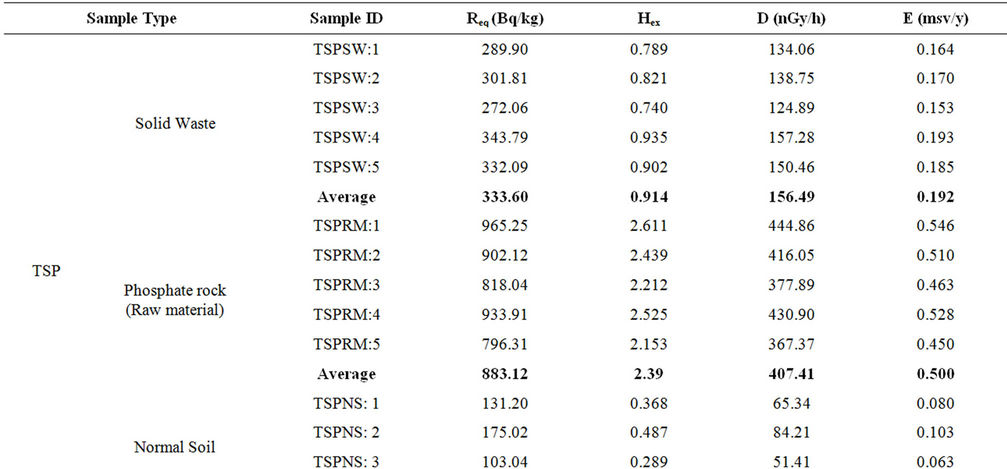
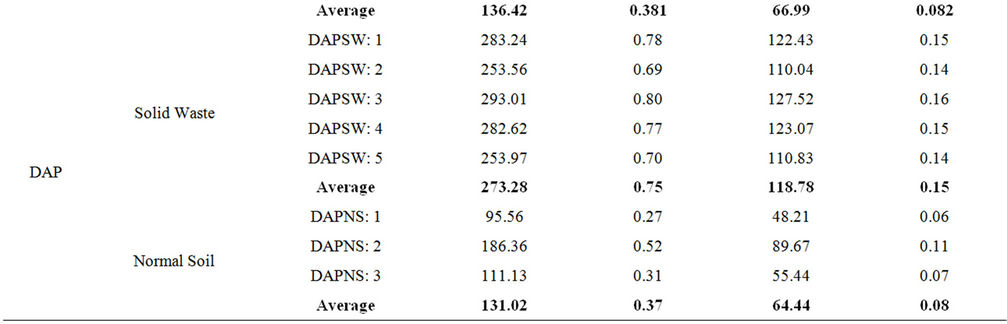
Table 8. Radium equivalent activity, external radiation hazard index, absorbed dose rate and annual effective dose calculated for the raw materials, solid wastes and normal soil samples from both TSP and DAP fertilizer factory.
E for the phosphate rock, wastes and normal soil samples were found within the acceptable limit except the hazard index for phosphate rock which was found higher than unity. This study could be useful as a baseline data on the radiological impact of the fertilizer industry on the public and the environment of Bangladesh.
5. Acknowledgements
The authors would like to thank the University Grants Commission, Bangladesh for the financial assistance to conduct this study.
REFERENCES
- C. H. Saueia, B. P. Mazzilli and D. I. T. Favaro, “Natural Radioactivity in Phosphate Rock, Phosphogypsum and Phosphate Fertilizers in Brazil,” Journal of Radioanalytical and Nuclear Chemistry, Vol. 264, No. 2, 2005, pp. 445-448. doi:10.1007/s10967-005-0735-4
- C. H. R. Saueia and B. P. Mazzilli, “Distribution of Natural Radionuclides in the Production and Use of Phosphate Fertilizers in Brazil,” Journal of Environmental Radioactivity, Vol. 89, No. 3, 2006, pp. 229-239. doi:10.1016/j.jenvrad.2006.05.009
- B. Mazzilli, V. Palmiro, C. Saucia and M. B. Nisti, “Radiochemical Characterization of Brazilian Phosphogypsum.” Journal of Environmental Radioactivity, Vol. 49, No. 1, 2000, pp. 113-122. doi:10.1016/S0265-931X(99)00097-1
- International Atomic Energy Agency, “Measurement of Radionuclides in Food and the Environment,” Technical Report No. 295, Vienna, 1989.
- M. Tufail, M. Iqbal and S. M. Mirza, “Radiation Doses Due to Natural Radioactivity in Pakistan Marble,” Radioprotection, Vol. 35, No. 3, 2000, pp. 299-310.
- M. Islam, N. M. N. Alam, M. N. Mustafa, N. Siddique, M. M. H. Miah, S. L. Shaha, M. I. Chowdhury, M. Kamal, L. Ali and P. K. Roy, “Characteristics of a Shielding Arrangement for a HPGe Detector Designed and Fabricated Locally,” Chittagong University Studies, Part II, Science, Vol. 14, No. 2, 1990, pp. 105-111.
- C. E. Roessier, Z. A. Smith, W. E. Bolch and R. J. Prince, “Uranium and Radium in Floride Phosphate Materials,” Health Physics, Vol. 37, No. 3, 1979, pp. 269-277. doi:10.1097/00004032-197909000-00001
- M. S. Tahawy, M. A. Rarouk, F. H. Hammad and N. M. Ibrahiem, “Natural Potassium as a Standard Source for the Absolute Efficiency Calibration of Ge Detectors,” Journal of Nuclear Science, Vol. 29, 1992, pp. 361-363.
- S. Harb, K. S. Din and A. Abbady, “Study of Efficiency Calibrations of HPGe Detectors for Radioactivity Measurement of Environmental Samples,” Proceedings of the 3rd Environmental Physics Conference, Aswan, 19-23 February 2008.
- M. A. Usif and A. E. Taher, “Radiological Assessment of Abu-Tartur Phosphate, Western Desert Egypt,” Radiation Protection Dosimetry, Vol. 130, No. 2, 2008, pp. 228-235. doi:10.1093/rpd/ncm502
- G. F. Knoll, “Radiation Detection and Measurement,” 3 Edition, John Wiley & Sons, New York, 1998.
- S. Long, S. Sdraulig, L. Hardege and J. Mcleigh, “The Radioactivity Content of Some Australian Drinking Water,” ARPANSA Technical Report Series, No. 148, 2008.
- UNSCEAR, “Sources and Effects of Ionizing Radiation,” United Nations Scientific Committee on the Effects of Ionizing Radiation, New York, 8 December 2000, pp. 84- 156.
- A. E. Taher and S. Makhluf, “Natural Radioactivity Levels in Phosphate Fertilizer and Its Environmental Implications in Assuit Governorate, Upper Egypt,” Indian Journal of Pure and Applied Physics, Vol. 48, No. 10, 2010, pp. 697-702.
- N. K. Ahmed and A. B. M. El-Arabi, “Natural Radioactivity in Farm Soil and Phosphate Fertilizer and Its Environmental Implications in Qena Governorate, Upper Egypt,” Journal of Environmental Radioactivity, Vol. 84, No. 1, 2005, pp. 51-64. doi:10.1016/j.jenvrad.2005.04.007
- S. M. El-Bahi, N. W. El-Dine and A. El-Shershaby, “Elemental Analysis of Egyptian Phosphate Fertilizer Components,” Health Physics, Vol. 86, No. 3, 2004, pp. 302- 307. doi:10.1097/00004032-200403000-00007
- M. N. Alam, M. I. Chowdhury, M. Kamal, S. Ghose, H. Banu and D. Chakraborty, “Radioactivity in Chemical Fertilizers Used in Bangladesh,” Applied Radiation and Isotopes, Vol. 48, No. 8, 1997, pp. 1165-1168. doi:10.1016/S0969-8043(97)00019-5
- UNSCEAR, United Nations Scientific Committee on the Effects of Atomic Radiation, “Source, Effects and Risk of Ionizing Radiation,” Report to the General Assembly, New York, 1988.
- P. Kessaratikoon and S. Awaekechi, “Natural Radioactivity Measurement in Soil Samples Collected from Municipal Area of Hat Yai District in Songkhla Province,” King Mongkut’s Institute of Technology Ladkrabang Science Journal, Vol. 8, No. 2, 2008, pp. 52-58.
- UNSCEAR, “United Nations Scientific Committee on the Effects of Atomic Radiation,” Report of UNSCEAR to the General Assembly, New York, 2000, pp. 111-125.
- International Commission on Radiological Protection, “Recommendations of the ICRP,” Publication 60, 1990.
NOTES
*Corresponding author.