Atmospheric and Climate Sciences
Vol.3 No.1(2013), Article ID:27583,11 pages DOI:10.4236/acs.2013.31014
Dynamics and Diurnal Variations of Surface Radiation Budget over Agricultural Crops Located in Sudanian Climate
Laboratoire de Physique du Rayonnement (LPR), Faculté des Sciences et Techniques (FAST), Université d’Abomey-Calavi, Cotonou, Bénin
Email: *kbbasile@gmail.com
Received October 2, 2012; revised November 1, 2012; accepted November 8, 2012
Keywords: Net Radiation; Short Wave Radiation; Long Wave Radiation; Sudanian Climate
ABSTRACT
Energy exchange between land and atmosphere are important in climatic processes. In this paper, the seasonal dynamics and diurnal variations of surface radiation components of agricultural crops are investigated. One year data are used to emphasize the separate contribution of each radiation balance component. From the energy budget equation and FAO empirical model, we compare the clear sky solar radiation and the incoming short wave radiation in order to highlight aerosols and water vapor role in the studied area. The analysis show two important results: 1) The relevance of the short wave radiation in the net radiation budget especially in the wet season and 2) The variations of the long wave radiation were small. Analyses provide an understanding of net radiation seasonal variations in the northern part of Benin.
1. Introduction
The surface radiative energy remains the primary component of the energy balance of the earth atmosphere system and is a central determinant of the earth’s climate. Energy is exchanged between the surface and the air radiatively at visible and infrared wavelengths through conduction, convection, or latently [1]. This energy at the surface of earth is important to many inter-related research disciplines such as atmospheric sciences, hydrology, agrometeorology, and climatology. According to [2], the incoming short wave radiation is a primary source for photosynthetic activity and the hydrological cycle. The availability of surface radiation is also important for architects and solar engineers. It gives an accurate estimate of the available solar energy resource.
The sun is the main source of energy that influences atmospheric motions and the many various processes in the atmosphere and surface layers of earth [3]. A significant proportion of incoming solar radiation (short wave, λ < 3 μm) suffers depletion as it passes through the atmosphere by a combination of processes such as, scattering and absorption by cloud and aerosols. On the ground, a part of the incoming radiation is reflected depending on the surface nature; the rest is absorbed. Both absorption and reflection by the surface are taking place in the visible and infrared layers (long wave, 3 μm < λ < 100 μm). Atmospheric constituents such as water vapor and clouds absorb energy and reemit the same partly downward to the surface as long wave radiation. Therefore, the net radiation (Rn) represents the algebraic sum of the incoming and outgoing short wave and long wave radiatives fluxes.
Few studies have been focused on the dynamic and diurnal variations of surface radiation balance in sudanian climate (Northern part of Benin). Only Awanou et al. [4] were the first who have suggested a passive cooling system by the “diode” roof for enjoying a good thermal comfort in building in the hot and arid countries. Afterwards, [5] provided information on the characteristics of solar radiation in Benin. He used Frère and Rietveld’s model to determine, correlation constants of dimensionless parameters for many stations located in Benin.
For the past years, West Africa region has experienced the most significant climate change following by a strong rainfall variability deficit that induced drought periods and disastrous consequences on agricultural activities, economic development and living conditions [6]. Eva et al. [7] showed that this region has lost 16% of its forests and 5% of its woodlands and grasslands over the 1975 to 2000 period, equating to over 50,000 km2 per year of natural vegetation. The majority of this has been converted to agricultural lands. Such large changes in land cover have repercussions at surface climate. The replacement of natural vegetation by agriculture increases the land surface albedo which accentuates the magnitude and duration of drought. Surface alteration is linked to the climate change. The feedback between climate change and the variability of surface radiation balance are still poorly understood, despite the fact that its dynamics and diurnal variations are known to play a major role in the water and energy cycle of the West African Monsoon [8].
In the Northern part of Benin, the knowledge of the partition of surface net radiation will provide important information about its component contribution to the available energy at the surface. Mamadou et al. [9] found that solar energy input dominates the land surface processes in this region. According to [10], net radiation variations through energy exchanges between surface and air could lead to the modifications of the land processes and however to the modification of the Planetary Boundary Layer (PBL). For example, albedo (ratio of SWup to SWin) change affects directly the surface energy balance. Charney et al. [11] showed in semi arid regions that an increase in the albedo leads to a loss of radiative energy absorbed at the surface and convective overturning is reduced. As results, precipitation decrease.
This region where there is an abundance of solar radiation, the important climate signals is driven by the diurnal cycle of incoming solar radiation [12] controlled by the surface type, availability of water for evaporation/condensation, cloud field. Dynamics and diurnal variations of the surface radiation balance are large and important but have not yet been properly understood in this region. Therefore, the evaluation the surface radiation dynamics and diurnal variations at the landscape scale in sudanian climate will be useful to develop and initialize parameterizations scheme for atmospheric modeling in order to contribute for example, to accurate predictions of climate. This study provides estimates of radiative fluxes at relevant scales for atmospherics models by testing land surface processes parameterization used in meteorological models [13].
The aims of this study is to give an overview of 2008 surface radiative fluxes dynamic over agricultural crops and describe more thoroughly their diurnal variations during each months of the studied year from observations data. We compare in addition, the clear sky solar radiation and the incoming short wave radiation in order to highlight aerosols and water vapor role in this sudanian climate.
2. Materials and Methods
2.1. Study Area and Its Description
The study site is a fallow located at Nalohou village (9˚74'48N, 1˚60'46E, a.s.l 449 m) in the north of Benin.
It was established in July 2007 as part of the AMMACATCH network [14]. This site is located within tropical zone in West Africa. The climate is sudanian with a single dry season (5 months, from November to March) and wet season (7 months, from April to October). Long term 1959-2005 (1190 mm) mean annual precipitation and air mean temperature (29˚C) [15,16].
At the measurement site, the landscape is flat to gently undulating and the vegetative surface is fallow bush surrounded by a mixed crops type from north to south (Figure 1). To the north sparse savannah continues for nearly 2 km, while to the south of the station, vegetation is dominated by cultivated areas representing 25% [17] of the region at Donga basin scale. At the end of wet season, farmers generally burn all fallow vegetation, even in the natural area. Crops area returns to the bare soil until a new sending at the beginning of the wet season [18]. The fallow layer of the studied site represents 31% [17] of the area and grows between March (0 m) and November (3 m) which changed texture from leafy-green to yellow leaves in the course of the seasons. Dry herbs are generally burned at the end of November.
2.2. Data and Methods
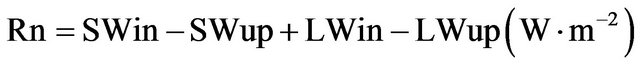
The present work is based on the data collected over agricultural crops area in Nalohou. An automatic weather station installed in Nalohou, has been acquiring data at a 15-min step since July 2007. The four components of the radiation balance are measured with a CNR1 (Kipp and Zonen) sensor. Rn is deduced from the energy budget Equation (1) given by:
 (1)
(1)
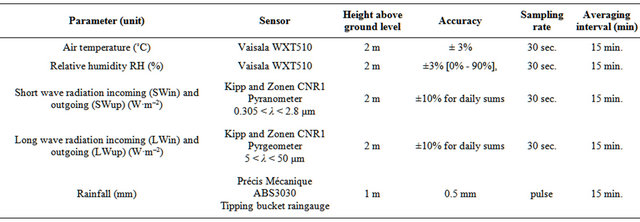
where Rn, SWin, SWup, LWin and LWup are respectively net radiation; incoming and outgoing short wave radiation and incoming and outgoing long wave radiation. Air temperature, relative humidity are recorded with a WXT510 (Vaisala) together with wind speed and direction, and rainfall (Précis Mécanique ABS3030) at 2 m above the ground. Data are stored in a data logger (CR10X, Campbell). The characteristics of sensors can be found in the Table 1. During 2008 year, no gap was observed in the dataset. The daily average values have been computed over 24-h period, the same rule was followed for computing daily minima and maxima as well as diurnal composites.
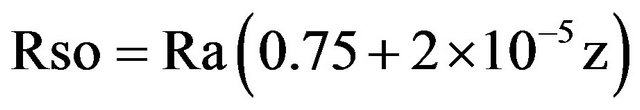
The clear-sky radiation Rso which represents the solar radiation that would reach the surface under cloudless conditions is calculated by using Allen et al. [19] relation.
 (2)
(2)
where z (m) is station elevation above the sea level. The
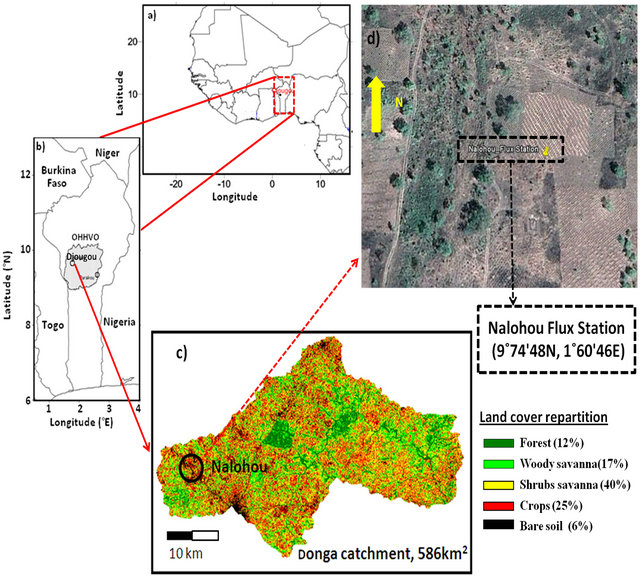
Figure 1. Location of the Nalohou station: (a) in Benin; West Africa; (b) Localisation of Djougou in the Ouémé catchement; (c) Land cover of the Donga catchment; (d) Nalohou station.
Table 1. Summary of the instrumentation of Nalohou for the measurement presented in this paper.
extraterrestrial radiation, Ra for each day of the year is estimated from the solar constant, the solar declination and the day of the year by:
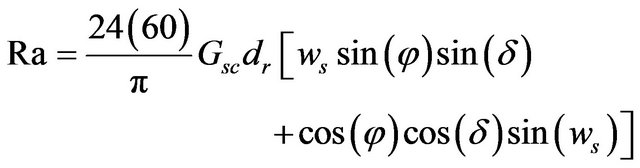 (3)
(3)
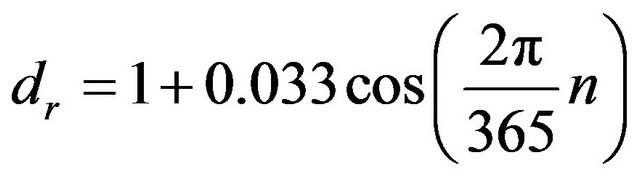
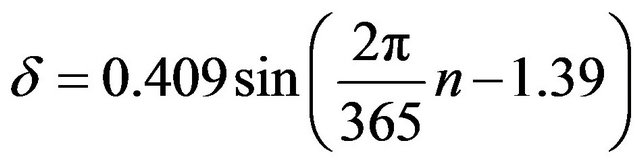
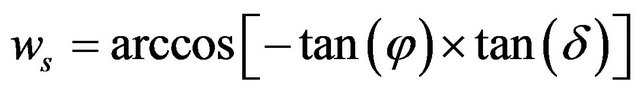
Ra extraterrestrial radiation [MJ∙m−2∙day−1], Gsc solar constant equal to 0.0820 [MJ∙m−2∙day−1]; dr inverse relative distance between earth-sun; ws [rad] the sunset hour angle, δ [rad] solar declination and φ [rad] the latitude. dr, δ, ws are given by:
 (4)
(4)
 (5)
(5)
 (6)
(6)
where n is the number of the day in the year between 1 January and 31 December. The results presented below were obtained apart from the studied station coordinates and observations measured in situ. All of the observation times are recorded as GMT time.
3. Results and Discussion
3.1. Weather Conditions
Results presented in this paper cover January to December 2008 period thereby including one rainy season as well as one dry season. Total amount of rainfall (1218 mm; Figure 2(a)) is comparable to the value found by [15]. Variations of air temperature and relative humidity during the study period are shown in (Figure 2(b)). The relative humidity gradually increases from his lowest values (~25%) several weeks before the first rainy event. It becomes consistent during the well established monsoon and reaches 95%. The decrease of air temperature was observed later, after the first significant rainy event. Air temperature decreases continuously from its annual maximum (30.8˚C) in March and reaches its annual lower value (~21˚C) in August when the monsoon flow is well established (Figure 2(a)). During the earlier and late monsoon period, sharp humidity variations observed, are linked to changes in wind direction. Variations of air temperature and relative humidity during dry and wet seasons highlight the climatic context of the study area.
3.2. Annual Patterns of Net Radiation Rn
Seasonal variations of surface radiative budget are distinctive (Figure 3) over the experimental site. During 2008, it increases gradually from ~60 W∙m−2 (daily mean) at the beginning of the year to 92 W∙m−2 until the end of March. Under the rainfall events, it has sudden variations followed by a slow increase until July. Within the influence of the persistence of the monsoon, a slight drop occurs between July and August months when the annual minimum of about 7 W∙m−2 is observed on DOY 188. Towards late August, it increases quickly and reaches its annual maximum of about 190 W∙m−2 at DOY 287 in
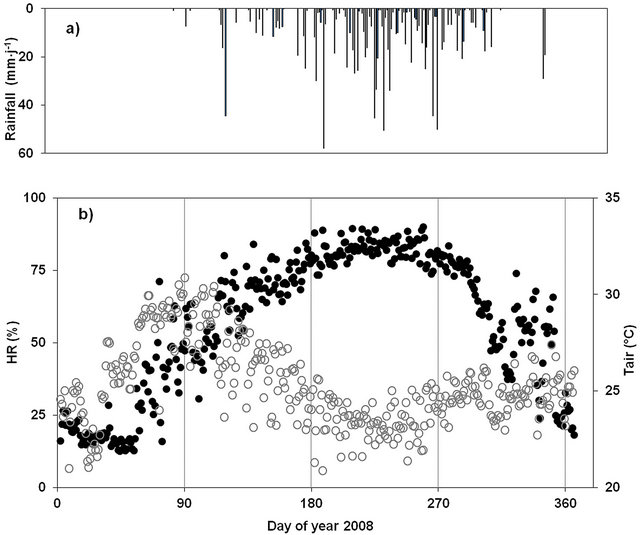
Figure 2. (a) Rainfall (upper vertical line); (b) Time series (daily mean) of relative humidity (black dots, left axis) and air temperature (grey circle, right axis).
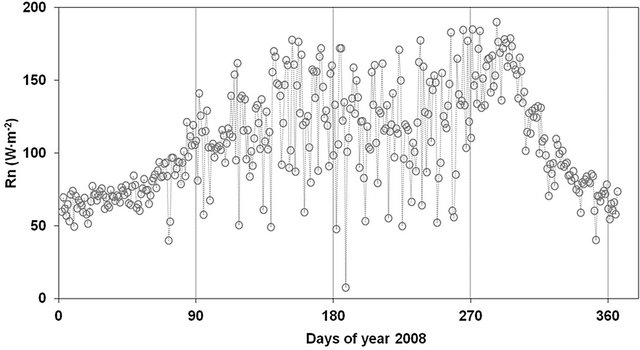
Figure 3. Time series (daily mean) of net radiation.
October. The following decrease is also fast until December when it roughly reaches 60 W∙m−2. This well defined seasonal variations results from a combination of changes in surface incoming and outgoing short wave and long wave fluxes.
These change result surface and atmospheric processes which are differently coupled throughout the year.
Two main phenomena result in the net radiation peak on the experimental site:
• First, the growth of fallow is triggered by the rainfall events (Figure 2). The expansion of the greening up leaves decreases albedo (Figure 4(c)) and reduces the long wave losses because the herbaceous fallows are cooler than bare soil.
• Second factor leading to the higher net radiation during late monsoon season is the availability of soil moisture. Since water availability favours latent heat over sensible heat, it increases surface cooling and diminishes long wave losses, thus increasing net radiation [20]. In addition to that effect, soil moisture enables fallow growth, and indirectly increases Rn.
3.3. Short Wave Fluxes: Rso, SWin, SWup and the Surface Albedo
Figure 4 displays respectively the daily mean of clear sky solar radiation Rso, the short wave incoming radiation (SWin), short wave outgoing (SWup) and surface albedo. Rso increases from his lowest values (~270 W∙m−2) at the beginning of the year (January), and reaches its first maximum (330 W∙m−2) in March (Figure 4(a)). Later, it decreases to 320 W∙m−2 till June, and starts increasing again. Short wave incoming radiation (SWin) increases with clear solar radiation (Rso) from January to early the beginning of March afterwards, weakens sharply until August with lot of isolated peaks during rainy season. Later, it starts to increase till to October and decrease slowly after. The pattern of SWin involves change in humidity, but also a significant radiative forcing by clouds and aerosols (Figure 4(a)).
The short wave outgoing radiation SWup (Figure 4(b)) seems to follow the pattern of SWin except for a weakly decrease observed during late October and November. The consistent decrease developing through the monsoon season is linked to the growth of vegetation, which is darker than the bright dry surface. When looking at the variations of surface albedo, it decreases weakly from (0.23) several days before the first rainfall event (arrow 1 on Figure 4(c)), likely due to the moist air from the south. After the first significant rainfall event (13.8 mm, arrow 2 on Figure 4(c)) which occurs on DOY 92, within an important short wave incoming radiation, soil dries up rapidly leads to an abrupt increase in albedo patterns. During the rainy season, we denoted consistent variations of albedo. It is driven down by vegetation growth and soil wetting, reaching lower values (~0.12, arrow 3 on Figure 4(c)). Afterwards, fallow burning mirroring in SWup pattern leads to a rapid increase of albedo (DOY 290 - 295), peak of 0.19, arrow 4 on Figure 4(c). The last significant rainy events (52 mm; 2.8 mm) observed respectively on the 20th and 21st November explain the abrupt decrease denotes in albedo patterns (arrow 5 on Figure 4(c)). Towards December, surface drying reflecting in SWup induces its increasing from 0.16 to 0.2. These values are closed to those observed at the beginning of the year. These distinct seasonal variations obtained from surface albedo (SWup/SWin) pattern indicate different behavior of this land cover in sudanian climate. Through its variations, one can also distinguish the seasonal reflective power of this land cover.
Albedo values obtained in this study are comparable to those of West African region. Monteney et al. [21] found through their studies conducted over a tropical humid area at Abidjan values of 0.13 for bare soil during the dry season. In the Sahel, Ramier et al. [22] found over the
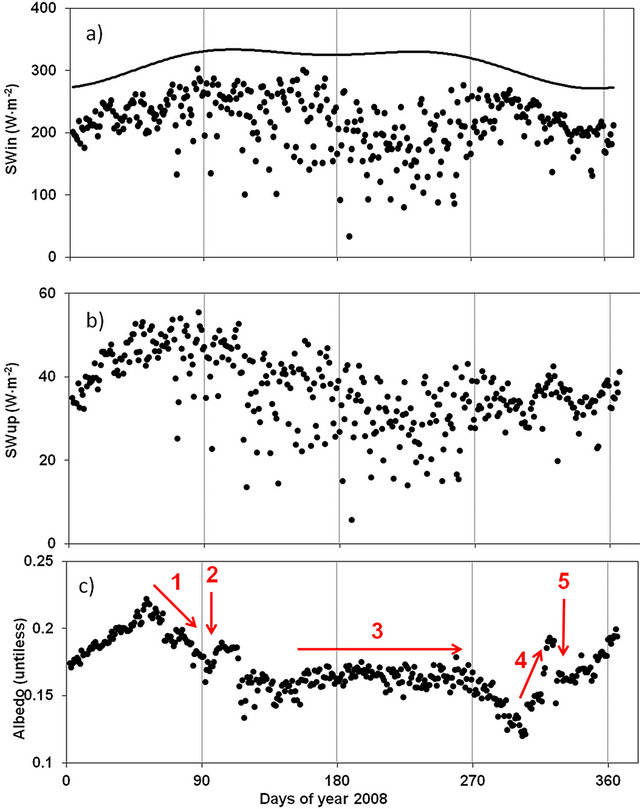
Figure 4. (a) Time series (daily mean) of clear-sky solar radiation (black solid line in the upper) and surface incoming shortwave radiation; (b) Time series (daily mean) of outgoing short wave radiation; (c) Daily mean of surface albedo (SWup/ SWin). 1—Moist air from the south mirroring in SWin pattern; 2—First significant rainy event; 3—Soil wetting; 4—Fallow burning lead to an increasing of SWup mirroring in albedo pattern; 5—Last rainy event on 20th and 21st November: amount of 52 mm and 2.8 mm respectively.
fallow values of 0.2 and 0.35 respectively during rainy and dry season. Guyot [23] found above the woody savannah in the sudanian climate values close to those obtained in this study over agricultural crops. These different albedo variations in West Africa land covers highlight the need for in situ observations, which are for example essentials to validate Soil-Vegetation-AtmosphereTransfer (SVAT) models.
3.4. Long Wave Fluxes: LWin, LWup
Figure 5 illustrates the daily variation of the long wave fluxes. Seasonal patterns of incoming (Figure 5(a)) and outgoing (Figure 5(b)) long wave fluxes are also distinctive. The long wave outgoing LWup and air temperature
(Figure 2(b)) exhibits similar seasonal evolutions whereas; LWin follows the relative humidity patterns. During January, February and March of the studied year, LWin and LWup increase respectively from lower values (314 W∙m−2; 440 W∙m−2) to reach their first maxima in March. Later, LWin displays consistent variations (around 420 W∙m−2). We observe that LWin and LWup are negatively correlated during the monsoon period. The maximum of LWin (420 W∙m−2) obtained in August coincides with the minimum of LWup (427 W∙m−2). As result, long wave balance (LWin − LWup) during this period is little negative (Figure 6). As water vapor has an important band in long waver layer, absorption by clouds is small, only few quantities were loosed and major parts were observed at
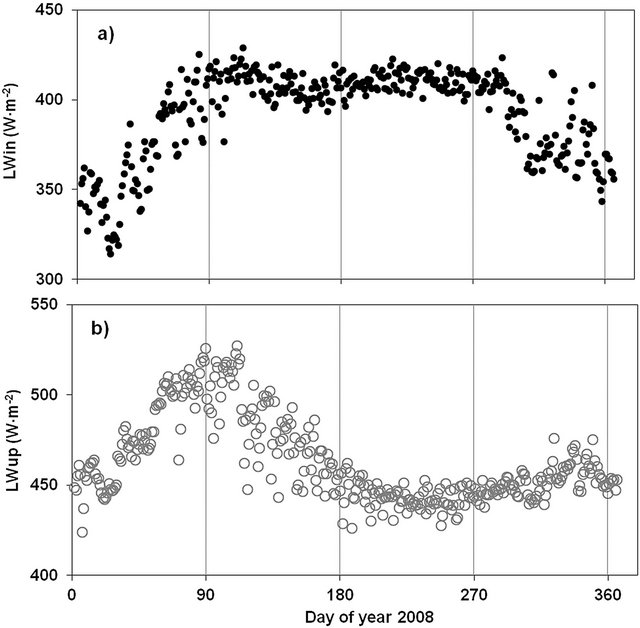
Figure 5. (a) Time series (daily mean) of surface incoming long wave radiation (black dots); (b) Daily mean of surface outgoing long wave radiation (grey circle).
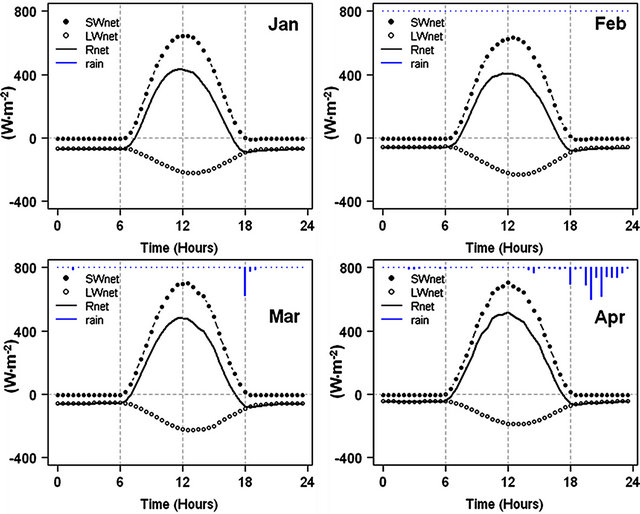
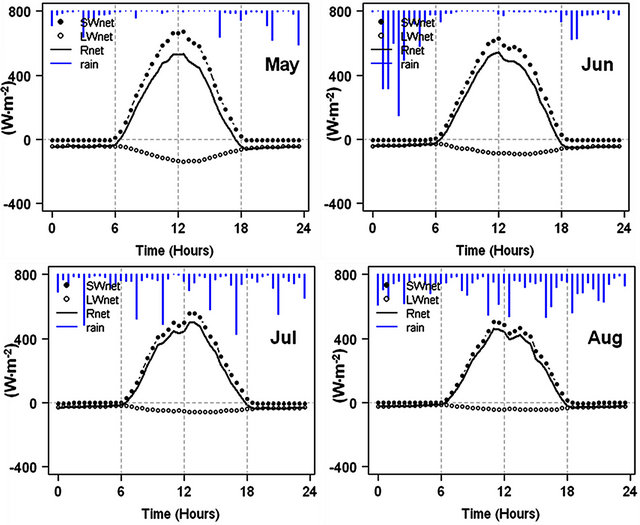
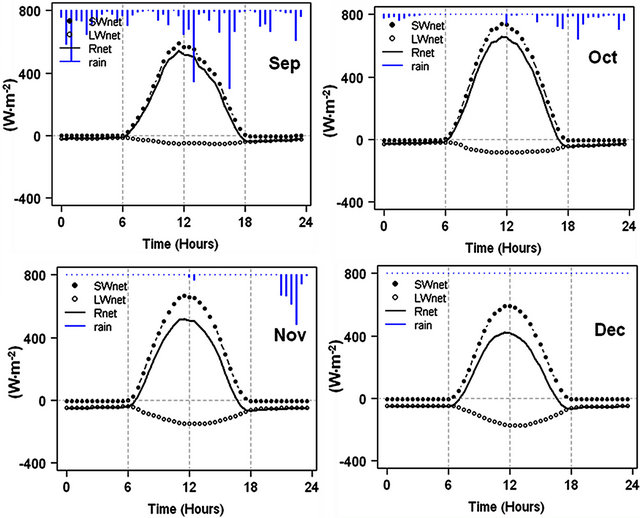
Figure 6. Monthly composite of the net short wave radiation (black dots), net long wave radiation (black circle) and net radiation (black curve) and rainy events composite (blue lines).
surface. Moreover, abundant water vapor due to higher evapotranspiration induces large incoming long wave radiation.
3.5. Monthly Diurnal Variations of Surface Radiative Fluxes
Radiative heat fluxes at the Earth’s surface are important drivers of land surface energy balance. Figure 6 shows the monthly diurnal variations of the net short wave radiation SWnet (SWnet = SWin – SWup), the net long wave radiation LWnet (LWnet = LWin – LWup) and the net radiation Rn for the individual months in 2008 (January to December) at Nalohou experimental site. For the evening hours of all months, the net radiation flux is observed to be low and negative, with the magnitude ranging between 0 and about –109 W∙m−2. By early morning (at about 06:30), Rn changes to positive and it increases to reach a maximum of about 853 W∙m−2 (or less for some months) at around 12:30. In the late afternoons, net radiation flux density decreases steadily to a minimum at about 19:00 after which, it again changes sign to negative with fairly constant value throughout the evening hours. We can distinguish a strong and distinctive dynamic of the monthly diurnal cycle of the surface radiative fluxes. We merge together the months which present some similarity and make comments through these grouping months.
1) January-February-March-April (JFMA) diurnal cycle: During these months, the surface is dry and soil is warm. The day-to-day variability of SWnet, LWnet and Rn are low; diurnal cycles are well defined and symmetric involving the predominance of clear days. Nighttime values of LWnet are strongly negative and the absolute daytime large, which means that the surface heating is more intense (LWup > LWin) during the day, the reverse phenomena is present over the night. SWnet is almost 0 W∙m−2 during nighttime hours while LWnet is fairly negative, bringing to negative nocturnal values of Rn. From April month, the surface heating undergoes a gradual decrease, and a small increase of net radiation is observed compare to previous months. The monthly maxima mean observed are: 863 W∙m−2; –235 W∙m−2; 661.5 W∙m−2 for SWnet, LWnet and Rn respectively.
2) May-June-July-August (MJJA) diurnal cycle: The arrival of the monsoon flow regime leads to the cooling of the atmosphere and surface; this increases daytime absolute LWnet because clouds and water vapor through their absorbent-diffusion nature, re-emit largely the quantity of energy absorbed in long wave length (3 μm - 100 μm). Thus, the result is a small increase of the net radiative flux. The symmetric shape of SWnet and Rn diurnal cycles disappears from July to August month. (MJJA) diurnal cycles are characterized by a large day to day variability. LWnet reaches minimal values down to 0 W∙m−2 between August and September. All of the incoming long wave radiation is reflected as outgoing. During these months, more than 95% of the net radiation emanates from SWnet at the monthly time scale. Wet atmosphere and small outgoing LWnet reduced diurnal temperature range and maximal air temperature. The annual minimal value of air temperature was observed during the August month. Net shortwave radiation SWnet diurnal peak phases with that of the net radiation. It can be noticed when looking at diurnal cycle of the rainy events during (MJJA), that rains occur preferentially during nighttime in May and June while in July and August, it appears all the time. This rainy events distribution is not without effect on the radiation cycle. The diurnal cycle of SWnet and Rn are dissymmetric; it may be explained by the presence of clouds between 12:30-14:00 during June and August whereas, in July they cross the area before the midday (11:00 to 12:00). These combined effects could be the source of the observed time difference in peak of SWnet and Rn. In addition, the maximum peaks in SWnet and Rn correspond to the clear sky preceded by heavy rainy event. The effect of these rains is to leach the atmosphere of dust and aerosols that it contains [24]. The monthly maxima mean values were: 926.5 W∙m−2 (SWnet); –290.6 W∙m−2 (LWnet) and 853.25 W∙m−2 (Rn).
3) September-October-November-December (SOND) diurnal cycle: The daytime net radiation and net shortwave radiation observed were higher than that during the previous months; because of the large incoming radiation is the maximum during the (SOND) months especially in October and November. The heating surface cycle begins again in October. Higher absolute value of LWnet is observed, mainly due to the decrease of LWin. Often, change of wind direction regime from Southwest to Northeast is followed by the arrival of dust over the region. This effect explains the decrease of LWin which occurs during (SOND) since, spectral absorption curve of in long wave layer. By comparing (SOND) and (JFMA) cycles, presence of dust reduces significantly net radiation during (JFMA) more than (SOND); because of considerably extinction of solar radiation in short and long wave layers due to the dust. The monthly maxima mean values were: 913.45 W∙m−2 (SWnet); –301.85 W∙m−2 (LWnet) and 844.5 W∙m−2 (Rn).
3.6. Link between Net Radiation and Relative Humidity
Figure 7 compares daily mean of LWnet binned by the near surface relative humidity. Outgoing LWnet increases as relative humidity increases. Some scattered around the fitting curve were observed for the lowers cases. A polynomial relationship (LWnet = 0.0184 × HR2 – 0.6588
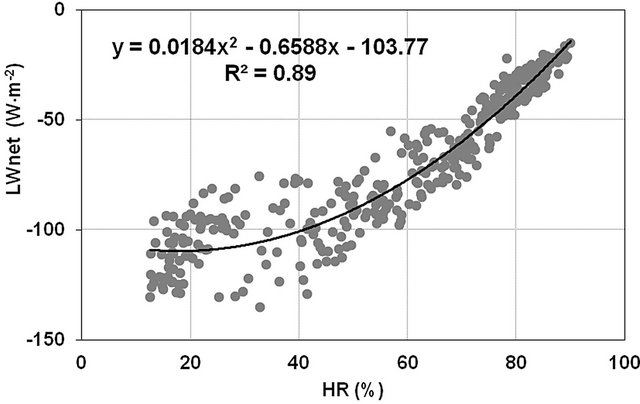
Figure 7. Correlation between the net long wave and the 2 m relative humidity for the entire year.
× HR – 103.77) is found between LWnet and HR with a good determination coefficient (R2 = 0.89). Such correlation allows us to highlight the fundamental role of LWnet in the diurnal cycle over the land especially in the land atmosphere coupling. According to [25], the stronger LWnet cooling of the surface gives a lower minimum surface temperature. This hypothesis is valid in our study area. However, it remains necessary to deepen this in order to validate these findings.
3.7. Role of Net Radiation in Vegetation Growth
As plants respond to external factors in changing their own physiological activities [26] the large variations of net radiation between April and October (Figure 3) at Nalohou should significantly contribute to vegetative growth during this period of the year. Indeed, changes in the net radiation induce upward movement of sap through which occurs an important water and mineral transport to aerial organs [26]. Sap prevails during this period favors in this way transpiration of plant and could be particularly critical in the performance of agriculture. Despite the fact that the soil was bare during the (JFMA) months, evapotranspiration flux over the studied site doesn’t vanish [9]. Trees located around the measurements site keep transpiration activity even in dry season over this region [9]; since the mechanism of transpiration allows maintenance of the water balance of plants.
4. Conclusion
This paper provides a description of the diurnal variations of surface radiative fluxes in a sudanian location within the West African region. The dynamic and diurnal variations show that the dry months have larger values of the net long wave radiation than the wet months. Diurnal mean values of the net surface radiation varied from 65 W∙m−2 to 465 W∙m−2 depending on sky atmospherics conditions. Extinction of the incoming short wave radiation by clouds (during wet season) and aerosols (dry season) are identified as two major factors responsible for the low values of the daytime net radiation obtained. Over this agricultural sudanian site, the net long wave radiation during the cold period (July-August months) is higher than the net long wave radiation in warm period (for about 200 W∙m−2). Variations of the net radiation are almost equal to the net short wave flux as the changes in the net long wave are small during the wet months. This analysis provides an understanding of the seasonal variations of the net radiation in sudanian climate, in this way the components of the surface radiation balance. Finally, it would be interesting to assess the part of representative plant transpiration during several seasonal cycles in order to: 1) Know the seasonal variations of plant transpiration and 2) Deduce the role of net radiation in the regulating of photosynthetic activity of plants over the sudanian climate.
REFERENCES
- J. Skhula and P. A. Dirmeyer, “Albedo as a Modulator of Climate Response to Tropical Deforestation,” Journal of Geophysical Research, Vol. 99, No. D10, 1994, pp. 863- 877.
- G. M. Woodwell, “Radiation and the Patterns of Nature,” Science, Vol. 156, No. 3774, 1967, pp.461-470. doi:10.1126/science.156.3774.461
- K. Ya. Kondratyev, “Radiation in the Atmosphere,” Academic Press Inc., Waltham, 1969.
- C. N. Awanou, P. F. Kieno and X. Berger, “Climatisation en Pays Chauds et Secs par Toiture Diode,” Revue de Physique Appliquée, Vol. 22, No. 6, 1987, pp. 413-423. doi:10.1051/rphysap:01987002206041300
- S. Amoussa, “Estimation of Global Solar Radiation in Benin,” Renewable Energy, Vol. 2, No. 3, 1992, pp. 311- 317. doi:10.1016/0960-1481(92)90043-3
- S. E. Nicholson, “Climatic and Environmental Change in Africa during the Last Two Centuries,” Climate Research, Vol. 17, No. 2, 2001, pp. 123-144. doi:10.3354/cr017123
- H. D. Eva, A. Brink and D. Simonetti, “Monitoring Land Cover Dynamics in Sub-Saharian Africa. A Pilot Studing Using Earth Observing Satellite Data from 1975 and 2000,” European Commission Directorate-General, EUR 22498 EN-DG Joint Research Centre, Institute for Environment and Sustainability, Office for Official Publications of the European Communities, Luxembourg, 2006.
- J. G. Charney, “Dynamics of Deserts and Drought in the Sahel,” Quarterly Journal Royal Meteorology Society, Vol. 101, No. 428, 1975, pp.193-202. doi:10.1002/qj.49710142802
- O. Mamadou, S. Galle, J.-M. Cohard, B. Kounouhéwa, A. Diedhiou, T. Pellarin, R. Biron, S. Boubkraoui and C. N. Awanou “Annual and Seasonal Energy Budget Variations of a Fallow and a Clear Forest in Sudanian Climate,” 4th AMMA International Conference, Toulouse, 2-6 July 2012, p. 220.
- S. P. Arya, “Introduction to Micrometeorology,” 2nd Edition, Academic Press, Waltham, 2001.
- J. G. Charney, W. J. Quirk, S. H. Chow and J. Kornfield, “A Comparative Study of the Effects of Albedo Change on Drought in Semi-Arid Regions,” Journal of Atmospheric Science, Vol. 34, No. 9, 1977, pp. 1366-1385. doi:10.1175/1520-0469(1977)034<1366:ACSOTE>2.0.CO;2
- A. K. Betts, J. H. Ball and J. H. McCaughey, “Near-Surface Climate in the Boreal Forest,” Journal of Geophysical Research, Vol. 106, No. D24, 2001, pp. 529-541. doi:10.1029/2001JD900047
- A. Boone, B. Decharme, F. Guichard, P. de Rosnay, G. Balsamo, A. Beljaars, F. Chopin, et al., “The AMMA Land Surface Model Intercomparison Project (ALMIP),” Bulletin of the American Meteorological Society, Vol. 90, No. 12, 2009, pp. 1865-1880. doi:10.1175/2009BAMS2786.1
- T. Lebel, B. Cappelaere, N. Hanan, S. Levis, L. Descroix, S. Galle, L. Kergoat, E. Mougin, C. Peugeot, L. Seguis and B. Vieux, “AMMA-CATCH Studies in the Sahelian Region of West Africa: An Overview,” Journal of Hydrology (AMMA-CATCH Special Issue),Vol. 375, No. 1-2, 2009, pp. 3-13.
- M. Lelay and S. Galle, “How Changing Rainfall Regimes May Affect the Water Balance: A Modeling Approach in West Africa,” IAHS Press, Toronto, 2005.
- M. Judex, J. Rohring, O. Schulz and H.-P. Thamm, “Impetus Atlas du Bénin. Resultats de Recherche 2000-2007,” 3ème Edition, Département de Géographie, Université de Boon, Boon, 2009.
- I. Zin, S. Galle, C. Guérin, S. Mascle-Le Hégarat, C. Ottlé, J. Seghieri and M. Zribi, “Remote Sensing Data and Ground Measurements Merging for Land Cover/Land Use Monitoring and Hydrological Modelling in Benin,” 3rd International COPROMAPH3 (Contemporary Problems in Mathematical Physics) Conference, Cotonou, 2003.
- A. Guyot, J.-M. Cohard, S. Anquetin, S. Galle and C. R. Lloyd, “Combined Analysis of Energy and Water Balances to Estimate Latent Heat Flux of a Sudanian Small Catchment,” Journal of Hydrology, Vol. 375, No. 1-2 , 2009, pp. 227-240. doi:10.1016/j.jhydrol.2008.12.027
- R. Allen, L. S. Pereira, D. Raes and M. Smith, “Crop Evapotranspiration—Guidelines for Computing Crop Water Requirements—FAO Irrigation and Drainage Paper 56,” Food and Agriculture Organization of the United Nations, Rome, 1998.
- F. Timouk, L. Kergoat, E. Mougin, C. R. Lloyd, E. Ceschia, J.-M. Cohard, P. de Rosnay, P. Hiernaux, V. Demarez and C. M. Taylor, “Response of Surface Energy Balance to Water Regime and Vegetation Development in a Sahelian Landscape,” Journal of Hydrology, Vol. 375, No. 1-2, 2009, pp. 178-189. doi:10.1016/j.jhydrol.2009.04.022
- B. Monteny and G. Gosse, “Analyse et Estimation du Rayonnement net d’une Culture de Panicum Maximum en Zone Tropicale Humide,” Oecol Plant, Vol. 11, No. 2, 1976, pp. 173-191.
- D. Ramier, N. Boulain, B. Cappelaere, F. Timouk, M. Rabanit, C. R. Lloyd, S. Boubkraoui, F. Métayer, L. Descroix and V. Wawrzyniak, “Towards an Understanding of Coupled Physical and Biological Processes in the Cultivated Sahel-1. Energy and Water,” Journal of Hydrology, Vol. 375, No. 1-2, 2009, pp. 204-216. doi:10.1016/j.jhydrol.2008.12.002
- A. Guyot, “Estimation de l’Evapotranspiration sur un Couvert Complexe par Utilisation de la Scintillométrie Infrarouge. Application à un Bassin Versant de Zone Soudano-Sahélienne (Bénin),” Thèse de l’Université de Grenoble, Grenoble, 2010.
- B. A. Monteny, J. Humbert, J. P. Lhomme and J. M. Kalms, “Le Rayonnement net et l’Estimation de l’Evapotranspiration en Côte d’Ivoire,” Agricultural and Forest Meteorology, Vol. 23, No. 1, 1981, pp. 45-59. doi:10.1016/0002-1571(81)90090-X
- A. K. Betts, “Land-Surface-Atmosphere Coupling in Observations and Models,” Journal of Advances in Modeling Earth Systems, Vol. 1, No. 4, 2009, pp. 1-18.
- A. Calo, F. Giorgessi, L. Sansone, D. Tomasi and G. Zerbi, “Recherches sur le Rapport Entre le Flux de Sève, la Transpiration et la Vigueur dans la Vigne Selon le Mode de Conduite,” Vitis, Vol. 38, No. 1, 1999, pp. 7-13.
NOTES
*Corresponding author.