Food and Nutrition Sciences
Vol. 3 No. 10 (2012) , Article ID: 23396 , 8 pages DOI:10.4236/fns.2012.310189
Influence of the Degree of Maturation on the Bioactive Compounds in Blackberry (Rubus spp.) cv. Tupy
![]()
1Department of Agroindustrial Science and Technology, Federal University of Pelotas, Pelotas, Brazil; 2Departament of Chemical Engineering and Food Engineering, Federal University of Santa Catarina, Florianópolis, Brazil.
Email: *josianekr@gmail.com
Received August 20th, 2012; revised September 20th, 2012; accepted September 27th, 2012
Keywords: Blackberry; Phytochemicals; Maturation Degree; Antioxidant Activity; Anthocyanins; Phenolic Compounds
ABSTRACT
Fruit consumption is primarily due to the increasing awareness of consumers on the health benefits of a healthy diet. Thus some small fruits stand out because they have bioactive compounds that may have health benefits. Among these fruits is the blackberry, which contains different levels of bioactive compounds depending on the maturation stage. Therefore, the aim of this study was to evaluate the phytochemical and physicochemical compositions of blackberries (cv. Tupy) at three maturation stages. It was observed that during maturation, there was a decrease in acidity, carotenoids and tocopherols and an increase in the total soluble solids, pH, anthocyanins, antioxidant activity and total amount of phenolic compounds. Epicatequin was the major phenolic compound found in blackberries.
1. Introduction
Fruit consumption is primarily due to the increasing awareness of consumers on the health benefits of a healthy diet. Thus, people are seeking to diversify their diets by including more fresh foods, especially fruits with nutraceutical properties due to the presence of phytochemicals. These compounds have antioxidant properties and are able to scavenge free radicals that may induce some diseases, such as cancer. These compounds are present in higher concentrations in small fruits, such as blackberries, blueberries and strawberries, and this has caused a greater demand for fresh fruits. Among the fruits that have good markets, the blackberry is the most promising [1-3].
The blackberry plant belongs to the Rubus genus in the Rosaceae family, which, along with the Malus and Prunus families, is a primary source of plants for fruit cultivation in Brazil. This species can be easily comercialized and it grows in Rio Grande do Sul, which is the main producer of the country, but cultivation has also expanded to other regions with adequate climates, such as Santa Catarina, Parana, Sao Paulo and southern Minas Gerais [4].
Due to the interest in bioactive compounds, there is a need to identify and quantify the compounds present in these fruits. Some components, such as phenolic compounds, are present in a wide variety of fruits and vegetables; however, others are specific to a particular fruit or vegetable. There may also be variations in components or concentrations of a compound in the same plant, according to the variety, climatic conditions, soil type, geographic location and maturation stage [5,6].
Previous studies have reported that the maturation stage influences the levels of phenolic compounds and anthocyanins as well as the antioxidant activity of fruit. The aim of this study was to evaluate the phytochemical content of blackberries (cv. Tupy) and to determine the physicochemical changes in pH, acidity and soluble solids that occur during maturation.
2. Materials and Methods
2.1. Materials
Fresh blackberries (Rubus spp.) cv. Tupy from the 2008/ 2009 harvest were obtained from a property located in Morro Redondo, RS, Brazil. Three lots of fruit were harvested at each maturation stage from different plants. The fruit maturation stages were defined as follows: 4.5˚Brix (immature), 5.5˚Brix (intermediate) and 7.0˚Brix (mature). The fruits were placed in plastic bags, packed in polystyrene boxes containing ice and transported to the Laboratory of Chromatography at the Universidade Federal de Pelotas for analysis.
2.2. Determinations
2.2.1. Soluble Solids
Soluble solids were determined with an Abbe refractometer at 20˚C; the results are expressed in ˚Brix.
2.2.2. Titratable Acidity
Titratable acidity was determined by titration with NaOH; the results are expressed as % citric acid [7].
2.2.3. pH
pH was determined by the potentiometric method with a pH meter at room temperature.
2.2.4. Total Phenolic Compounds
The level of phenolic compounds was measured according to the method described by Badiale-Furlong et al. [8] with some modifications. Ten grams of each sample was homogenized and diluted in 25 mL of methanol. The sample was homogenized every five minutes for 1 hour at room temperature and was filtered through cotton, and the homogenate was transferred to a 50-mL volumetric flask; the volume was completed with methanol. 5 mL of 0.1 M barium hydroxide and 5 mL of 5% zinc sulfate were added to the aqueous extract. The solution rested for 20 minutes and then was centrifuged to clarify the extract. Quantification of the phenols was performed using 2 mL of the clarified extract, to which 4.5 mL of 2% sodium carbonate in 0.1 M NaOH was added. The sample remained in a water bath at 37˚C for 10 minutes, and 1 mL of Folin-Ciocalteau reagent (diluted 1:2, v/v, with ultrapure water) was then added. The absorbance of the solution was measured in a spectrophotometer (model Ultrospec 2000) at 765 nm, using methanol as a blank. The total phenolic content was determined using a standard curve of gallic acid, and the results are expressed in mg of gallic acid per 100 g of fresh fruit.
2.2.5. Individual Phenolic Compounds
Extraction of phenolic compounds from the pulp of the fruit was carried out according to the method described by Häkkinen, Karenlampi and Heinonen [9], with some modifications. Five grams of each crushed sample were dissolved in 30 mL of methanol, to which 4.9 mL of hydrochloric acid p.a. was added. The extract was homogenized in a water bath at 35˚C and left in the dark for 24 hours. After this period, the mixture was filtered, and the supernatant was concentrated in a rotary evaporator at 40˚C for 30 minutes. The concentrated residue was redissolved in methanol to a final volume of 5 mL and centrifuged at 7000 rpm for 10 minutes. An aliquot of the supernatant (30 μL) was injected into the chromatograph. The chromatograph consisted of a Shimadzu-HPLC system with an automatic injector, a UV-visible detector set at 280 nm, and an RP-18 CLC-ODS column (5 mm, 4.6 mm × 150 mm) with the stationary phase and an octadecyl guard column CLC-GODS (4) with the octadecyl stationary phase surface, both of which were pre-conditioned at 25˚C. The mobile phase consisted of an elution gradient of aqueous acetic acid (99:1, v/v) (A) and methanol (B) with a flow of 0.8 mL/min and a total running time of 45 minutes, according to the methodology described by Zambiazi [10]. The mobile phase consisted of 100% A for 25 minutes, 60% B and 40% A from 25 to 37 minutes, 95% A and 5% B from 37 to 42 minutes, and then the initial mobile phase (100% A) after 45 minutes. Individual phenolic compounds were identified and quantified based on the calibration curves of standards, including p-coumaric acid, caffeic acid, quercetin, ferulic acid, epicatechin, p-hydroxybenzoic acid, gallic acid, ellagic acid, catechin, myricetin and kaempferol. The results are expressed in mg of phenolic compound per 100 g of fresh fruit.
2.2.6. Total Anthocyanin Content
Determination of total anthocyanins was performed using the method described by Lees & Francis [11], with some modifications. One gram of each sample was added to a beaker covered with aluminum foil, to which 25 mL of ethanol acidified with hydrochloric acid (pH 1.00) was added. The sample was agitated every 5 minutes for one hour. After this period, the sample was filtered with cotton into a 50-mL volumetric flask, and the volume was completed with acidified methanol. The absorbance was measured in a spectrophotometer (model Ultrospec 2000) at 520 nm, using ethanol as a blank. Calculation of the concentration of anthocyanins was based on Beer’s Law, and the results are expressed as mg of cyaniding-3-glycoside per 100 g of fresh fruit.
2.2.7. Total Carotenoid Content
Determination of total carotenoids was performed by the method described by Rodriguez-Amaya [12], with modifications. Five grams of each sample and 2 g of celite were added to 20 mL of cold acetone, and the mixture was shaken for 10 minutes. The material was filtered with a Buchner funnel with filter paper, washing the sample with acetone until the extract was colorless. The filtrate was transferred to a separatory funnel, to which 30 mL of petroleum ether and 30 mL of distilled water were added. The lower phase was discarded, then distilled water was added; this procedure was repeated four times to achieve total removal of the acetone. The upper phase was transferred to a 50-mL volumetric flask, and the volume was completed with petroleum ether. The absorbance was measured in a spectrophotometer (model Ultrospec 2000) at 450 nm, using petroleum ether as a blank. The total carotenoid content was determined by Equation (1), and the results are expressed in μg of β-carotene per g of sample
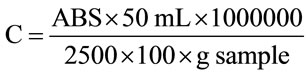 (1)
(1)
where C = carotenoid content of the sample and ABS = absorbance.
2.2.8. Individual Carotenoids
Twenty-five milliliters of each extract was used to determine the total amount of carotenoids. To each of these was added 25 ml of 1.5 N KOH in ethanol, and the samples were then subjected to cold saponification for 18 hours in the dark. After saponification, petroleum ether and water were added for phase separation; the upper phase was concentrated in a rotary evaporator at 35˚C and dissolved in the initial mobile phase (methanol: acetonitrile, 30:70 v/v). The diluted extract was transferred to an Eppendorf tube and centrifuged at 9000 rpm for 6 minutes. Aliquots of the supernatant (25 μL) were injected in a Shimadzu HPLC system with a UV-visible detector set at 450 nm. The separation was performed using a elution gradient of methanol, acetonitrile and ethyl acetate with a 1 mL/min flow rate. The mobile phase consisted of 30% methanol and 70% acetonitrile for 10 minutes, 10% methanol, 80% acetonitrile and 10% ethyl acetate from 10 to 35 minutes, 5% methanol, 80% acetonitrile and 15% ethyl acetate from 35 to 40 minutes, and then the initial mobile phase (30% methanol and 70% acetonitrile) from 40 to 45 minutes. For the identification and quantification of the compounds, a standard curve prepared with the chromatographic standards corresponding to β-carotene, β-cryptoxanthin, lutein, zeaxanthin and lycopene was used. The results are expressed in μg of compound per g of fresh fruit.
2.2.9. Tocopherols
For the analysis of tocopherols, aliquots from the samples used to determine the total carotenoid content were collected in Eppendorf vials. Each sample was centrifuged at 9000 rpm for 6 minutes, and then 20 μL of the supernatant was used for analysis. The analysis was performed by high-performance liquid chromatography in the same Shimadzu HPLC system used for the analysis of individual phenolic compounds. The HPLC was equipped with a fluorescence detector, using a wavelength of 290 nm for excitation and 330 nm for emission. The separation was performed using a gradient elution with methanol (A), acetonitrile (B) and isopropanol (C) as the mobile phase, following a method adapted from Zambiazi (1997). The mobile phase consisted of 40% A, 50% B and 10% C for 10 minutes, 65% A, 30% B and 5% C from 10 to 12 minutes, and then the initial mobile phase (40% A, 50% B and 10% C) from 12 to 15 minutes. For the identification and quantification of α-tocopherol, δ-tocopherol and γ-tocopherol, a standard curve prepared with the corresponding chromatographic standards was used. The quantification of β-tocopherol was based on the calibration curve of δ-tocopherol because these two compounds were not separated in the chromatographic process. The results are expressed in mg of compound per 100 g of fresh fruit, and the total content of tocopherols in the blackberries was determined by summing the individual tocopherols.
2.2.10. Antioxidant Activity
Antioxidant activity was determined according to the method described by Brand-Williams, Cuvelier and Bers [13] with some modifications. Five grams of each sample was diluted in 20 mL of methanol, homogenized and stored for 24 hours at 3˚C - 4˚C. The sample was then centrifuged for 15 minutes. Ten microliters of fruit extract was added to tubes coated with aluminum foil; 90 μL of methanol and 3.9 mL of DPPH solution were added to raise the total volume to 4.0 mL. The mixture remained in the dark for 30 minutes, and then its absorbance at 517 nm was determined in an Ultrospec 2000 UV-Visible spectrophotometer (Pharmacia Biotech). Antioxidative activity was determined by comparison with a standard curve of Trolox expressed by the equation y = 0.5085x. The results are expressed as Trolox equivalent antioxidant capacity (mmol of Trolox per 100 g).
2.2.11. Statistical Analysis
The obtained data are expressed as the means and standard deviations of triplicate determinations. The data were analyzed by analysis of variance (P < 0.05), and the means were analyzed with Tukey’s test. Statistical analyses were performed using STATISTICA 7.0.
3. Results and Discussion
3.1. Soluble Solids, Titratable Acidity and pH
A significant increase in soluble solids was observed during the course of maturation (Table 1). This increase occurs due to the biosynthesis of sugars following the hydrolysis of starch, a process in which a plant’s reserves of carbohydrates are transformed into simpler, watersoluble sugars [14].
The acidity of the fruit is due to the presence of organic acids, mainly malic acid. We observed a decrease in acidity probably caused by the oxidation of organic acids in the Krebs cycle during respiration, which was more pronounced in the initial maturation stages [15]. The acidity showed an inverse relationship with the results obtained for pH, which increased during maturation; this was more significant in the initial maturation stages due to the decrease in acidity. The relationship between the levels of soluble solids and titratable acidity is related to the balance between sugars and acids present in fruit and is an important indication of flavor [14]. In the present study, we observed an increase in this ratio, which occurred due to the higher level of soluble solids and lower titratable acidity. These results are given in Table 1.
These data are similar to those reported by AcostaMontoya et al. [16] for blackberries at different maturation stages in relation to increases in pH and the levels of soluble solids and in relation to the decrease in titratable acidity.
3.2. Total Phenolic Compounds and Total Anthocyanins
Significant amounts of phenolic compounds are routinely consumed in the human diet. These compounds contribute substantially to the protection of the body because of the antioxidative activity of these compounds. The spectrophotometric determination of total phenolic compounds and total anthocyanins estimates the level of all such compounds in a sample. The quantification of the phenolic compounds and anthocyanins in blackberries (cv. Tupy) at different maturation stages are given in Table 2.
We observed a significant increase in both total anthocyanins and total phenolic compounds with maturation. The levels of anthocyanins and phenolic compounds increased until the intermediate maturation stage, from which there was a slight decrease. This is evidence that higher metabolic activity leading to the synthesis of these pigments occurs in the initial maturation stages.
The higher levels of anthocyanins at the mature stage is due to the synthesis of these pigments that occurs during ripening, and they reach a maximum in fully ripe fruit [15]. Because these are phenolic compounds, and therefore, they are considered in the quantification of total phenols, this content also increases during maturation. However, the increases in phenolic compounds and anthocyanins do not occur at the same rate because the degradation of perlagonidina, cyanidin and delphinidin is necessary for the synthesis of anthocyanins during ripening [17].
By comparing our data with the results reported by Ferreira [18] for ripe blackberries (241.7 mg per 100 g of total phenols and 90.5 mg per 100 g of anthocyanin-1), it can be observed that Ferreira’s value is lower than that of the present study for phenolic compounds but very similar for anthocyanins.
By studying the phenolic compounds present in pitanga at two different maturation stages, mature and semi-mature. Lima, Melo and Lima [19] reported higher levels (mature: 257 mg per 100 g, semi-mature: 252 mg per 100 g) than those found for blackberries, but these compounds presented the same behavior observed in the present study, where only small variation occurs in this value during the final stages of fruit ripening.
3.3. Individual Phenolic Compounds
Gallic acid, hydroxybenzoic acid, catechin, caffeic acid, epicatechin, ferulic acid, ellagic acid and quercetin were separated and identified by high-performance liquid chromatography using a reverse-phase column (Figure 1).
From a calibration curve previously prepared with the respective standards, it was possible to quantify the phenolic compounds identified in the blackberries at different maturation stages (Table 3).
During the ripening of fruit, many phenolic compounds are synthesized, some of which can be polymerized; this
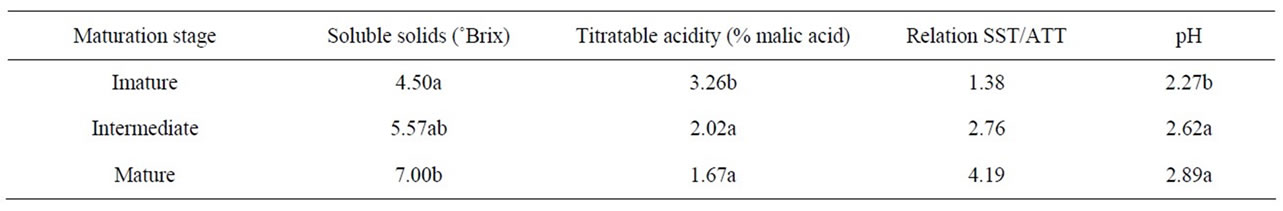
Table 1. Soluble solids, titratable acidity and pH of blackberries (cv. Tupy) at different maturation stages.
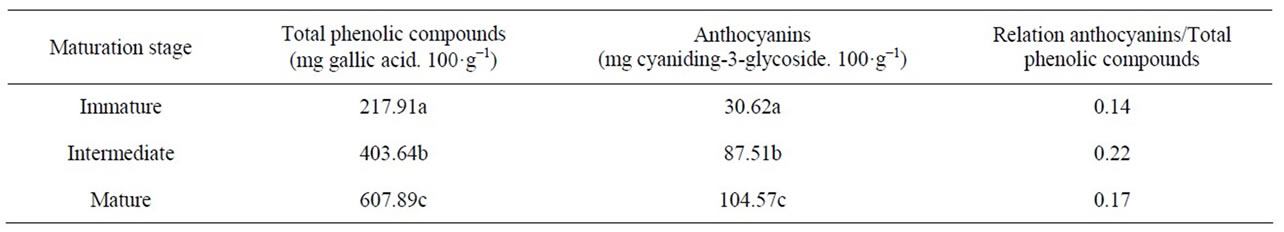
Table 2. Phenolic compounds and anthocyanins in blackberries (cv. Tupy) at different maturation stages.
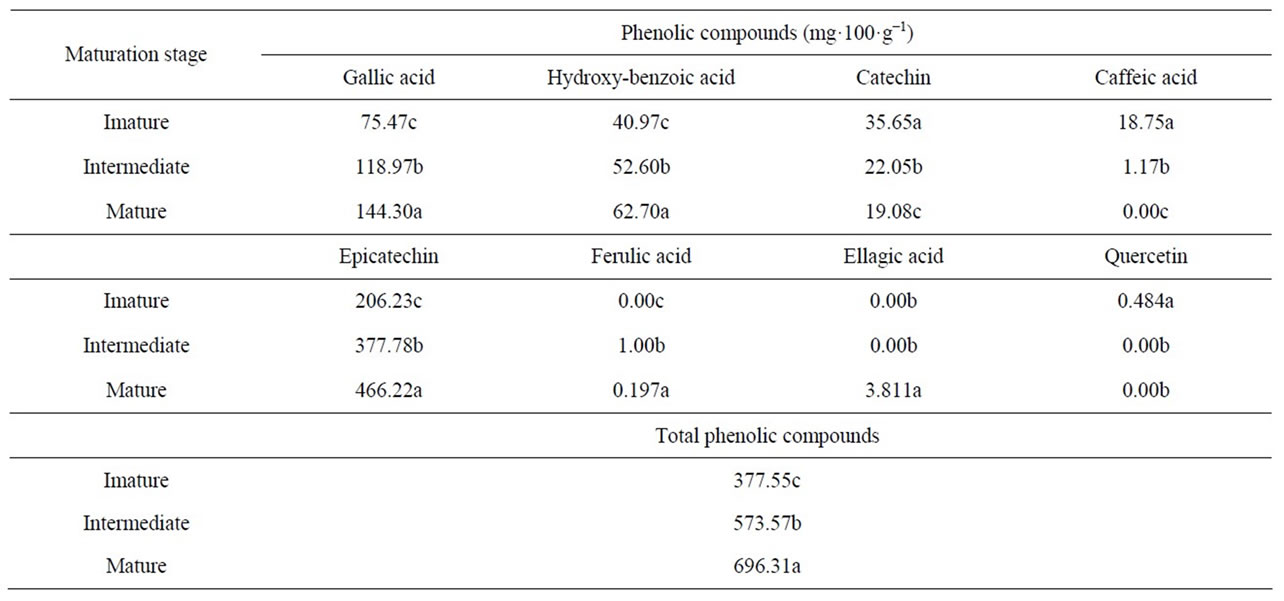
Table 3. Phenolic compounds present in blackberries (cv. Tupy) at different maturation stages.
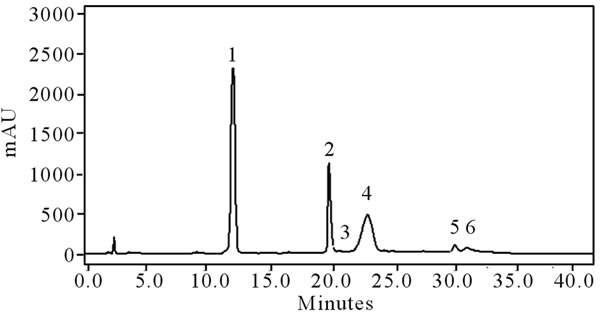
Figure 1. Typical chromatogram of the phenolic compounds in blackberries (cv. Tupy). HPLC with reverse-phase column and UV detector (280 nm). 1. gallic acid; 2. hydroxylbenzoic acid; 3. catechin; 4. epicatechin; 5. ellagic acid; 6. quercetin. Mobile phase: gradient of acetic acid in water (1:99 v/v) and methanol at a flow of 0.9 mL/min.
causes a decrease in the astringency of fruits [20]. In this study, the levels of gallic acid, hydroxybenzoic acid, epicatechin and ellagic acid increased with maturation, and the levels of catechin, caffeic acid and quercetin decreased.
These results are similar to those reported by Azevedo [21] for blackberries at different maturation stages; however, Azevedo reported the presence of p-coumaric acid, which was not identified in this study, and Azevedo did not report the presence of quercetin, which was identified in the present study.
Epicatechin was the predominant phenolic compound identified in the present study; this differs from the results reported by Jacques [22] who indicated that gallic acid was found in the highest quantities in blackberries. Azevedo [21] also reported epicatechin as the predominant phenolic compound (444.94 mg per 100 g) in fruit at the advanced maturation stage, a result similar to that obtained in the present study (466.22 mg per 100 g).
For the sum of all compounds, Azevedo [21] found 811.21 mg per 100 g of fruit for the advanced maturation stage. This result is higher than that found in the present study, which was 696.31 mg per 100 g. This level was in turn higher than that reported by Jacques (2009), which was 541.01 mg per 100 g.
These results indicate that fruits of the same cultivar from different locations and different harvest years have different chemical compositions. The differences may be due to specific climatic conditions, the type of soil in which the plants were cultivated and the stresses to which the plants were subjected because these phytochemicals are produced as a defense mechanism through a secondary metabolic process.
3.4. Carotenoids
The carotenoids lutein + zeaxanthin and β-carotene were both identified in the blackberry pulp. The carotenoids were separated with good resolution on an RP-C18 column. However, under the same chromatographic conditions, the lutein and the zeaxanthin were not separated and therefore were quantified together (lutein + zeaxanthin). A typical chromatogram of the carotenoids in blackberries at different maturation stages is given in Figure 2.
From a calibration curve previously prepared with the respective standards, it was possible to quantify the carotenoids identified in blackberries (Table 4). The total carotenoid content was determined by spectrophotometry, and the levels of the individual carotenoids were determined by HPLC.
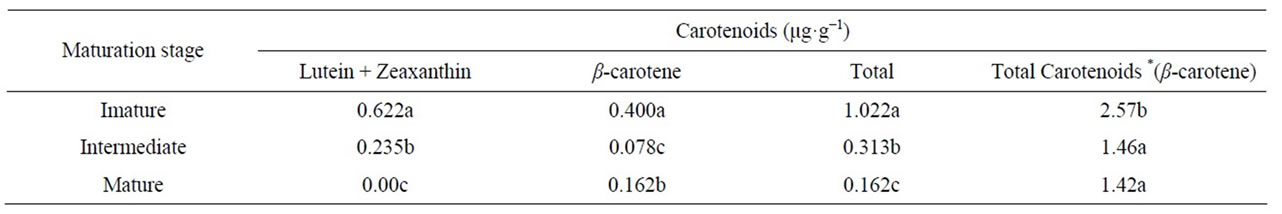
Table 4. Carotenoid content of blackberries (cv. Tupy) at different maturation stages.
There was a decrease of approximately 62.2% in the lutein + zeaxanthin content from the immature stage to the intermediate stage and a decrease of 100% from the intermediate stage to the final stage of ripening. The β-carotene content also declined with maturation, being more pronounced in the initial maturation stages. Due to a small increase from the intermediate stage to the mature stage, there was only a 40.5% decrease in the initial content by the time the fruit reached maturity. This occurs because while some carotenoids are synthesized 'during maturation, others biodegrade, resulting in the formation of volatile compounds [20].
Comparing the total carotenoids obtained with the sum of the individual carotenoids (expressed as β-carotene), spectrophotometry resulted in a higher estimate of total carotenoids than HPLC. This occurred because the identification of individual carotenoids by HPLC included only those peaks that had specific standards for identification.
The results obtained in this study are similar to those reported by Azevedo [21] who also reported a decrease in carotenoid content during the ripening of blackberries (cv. Tupy). However, the results obtained in this study were lower than those reported by Azevedo [21], which may be due to the difference in the harvest period or the specific microclimate.
Lima, Melo and Lima [19] compared the carotenoid content in purple pitanga and red pitanga at the semimature and mature stages. These authors reported that there was a 13.2% increase in the total carotenoid content of the purple pitanga and a 31.6% increase in the red pitanga during ripening. In the present study, we observed a decrease of approximately 55.3% in the total carotenoid content, which can be explained by the different metabolisms of the two fruits.
3.5. Tocopherol Content
Using an RP-C18 column, it was possible to identify both α-tocopherol and δ-tocopherol; however, the β-tocopherol was not separated from its isomer. γ-tocopherol (Figure 3), and thus, they were quantified together (β + γ-tocopherol).
The predominant tocopherol in blackberries was α- tocopherol, followed by δ-tocopherol and (β + γ) tocopherol (Table 5); this relationship held throughout the

Figure 2. Typical chromatogram of individual carotenoids in blackberries (cv. Tupy). HPLC with reverse-phase column and UV detector (450 nm). 1. Lutein + zeaxanthin; 2. β-carotene. Gradient of methanol:acetonitrile and ethyl acetate with a flow rate of 1.0 mL/min.
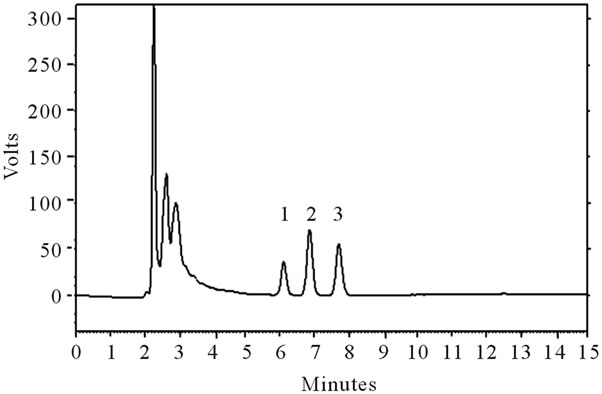
Figure 3. Typical chromatogram of the tocopherols in blackberries (cv. Tupy). HPLC with a reverse-phase column and fluorescence detector (290 nm excitation and 330 nm emission). 1. δ-tocopherol; 2. γ-tocopherol + β-tocopherol; 3. α-tocopherol. Gradient of acetonitrile:methanol: isopropanol. 50:40:10 v/v/v. with a flow rate of 1.0 mL/min.

Table 5. Tocopherol content in blackberries (cv. Tupy) at different maturation stages.
maturation period. The δ-tocopherol and (β + γ)-tocopherol showed similar behavior, declining 87.8% and 82.2%, respectively, from the immature stage to the intermediate stage, and remaining constant thereafter. However, the α-tocopherol decreased 83.7% from the immature stage to the intermediate stage, but from then, increased 2.5 times by the time of maturity. The same occurred with the total tocopherol content, because it was the major compound content, which showed a reduction of 84.6% in the initial stages and an increase of 1.8 times from the intermediate stage to maturity.
In a similar study conducted by Azevedo [21], the tocopherol found in the highest amount was the (β + γ)- tocopherol at the initial maturation stages and α-tocopherol at the more advanced maturation stages. In the present study, the α-tocopherol was the majority compound throughout maturation. However, Azevedo reported similar behavior in the total tocopherol content, which showed a reduction in the initial stages of maturation and subsequent elevation thereafter.
Barcia et al. [23] reported a total tocopherol content in blackberries (cv. Tupy) (0.825 mg per 100 g) slightly higher than that found in this study. However, when analyzing the tocopherols individually, they found 66% less α-tocopherol, 2.5 times more (β + γ)-tocopherol and 3 times more δ-tocopherol.
3.6. Antioxidant Activity
The main compounds associated with antioxidant capacity in vegetables are vitamin E (tocopherols), carotenoids and phenolic compounds, especially flavonoids. The phenolic compounds and tocopherols can donate a hydrogen or electrons to active radicals, forming stable intermediates that prevent oxidation [13]. Carotenoids have conjugated double bonds in their structure, which can capture the singlet oxygen [24].
In the present study, the antioxidant activity of the samples was directly related to the levels of phenolic compounds and anthocyanins, which increased significantly during maturation (Table 6); this was also observed by Azevedo [21].
However, there was no direct relationship between antioxidant activity and the levels of either carotenoids or tocopherols. The carotenoids and tocopherols decreased

Table 6. Antioxidant activity of blackberries (cv. Tupy) at different maturation stages.
with maturation, but antioxidant capacity increased with maturation.
4. Conclusion
The amount of soluble solids and pH increased with maturation stage. The levels of phenolic compounds and anthocyanins increased significantly with maturation, as did the antioxidant capacity, which was directly proportional to the levels of these compounds. The levels of anthocyanins and phenolic compounds increased until the intermediate stage. The carotenoid and tocopherol levels decreased with maturity degree.
REFERENCES
- R. L. Prior, G. H. Cão, A. Martin, E. Sofic, J. Mcewen, C. O’brien, N. Lischner, M. Ehlenfeldt, W. Kalt, G. Krewer and C. M. Mainland, “Antioxidant Capacity as Influenced by Total Phenolic and Anthocyanin Content. Maturity, and Variety of Vaccinium Species,” Journal of the Agricultural and Food Chemistry, Vol. 46, No. 9, 1998, pp. 2686-2693. doi:10.1021/jf980145d
- L. E. C. Antunes, M. Do and C. B. Raseira, “Technical Aspects of the Culture of Blackberry,” Embrapa Clima Temperado, Pelotas, 2004.
- A. D. R. Castrejón, I. Eichholz, S. Rohn, L. W. Kroh and S. Huyskens-Keil, “Phenolic Profile and Antioxidant Activity of Highbush Blueberry (Vaccinium corymbosum L.) during Fruit Maturation and Ripening,” Food Chemistry, Vol. 109, No. 3, 2008, pp. 564-572. doi:10.1016/j.foodchem.2008.01.007
- L. E. C. Antunes, “Blackberry Black: New Option from Growing in Brazil,” Ciência Rural, Vol. 32, No. 1, 2002, pp. 151-158. doi:10.1590/S0103-84782002000100026
- S. Sellappan, C. C. Akoh and G. Krewer, “Phenolic Compounds and Antioxidant Capacity of Georgia-Grown Blueberries and Blackberries,” Journal of Agricultural and Food Chemistry, Vol. 50, No. 8, 2002, pp. 2432-2438. doi:10.1021/jf011097r
- M. Naczk and F. Shahidi, “Extraction and Analysis of Phenolics in Food,” Journal of Chromatography A, Vol. 1054, No. 1-2, 2004, pp. 95-111.
- Instituto Adolfo Lutz, “Chemical and Physical Methods for Food Analysis,” Analytical Standards of the Instituto Adolfo Lutz, Vol. 1, São Paulo, 2008.
- E. Badiale-Furlong, E. Colla, D. S. Bortolato, A. L. M. Baisch and L. A. Souza-Soares, “Evaluation of the Potential of Phenolic Compounds in Plant Tissues,” Vetor, Vol. 13, No. 1, 2003, pp. 105-114.
- S. H. Häkkinen, S. O. Kärenlampi and M. Heinonen, “HPLC Method for Screening of Flavonoids and Phenolic Acids in Berries,” Journal Science Food Agricultural, Vol. 77, No. 4, 1998, pp. 543-551. doi:10.1002/(SICI)1097-0010(199808)77:4<543::AID-JSFA78>3.0.CO;2-I
- R. C. Zambiazi, “The Role of Endogenous Lipid Components on Vegetable Oil Stability,” Ph.D. Thesis, University of Manitoba, Winnipeg, 1997.
- D. H. Lees and F. J. Francis, “Standardization of Pigment Analysis in Cranberries,” Hortiscience, Vol. 7, No. 1, 1972, pp. 83-84.
- D. B. Rodriguez-Amaya, “A Guide to Carotenoid Analysis in Foods,” International Life Sciences Institute (ILSI) Press, Washington DC, 1999.
- W. Brand-Williams, M. E. Cuvelier and C. Berser, “Use of a Free Radical Method to Evaluate Antioxidant Activity,” Lebensmittel-Wissenschaft und-Technologie, Vol. 28, No. 1, 1995, pp. 25-30.
- R. A. Kluge, J. C. Nachtigal, J. C. Fachinello and A. B. Bilhalva, “Physiology and Postharvest Handling of Temperate Fruits,” 2nd Edition, Livraria e Editora Rural, Campinas, 2002.
- L. Taiz and E. Zeiger, “Plant Physiology,” 3rd Edition. Artmed, Porto Alegre, 2004.
- Ó. Acosta-Montoya, F. Vaillant, S. Cozzano, C. Mertz, A. M. Pérez and M. V. Castro, “Phenolic Content and Antioxidant Capacity of Tropical Highland Blackberry (Rubus adenotrichus Schltdl.) during Three Edible Maturity Stages,” Food Chemistry, Vol. 119, No. 1, 2010, pp. 1497- 1501. doi:10.1016/j.foodchem.2009.09.032
- KEGG, “Flavonoid Biosynthesis,” 2011. http://www.genome.jp/kegg/pathway/map/map00941.html
- D. S. Ferreira, “Bioactive Compounds in Blackberry and Encapsulation of Its Extract Anthocyanins by Thermal Gelation with Curdlan,” Ph.D. Thesis, Universidade Estadual de Campinas, Brasil, 2008.
- V. L. A. G. de Lima, E. de A. Melo, D. E. da S. Lima, “Phenolics and Carotenoids in Pitanga,” Scientia Agrícola, Vol. 59, No. 3, 2002, pp. 447-450.
- M. I. F. Chitarra and A. B. Chitarra, “Post-Harvest Fruits and Vegetables: Physiology and Handling,” 2nd Edition, MG. BR. Editora UFLA, Lavras, 2005.
- M. L. Azevedo, “Phytochemical Profile, Antioxidant and Antimicrobial Activities of Blackberry (Rubus fruticosus) cv. Tupy in Different Maturation Stages Grown in Temperate,” Ph.D. Thesis, Universidade Federal de Pelotas, Pelotas, 2011.
- A. C. Jacques. P. B. Pertuzatti, M. T. Barcia and R. C. Zambiazi, “Scientific Note: Bioactive Compounds in Small Fruits Grown in the Southern State of Rio Grande do Sul,” Brazilian Journal of Food Technology, Vol. 12, No. 2, 2009, pp. 123-127. doi:10.4260/BJFT20094608
- M. T. Barcia, A. C. Jacques, P. B. Pertuzatti and R. C. Zambiazi, “Determination of Ascorbic Acid and Tocopherols in Fruits by HPLC,” Semina: Ciências Agrárias, Vol. 31, No. 2, 2010, pp. 381-390.
- D. B. Rodriguez-Amaya, “Carotenoids and Food Preparation: The Retention of Provitamin: A Carotenoids in Prepared Processed and Stored Foods,” Usaid-Omni, Washington DC, 1997.
NOTES
*Corresponding author.