American Journal of Plant Sciences
Vol.3 No.3(2012), Article ID:17931,14 pages DOI:10.4236/ajps.2012.33049
Identification of Candidate Genes Related to Polyploidy and/or Apomixis in Eragrostis curvula
![]()
1Departamento de Agronomía, Universidad Nacional del Sur, Bahía Blanca, Argentina; 2Facultad de Ciencias Agrarias, Universidad Nacional de Rosario, Rosario, Argentina.
Email: echeniq@criba.edu.ar
Received December 1st, 2011; revised January 8th, 2012; accepted January 29th, 2012
Keywords: Differential display; Diplosporous apomixis; Eragrostis curvula; Gene expression; Ploidy
ABSTRACT
This work was aimed at identifying genes that show altered expression profiles in response to changes in ploidy and/or reproductive mode (from sexual to apomictic) in the African grass Eragrostis curvula. A differential display analysis was performed on leaf and flower transcriptomes from a series of genetically related euploid plants, including tetraploid apomictic, diploid sexual, and tetraploid sexual plants. More than 100 primer combinations were used to generate 11,864 total markers, yielding 1293 differential bands. Of these bands, 11.84% to 6.74% were related to ploidy and 0.71% to 2.17% to the reproductive mode, depending on the tissue. A small percentage of bands showed similar expressions between the tetraploid apomictic and the diploid sexual plants. Expression-based similarity dendrograms were constructed. Our data suggested that ploidy is more decisive than tissue type in defining the transcriptome structure. Out of 102 fragments sequenced, 50 showed strong homology to known genes. The differentially expressed genes were mapped in silico onto maize chromosomes. Several candidates mapped within the linkage group syntenic to the Tripsacum dactyloides diplospory-governing region. The evidence indicates that expression of genes located around the diplospory-associated region may be strongly influenced by ploidy and may be silenced in the apomictic genotype. These findings are discussed in the context of diplospory molecular control and its connection with ploidy.
1. Introduction
Apomixis is an asexual reproduction mode, which generates clonal seeds with embryos genetically identical to the mother plant [1]. This trait has been described in more than 400 species belonging to 40 angiosperm families [2]. Apomixis is frequently associated with polyploidy [3] and might have arisen through the de-regulation of the sexual developmental pathway by a mechanism that could comprise both genetic and epigenetic components [4]. Either the temporal or spatial regulation of sexual reproductive development is altered, resulting in heterochronic or ectopic expression of its core programs [5-9].
Eragrostis curvula has a basic chromosome number of x = 10 [10]. Most natural populations are polyploid, ranging from 4x to 7x [11]. Diploid cytotypes are inferquent [12]. While rare diploid cytotypes are sexual, polyploid ones are diplosporous apomicts [12]. The cultivars most valuable as forage grasses are the diplosporous tetraploids [11]. Initially, E. curvula was classified as having an Antennaria-type embryo sac [13], but later it was re-classified as it’s own type, the Eragrostis-typebecause it contains only four non-reduced nuclei at maturity instead of eight, as occurs in the Antennaria-type [14]. Embryos are formed by parthenogenesis, and fertilization of the polar nuclei (pseudogamy) is strictly required for endosperm development.
In grasses, diplosporous apomixis is genetically controlled by several independent loci, which separately govern apomeiosis (formation of a non-reduced megaspore), parthenogenesis, and endosperm development [7, 15-19]. In Erigeron annuus, apomeiosis and parthenogenesis are controlled by genes that map to independent linkage groups [15-17]. In Taraxacum officinale (dandelion), apomeiosis is controlled by a dominant allele at a single locus located on the satellite chromosome, while parthenogenesis and autonomous development of the endosperm are governed by different genes that segregate independently [18,19]. Strong suppression of recombination was observed at the apomeiosis-specific regions in Erigeron and Tripsacum [17,20], but not in Taraxacum [19]. It was reported that the non-recombinant region associated with apomeiosis in Tripsacum is syntenic to a portion of the maize 6 L chromosome [20,21]. Some of the genes located in this particular area are duplicated in other regions of the maize genome, particularly on chromosomes 3 and 8 [22].
Several lines of evidence suggest that apomixis may be epigenetically regulated. It has been shown that the apomixis-governing locus is a heterochromatic region enriched in retrotransposons and repetitive DNA [23-26]. A parent-of-origin effect of meiosis on expression of apomixis was reported [27]: in segregating populations, the apomixis locus was not inherited in a functional state (i.e., it could not induce apomixis) when transmitted through a reduced female gamete, but it remained functional when transmitted via male meiosis. More evidence for a possible epigenetic basis of apomixis came recently from the analysis of Arabidopsis thaliana plants with a defective ARGONAUTE9 (AGO9) gene [28]. AGO proteins cleave endogenous mRNAs during either microRNA (miRNA) or short interfering RNA (siRNA)- guided post-transcriptional silencing. AGO9 disruptions affect the specification of precursor cells of the gametes in the Arabidopsis ovule in a dominant manner, giving rise to a multiple-spore phenotype that resembles apospory [28]. The AGO9 protein is not expressed in the gamete lineage; instead, it is expressed in cytoplasmic foci of somatic companion cells. This suggests that small RNAs (sRNAs), which participate in silencing, must move out of somatic companion cells to control specification of gametic cells [28]. Interestingly, the siRNA fraction associated with AGO9 consisted mainly of 24- nucleotide sequences derived from retrotransposons. AGO9 is also responsible for silencing of transposons in the female germ line, as ago9 mutants show transposon reactivation in the egg. Moreover, the Zea mays mutant Dominant nonreduction 4 (Dnr4) produced a phenotype that mimics diplospory [29]. Dnr4 encodes the AGO104 protein, which accumulates in somatic tissues surrounding the female meiocytes, thus acting through a non-cellautonomous pattern similar to that observed for the related Arabidopsis gene, AGO9. AGO104 controls nonCG DNA methylation at centromeres and knob heterochromatin. Interestingly, the AGO104 locus maps to a region on maize chromosome 6 that is syntenic to the region containing the apomixis locus in Tripsacum [20]. In maize, inactivation of the DNA methyltransferases DMT102 and DMT103, which are expressed in the ovule, results in phenotypes that are strongly reminiscent of apomictic development, including the production of unreduced gametes and the formation of multiple embryo sacs [30].
For the last five years, our group has worked on the identification and characterization of transcripts involved in the reproductive pathways of E. curvula. We have also examined the molecular basis of the association between apomixis and polyploidy. For these purposes, we established a series of genetically related euploid plants with different ploidy levels and reproductive modes [31]. This series consists of a natural tetraploid apomictic plant (cv. Tanganyika, T), a diploid sexual plant (D) obtained from Tanganyika through in vitro culture, and two tetraploid highly sexual plants derived from the diploid after colchicine treatment (C and M). This series of plants is useful to identify genetic alterations and transcriptome repatterning that occurs immediately after a modification at the ploidy level, as well as for detecting genes associated with the expression of apomixis.
Previous analysis of this series showed that all tetraploid plants (sexual or apomictic) shared a similar genetic structure, which differed to that of the diploid (sexual) plant [32]. These results suggested that the genome response to ploidy variation was specific and conferred a genetic structure characteristic of a given ploidy level [32]. Changes in cytosine methylation were detected in plants of this series, with the diploid plant exhibiting a lower methylation level than that of the tetraploids [33]. To determine whether the genomic variation observed during polyploidization was associated with transcriptional re-patterning, a comparative expression analysis based on Expressed Sequence Tags (ESTs) was carried out [34,35]. The regulation of 112 genes was associated with the reproductive mode (apomictic vs. sexual) and/or the ploidy level [35]. However, we obtained only ~12,000 ESTs, which did not represent complete coverage of the transcriptome. Therefore, the 112 identified candidates probably corresponded only to genes expressed at relatively high levels in the tissues analyzed. To improve detection of differentially expressed genes, either further sequencing or a more sensitive method allowing detection of rare candidates should be used.
Differential display (DD) [36] is an alternative method for mRNA profile analysis that allows detection of candidates expressed at low levels [37]. In classical DD methods, the success of product amplification depends on the arbitrary primer matching to the corresponding cDNA. Even rare transcripts can be represented on a fingerprint as defined bands if arbitrary primers match their sequences perfectly [37]. Here, we present a detailed differential display analysis of the E. curvula leaf and flower transcriptomes, involving a total of 11,869 transcripts. This study complements the ESTs sequencing project data, allowing the characterization of 102 additional differentially expressed candidates. In silico mapping analysis of the candidates isolated here and in our previous EST sequencing research indicated that the transcription of the E. curvula genomic region syntenic to the Tripsacum dactyloides DIP locus is affected during ploidy conversions.
2. Materials and Methods
2.1. Plant Material
Plants used in this study were obtained as previously reported [31]. Briefly, flowers from the apomictic cv. Tanganyika (genotype T, 2n = 4x = 40) just emerging from the flag leaf were cultured on MS medium [38] supplemented with 2,4-diclorophenoxyacetic acid (2,4-D) and 6-benzylaminepurine (BAP). Out of 23 R0 plants, one had half of the normal chromosome number (genotype D, 2n = 2x = 20). After treatment of seeds of one diploid R1 plant with 0.05% colchicine and 2% DMSO, two highly sexual plants with 40 chromosomes (genotype C and M, 2n = 4x = 40) were rescued.
For the DD experiments, inflorescences just emerging from the flag leaf were collected at the same time of the day (9:00 AM), from plants growing in a greenhouse under identical conditions. Collection conditions were carefully standardized, taking into account the size and exomorphological aspect of the raceme, and by conducting microscopic observations of ovaries and anthers. A few central spikelets were fixed in formalin-acetic acidalcohol (ethanol 50% v/v, formaldehyde 10% v/v, acetic acid 5% v/v), dehydrated in an ethyl alcohol-tertiary butyl alcohol series, and then embedded in Paraplast Plus (McCormick Scientific, St Louis, MO, USA). Serial longitudinal sections (10 μm) were cut and stained with safranin-fast green [39] before microscopic observation. When spikelets at archesporal stages were detected, a short section of the inflorescence surrounding it was used for RNA extraction.
Young leaves (10 cm long) from fully developed plants were also collected for RNA extraction. Five leaves from different tillers from the same plant were pooled for analysis.
2.2. Differential Display Analysis
Total RNA was isolated from flowers and leaves using the SV Total RNA Isolation kit (Promega, Madison, WI, USA). Reverse transcription was performed using Superscript II reverse transcriptase (Invitrogen, Carlsbad, CA, USA). DD experiments were conducted largely as described by Liang and Pardee [34] with minor modifications. The anchored oligonucleotides, designated as DDT1, DDT2, DDT3, and DDT4, corresponded to the sequence 5’T(12) (ACg) X3’, where X was A, C, G or T, respectively. Decamers from the British Columbia University RAPD Primer Synthesis Project (sets 3 and 4) and the above-mentioned anchored oligonucleotides were used to create primer pair combinations. PCR reactions were prepared in duplicate in a final volume of 25 mL containing 1 ´ Taq activity buffer (Promega), 1.5 mM MgCl2, 50 mM dNTPs, 0.70 mM arbitrary primer, 2.5 mM anchored primer, 2 U Taq DNA polymerase enzyme (Promega) and 2.5 mL reverse transcription reaction mix (previously diluted 1/20). All samples (including controls) were processed in duplicate. Negative control reactions were performed as follows: 1) using total non reversetranscribed RNA as template, to verify the absence of chromosomal DNA in the RNA preparations; 2) using sterile distilled water instead of template, to discard contamination from the reagents. The cycle program consisted of an initial step of 3 min at 94˚C, 40 cycles of 20 s at 94˚C, 20 s at 38˚C, and 30 s at 72˚C, followed by a final step of 5 min at 72˚C. Samples were mixed with denaturing loading buffer, treated for 3 min at 95˚C and separated on a 5% (w/v) polyacrylamide gel. Amplification products were silver-stained following the DNA Silver Staining System procedure (Promega). Bands were scored only in the middle portion of the gel, where resolution was maximal and profiles were fully reproducible.
2.3. Dendrogram Construction
Bands were counted and data were converted into a binary matrix, in which 1 and 0 indicated band presence and absence, respectively, at a particular position. Failed amplification or equivocal results were coded as missing data. Matrices were analyzed to determine the similarity coefficients between pairs of individuals and to evaluate clusters. The Jaccard’s coefficient (J) was used [40]. Clustering analysis was performed using the unweighted pairgroup method with arithmetic averages (UPGMA) using the Infostat computational pack (http://www.infostat.com.ar, FCA-UNC, Argentina).
2.4. Isolation of Differential Fragments
Differentially expressed fragments were carefully excised from the gels with a sterile scalpel, and then eluted overnight in 0.5 M ammonium acetate/1 mM EDTA buffer (pH = 8.0). The DNA was precipitated in ethanol, and reamplified using the same PCR conditions described above. Fragments were cloned using the pGEM®-T Easy Vector system (Promega).
2.5. Sequence Data Analysis
Sequencing of the differential cDNA clones was performed by Ibiotec (INTA Castelar, Argentina). Sequence similarities were investigated by conducting BLAST searches at the National Center for Biotechnology Information webpage (http://www.ncbi.nlm.nih.gov/). The 2.2.20 BLASTN and BLASTX programs [41,42] were used to compare nucleotide sequences with those in the nucleotide collection (nr/nt) and non-redundant protein sequence (nr) databases, respectively.
2.6. Validation of Differential Expression
Differential expression of 15 selected candidates was validated by real-time PCR. Real-time PCR reactions were prepared in a final volume of 25 µL containing 500 nM specific primers, 1 ´ SYBR Green Master mix (PE Biosystems) and 100 ng reverse-transcribed RNA (prepared using Superscript II, Invitrogen, following the manufacturer’s instructions). Gene specific primers were designed using Primerquest from IDT Scitools (http://www.idtdna.com/). Primers were synthesized by IDT (Table 1). Actin was used as the control gene equally expressed in apomictic and sexual plants, to check for identical amplification between samples. Actin primers were designed based on the Eragrostis curvula EST sequence EC02_d_3393 (GeneBank: EH189701.1) that perfectly matches Zea mays actin1 (GeneBank: ACG- 39191.1, NCBI BASTX nr protein, score: 308, e-value: 1e−81, max identity: 98%). Amplification efficiency was controlled to be equivalent for samples and the corresponding internal control. RT (−) and non-template controls were included in these analyses. For the first ten candidates (Table 1), reactions were conducted in three technical replicates of bulked RNA isolated from three different plants. For the last five candidates, two biological and three technical replicates were used. The iCycler iQ™ Real-Time PCR Detection System (BioRad, CA, USA) was programmed as follows: 3 min at 95˚C, 45 cycles of 15 s at 95˚C, 30 s at 57˚C, 20 s at 72˚C and 10 s at 78˚C, next 5 min at 72˚C. Finally, a melting curve was constructed (86 cycles of 10 s from 65˚C to 90˚C, increasing the temperature by 0.3˚C after cycle 2).
Relative gene expression was assessed using the 2-ΛΛCT method [43]. Differences between mean values were evaluated by Student’s t-tests. P values of < 0.05 were considered significant. The cycle threshold (CT) indicates the fractional cycle at which the amplified target reaches its threshold. The CT was determined from the exponential phase of the PCR by iQ5 Real Time Detection System Software. The ΛCT value for a sample was calculated by subtracting the CT of each gene from that of the internal reference gene. The ΛΛCT of a gene was calculated by subtracting the ΛCT of each sample from the ΛCT of the control genotype (Tanganyika).
2.7. In Silico Mapping onto Maize Genome
The differentially expressed sequences identified in this work as well as those reported previously [35] were mapped in silico onto maize chromosomes. This analysis was performed using the tools provided at the Maize sequence webpage (http://maizesequence.org/). The posi-
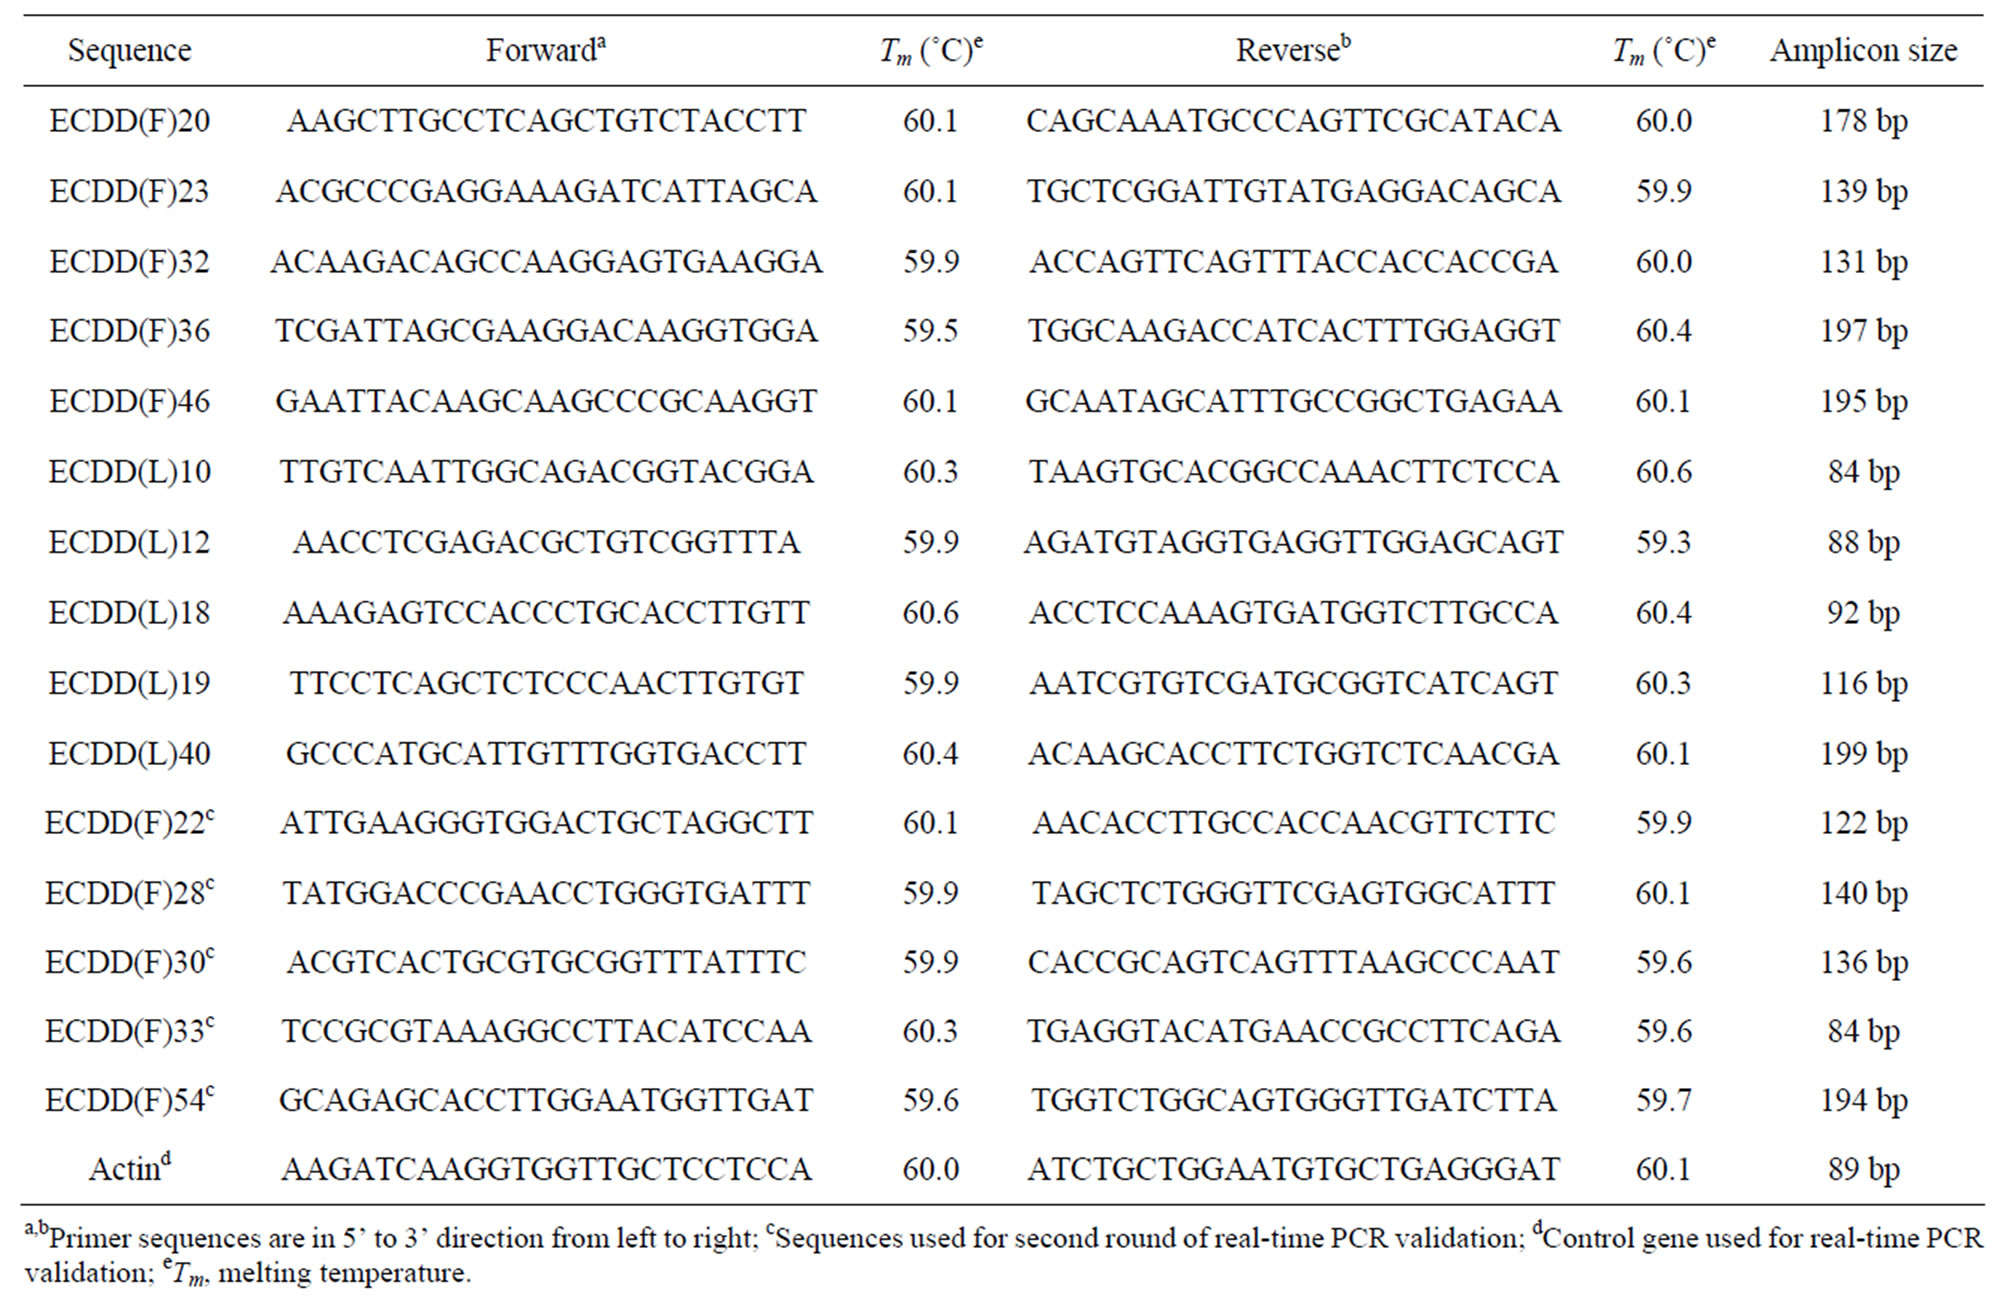
Table 1. Primer pair sequences used for real-time PCR validation of differentially expressed sequences.
tion of related sequences on the maize genome was determined after a BLASTN analysis with the BLAST tool on the Maize sequence webpage with a maximum Evalue for reported alignments of 0.001. The “allow some local mismatch” option was chosen. The sequence of the csu68 RFPL marker (GeneBank gi: 409635), associated with the Trypsacum apomeiosis locus [21], was used as a landmark to calculate the physical distances between the region associated with diplospory and the differential sequences obtained by our group.
3. Results and Discussion
3.1. Gene Expression in Flowers and Leaves
Figure 1(a) illustrates a typical inflorescence of E. curvula, showing spikelet detail. The development of the E. curvula panicle is typically heterochronic. Within a panicle, branches at the top usually display later stages of development with respect to branches at the base. In contrast, within a branch, spikelets at the top are less developed than those at the base. Basal flowers within a spikelet are more developed than flowers at the top of the spikelet. RNA samples were taken from spikelets at the archesporal stage (Figure 1(b)). This developmental stage is concurrent with the presence of pollen mother cells within the anthers (Figure 1(c)). Since we were interested in isolating candidate genes that trigger diplospory, we selected an early stage of development for molecular analysis.
In the inflorescence DD experiments, we used 116 primer combinations that yielded high-quality amplification products to generate a total of 4242 markers. For the experiments on leaves, 111 primer combinations were used and 7622 markers were amplified. Figure 2(a) shows a portion of a typical differential display gel.
Ploidy-related transcripts were readily identified because they produced a clear differential signal between 2x and 4x samples. Transcripts related to the reproductive mode were represented by bands that were present or absent in either sexual or apomictic lanes. Most of the isolated bands showed a presence-absence pattern. Some of the bands showing clear quantitative differences were cut, eluted, and amplified. Table 2 summarizes the number of changes detected. From the recorded bands, 11.84 and 6.74% were related to ploidy and 0.71 and 2.17% to the reproductive mode in flowers and leaves, respectively. Surprisingly, leaves showed a higher percentage of polymorphic bands between sexual and apomictic plants, compared with reproductive tissues. A small percentage of bands (0.5% and 0.78% in flowers and leaves, respectively) showed a pattern designated as “unexpected” because it was similar between the tetraploid apomictic and the diploid sexual plants. This particular type of expression pattern was present in both
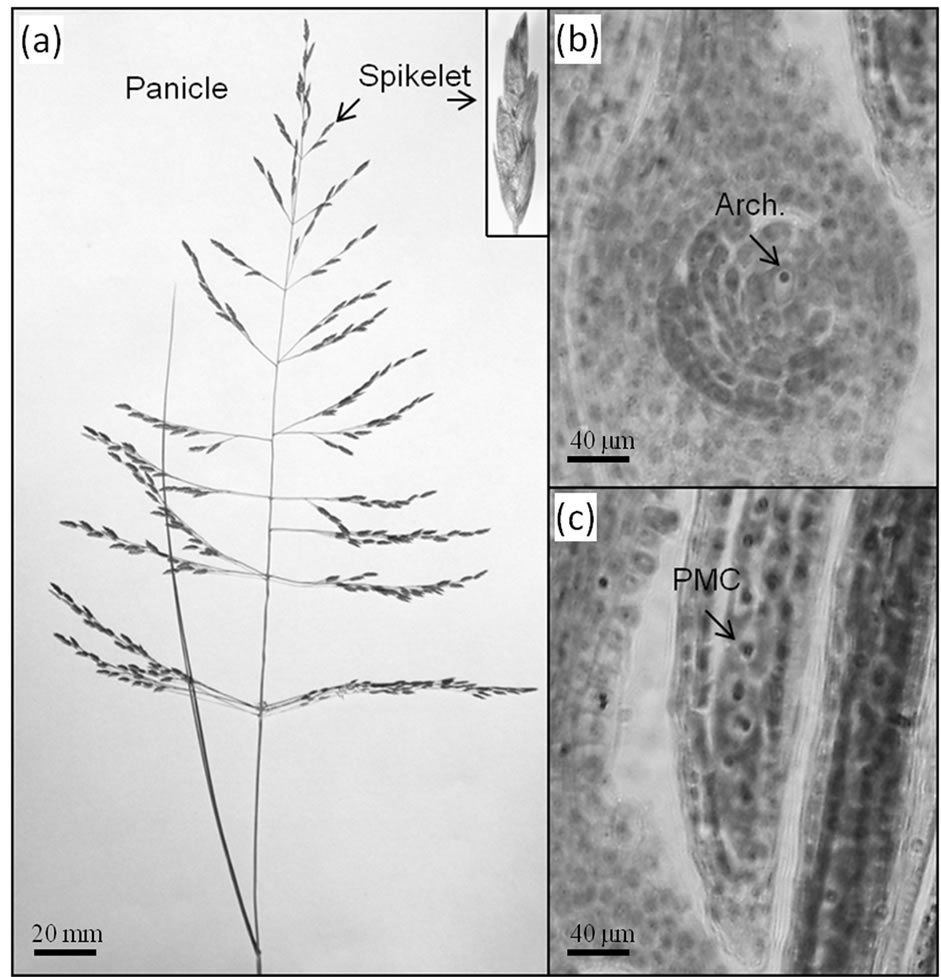
Figure 1. (a) Architecture of a typical inflorescence (panicle) of E. curvula showing spikelet detail; (b) Ovule and (c) anther developmental stages at which differential display studies were conducted. Bars at the bottom references the scale.
flowers and leaves, and had already been detected in a previous work [35]. The proportion of polymorphic bands associated with the reproductive mode in inflorescences was relatively low (0.71%). These results agree with previous reports on the aposporous apomictic grass P. notatum [44], where a similar percentage (1.2%) of differentially expressed genes associated with apospory in premeiotic inflorescences was detected using DD. Therefore, the number of genes displaying altered expression in flowers during apomictic development shows a similar order of magnitude for aposporous and diplosporous apomixis. On the other hand, while we detected 11.84% polymorphic bands related to ploidy in the present study, other authors [45] observed only 1.35% polymorphic bands in an analogous system of P. notatum, suggesting that the level of the transcriptome response to autopolyploidization might be species-specific, and that it is considerably higher in E. curvula.
Figure 2(b) shows a similarity dendrogram corresponding to expression data from flowers and leaves. The dendrogram clearly shows the difference between diploid and tetraploid expression patterns, suggesting that ploidy level is more decisive than tissue type in defining the transcriptome structure. These results are consistent with those obtained previously [35]. Moreover, in a previous work [32], revertant behavior of molecular markers (RAPDs and AFLPs) following changes in ploidy was observed, suggesting that the genetic structure of all tetraploid plants is similar and differs from that of the
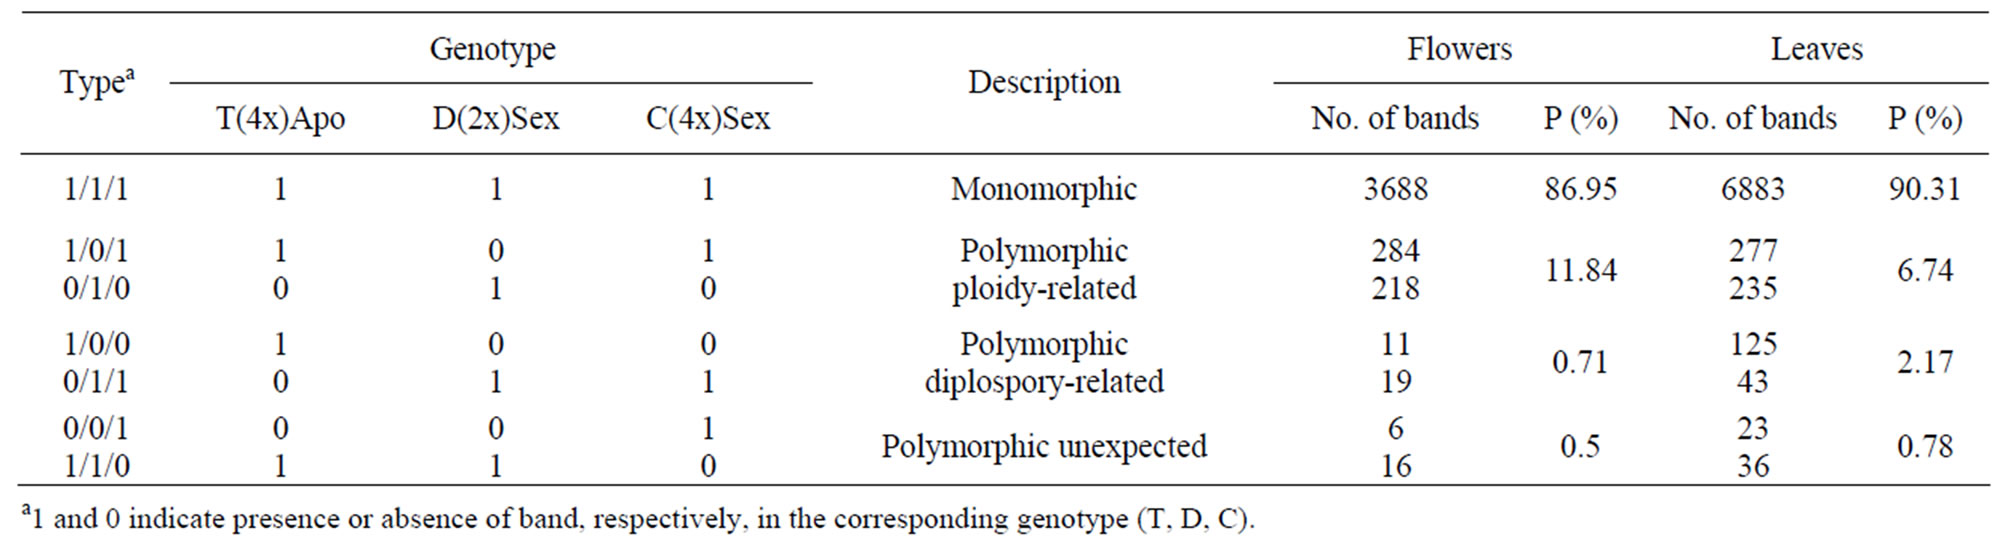
Table 2. Type and percentage of bands counted in Differential Display gels from flower and leaf samples from a series of E. curvula euploid plants.
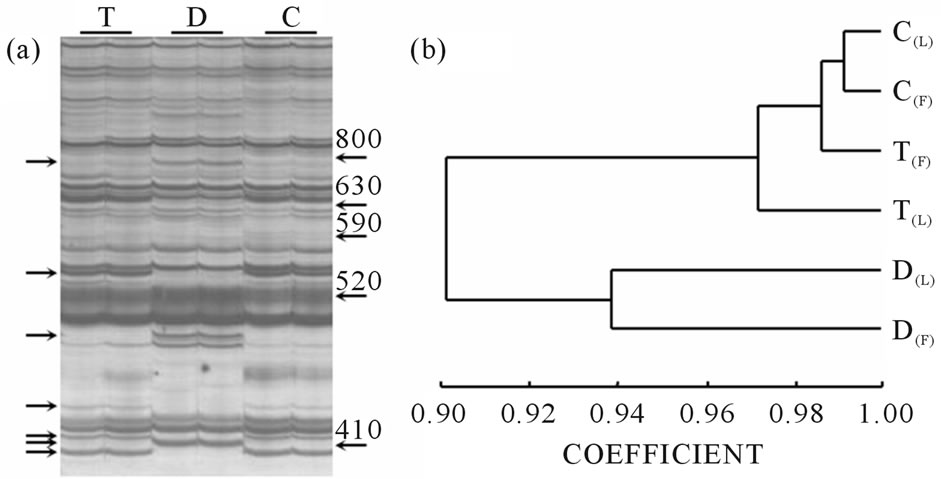
Figure 2. Expression profile comparisons. (a) Differential display gel representing a portion of the transcriptome from E. curvula flowers. Banding patterns correspond to plants T (4x apomictic), D (2x sexual), and C (4x sexual). Each sample was processed in duplicate. Each band set was generated from a single primer combination. Similarity between amplification profiles obtained from tetraploid plants T and C is clearly visible. Arrows at the left mark polymorphic bands. Arrows at the right mark weight in base pairs; (b) Dendrogram graphic corresponding to a combination of flower and leaf expression data of an E. curvula euploid series of plants with different ploidy levels and reproductive modes (T (4x apomictic), D (2x sexual) and C (4x sexual). F: flowers; L: leaves.
diploid sexual plant. Revertant changes in cytosine methylation were also observed in plants of this series [33].
In the particular case of the colchiploid genotype, an obvious and critical question is whether the use of colchicine and tissue culture techniques might have affected the genome structure, and therefore, are the origins of at least some of the polymorphisms observed. Reports in the literature indicate that tissue culture techniques/colchicine treatments used to generate autopolyploids do not cause changes in the genetic constitution of genotypes; however, epigenetic modifications and phenotypic variations can be detected. In an analysis of DNA sequence variation in plants generated from embryogenic callus of grapefruit stored in vitro by slow-growth culture methods, no RAPD polymorphisms were detected with 102 primers (provided that the ploidy level had remained constant) [46]. However, methylation-sensitive amplification polymorphism analyses showed DNA methylation changes in the stored samples compared with the controls [47]. Similar results were obtained in hop plants regenerated from sequential subcultures of organogenic calli [48]. In E. curvula, tissue culture followed by colchicine treatment did not generate genetic polymorphisms between genotypes, since colchiploids obtained from parallel polyploidization events showed an almost identical genetic structure [32]. However, consistent with the results reported for hop and citrus, the same genotypes showed differences in their general methylation patterns [33]. Moreover, in wheat, several synthetic allopolyploids exhibited the same pattern of sequence modifications, whether they had been generated by tissue culture or colchicine treatment [49]. Taken together, these results suggest that genetic modifications are probably induced by polyploidization itself and appear to involve diverse mechanisms in different taxa with various rates of polymorphisms. Genetic modifications could be related to a general phenomenon of stabilization of the new polyploids.
In a previous work using the same plant series, we observed that expression patterns of tetraploid plants were closely related, while global gene activity in the diploid genotype was significantly different [35]. This expression behavior correlated very well with the genetic and epigenetic structure of the series in classical and partial Mantel tests [32,33]. However, a particular group of genes showed a curious behavior, in that they were mostly silenced in both the 2x sexual and the 4x apomictic plants. Genes showing this expression pattern were also detected here. Since 2x sexual and 4x apomictic plants differ in both ploidy level and reproductive mode, the expression pattern of these genes is intriguing. Most of these “unexpected” candidates were over-expressed in the 4x sexual plant but repressed in the 4x apomictic and the 2x sexual genotypes. To explain the existence of this particular candidate group, we hypothesize that maintaining sexuality at the 4x level would require the specific activation of a group of genes during the 2x to 4x conversion, and that this activation would be blocked in the 4x apomictic plant [35].
3.2. Molecular Characterization of Isolated cDNAs
Gel sectors including polymorphic bands were cut, eluted, and re-amplified. We cloned and sequenced 60 bands from flowers and 42 from leaves, corresponding to 10.83% and 5.68% of the total differential bands from flowers and leaves, respectively (554 and 739 bands).
Of the 60 sequences characterized from flowers, 36 (60%) showed similarity to genes of known function. Only sequences with significant similarity to known genes are shown in Table 3. The remaining 24 clones (40%) represented novel sequences. Sequences were compared against those in databases using the BLASTX algorithm. Sequencing of 42 clones from leaves showed 14 (33.33%) that were homologous to genes of known function (Table 3) and 28 (66.66%) that represented unknown sequences. Only one gene (corresponding to polyubiquitin) was differentially expressed in both tissues (flowers and leaves) of the tetraploid plants compared with the diploid plant (ECDD(F)36 from flowers and ECDD(L)18 from leaves). However, it is worth pointing out that only a limited number of transcripts were sequenced. A more detailed examination could reveal other genes that are differentially expressed in both tissues.
BLAST analyses of the differentially expressed genes from panicles and leaves against the 12,295 ESTs of Eragrostis curvula annotated at Gene Bank (EH183417 to EH195711) revealed that out of the 60 sequences obtained from panicles, 15 matched with 222 ESTs (Evalue ≤ 1 × 10⁻⁵). Four of them (two hypothetical proteins, one adenosine kinase, and one putative calciumtransporting ATPase) showed expression patterns that corresponded exactly between the ESTs and DD experiments. Of the 40 sequences obtained from leaves, 6 matched with 37 ESTs when using the same parameters used for panicle sequences. The expression pattern of one of these genes (a putative serine carboxypeptidase II) coincided exactly between both experiments. We had anticipated that there would be more genes showing exactly the same expression pattern in both experiments.
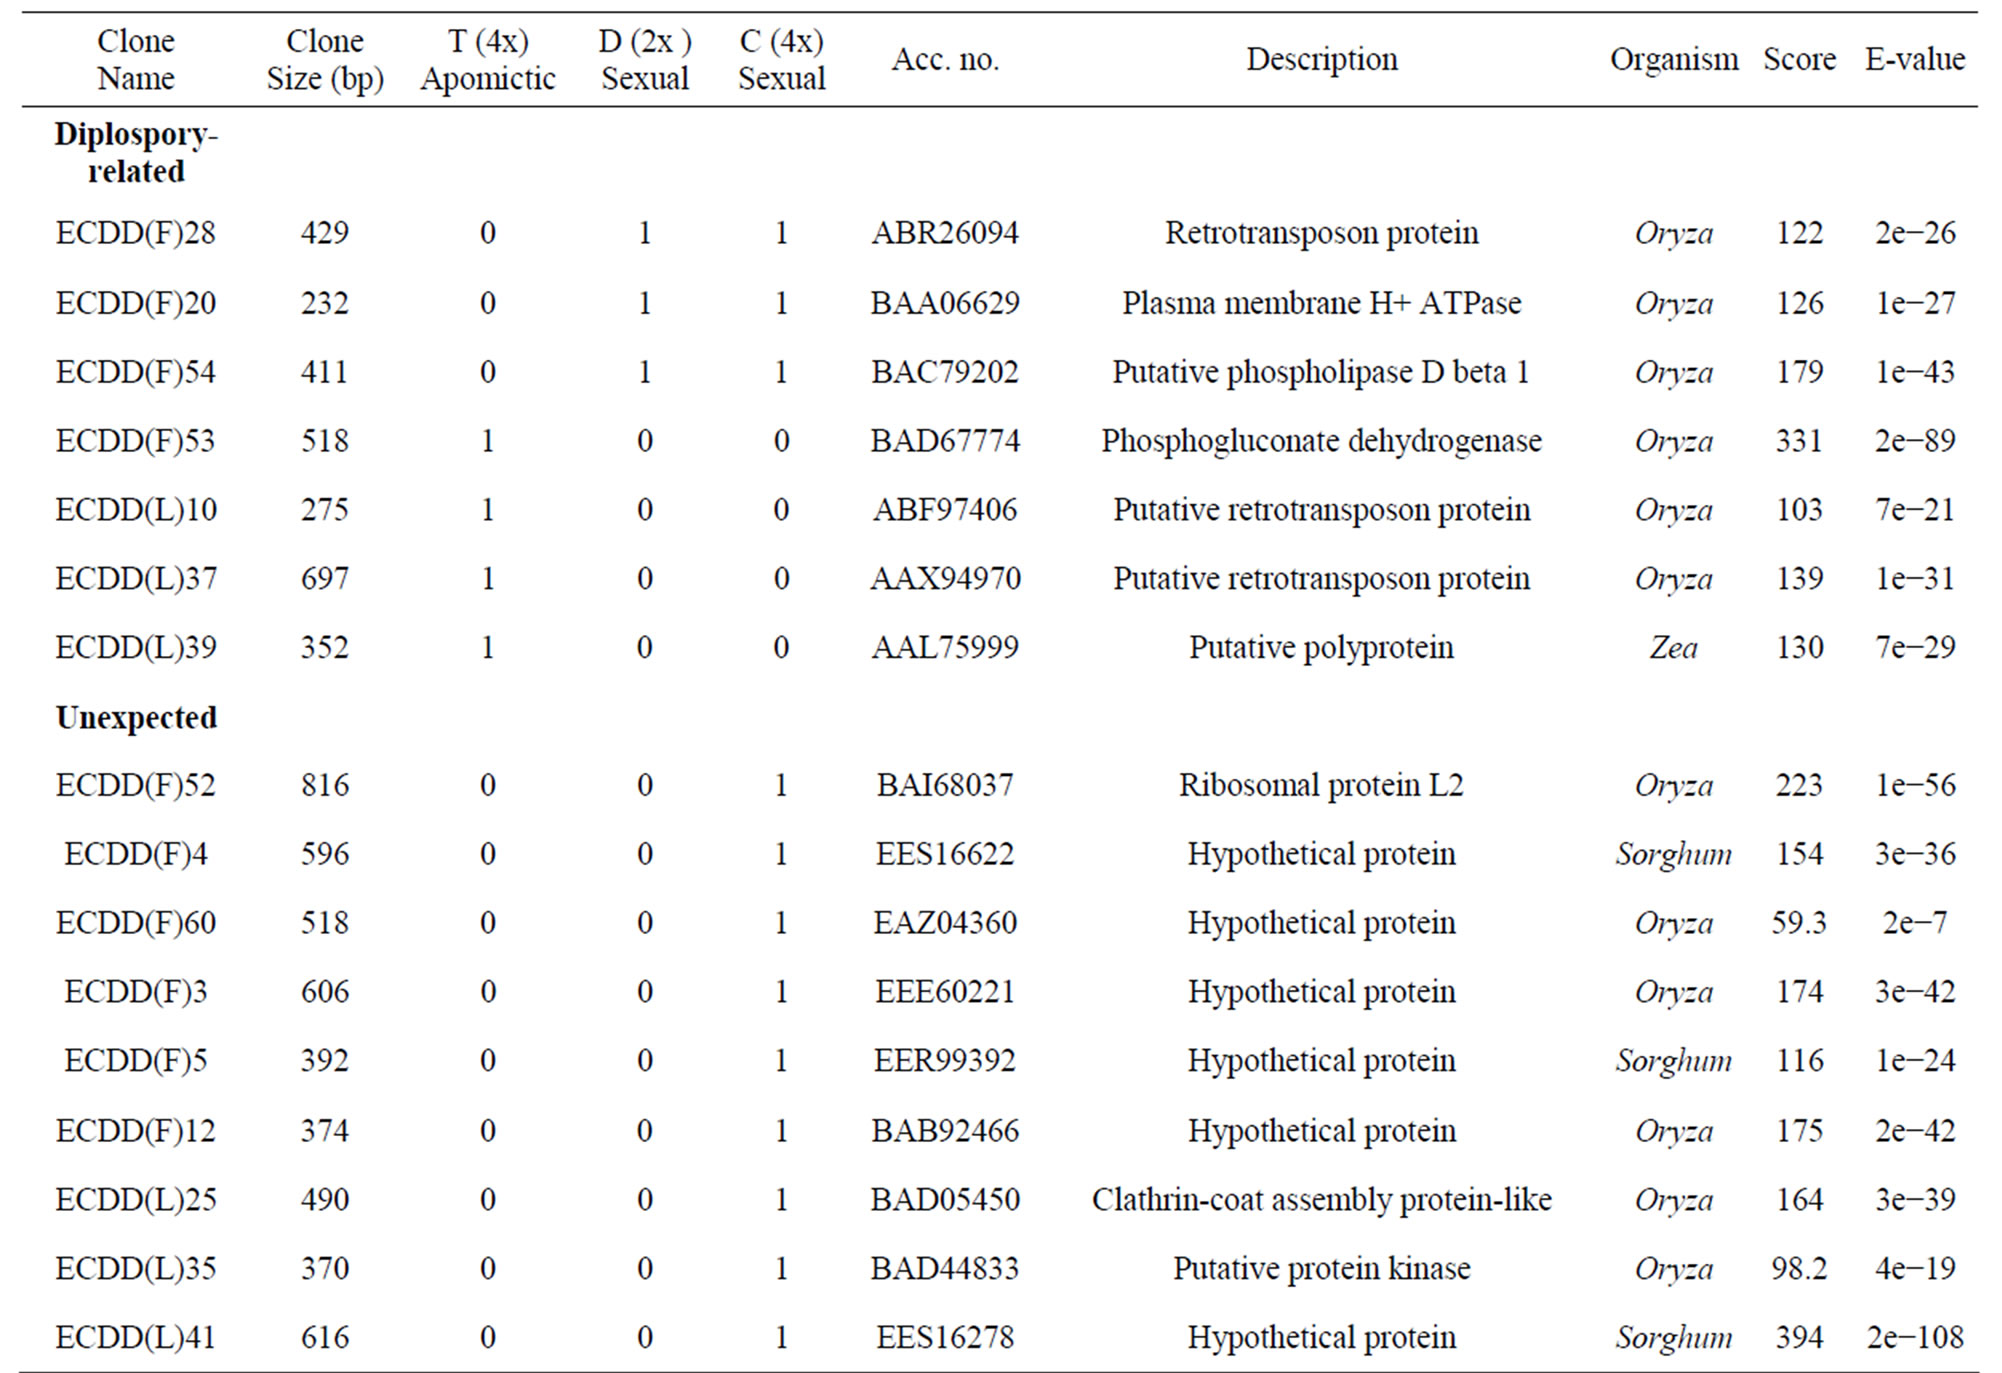
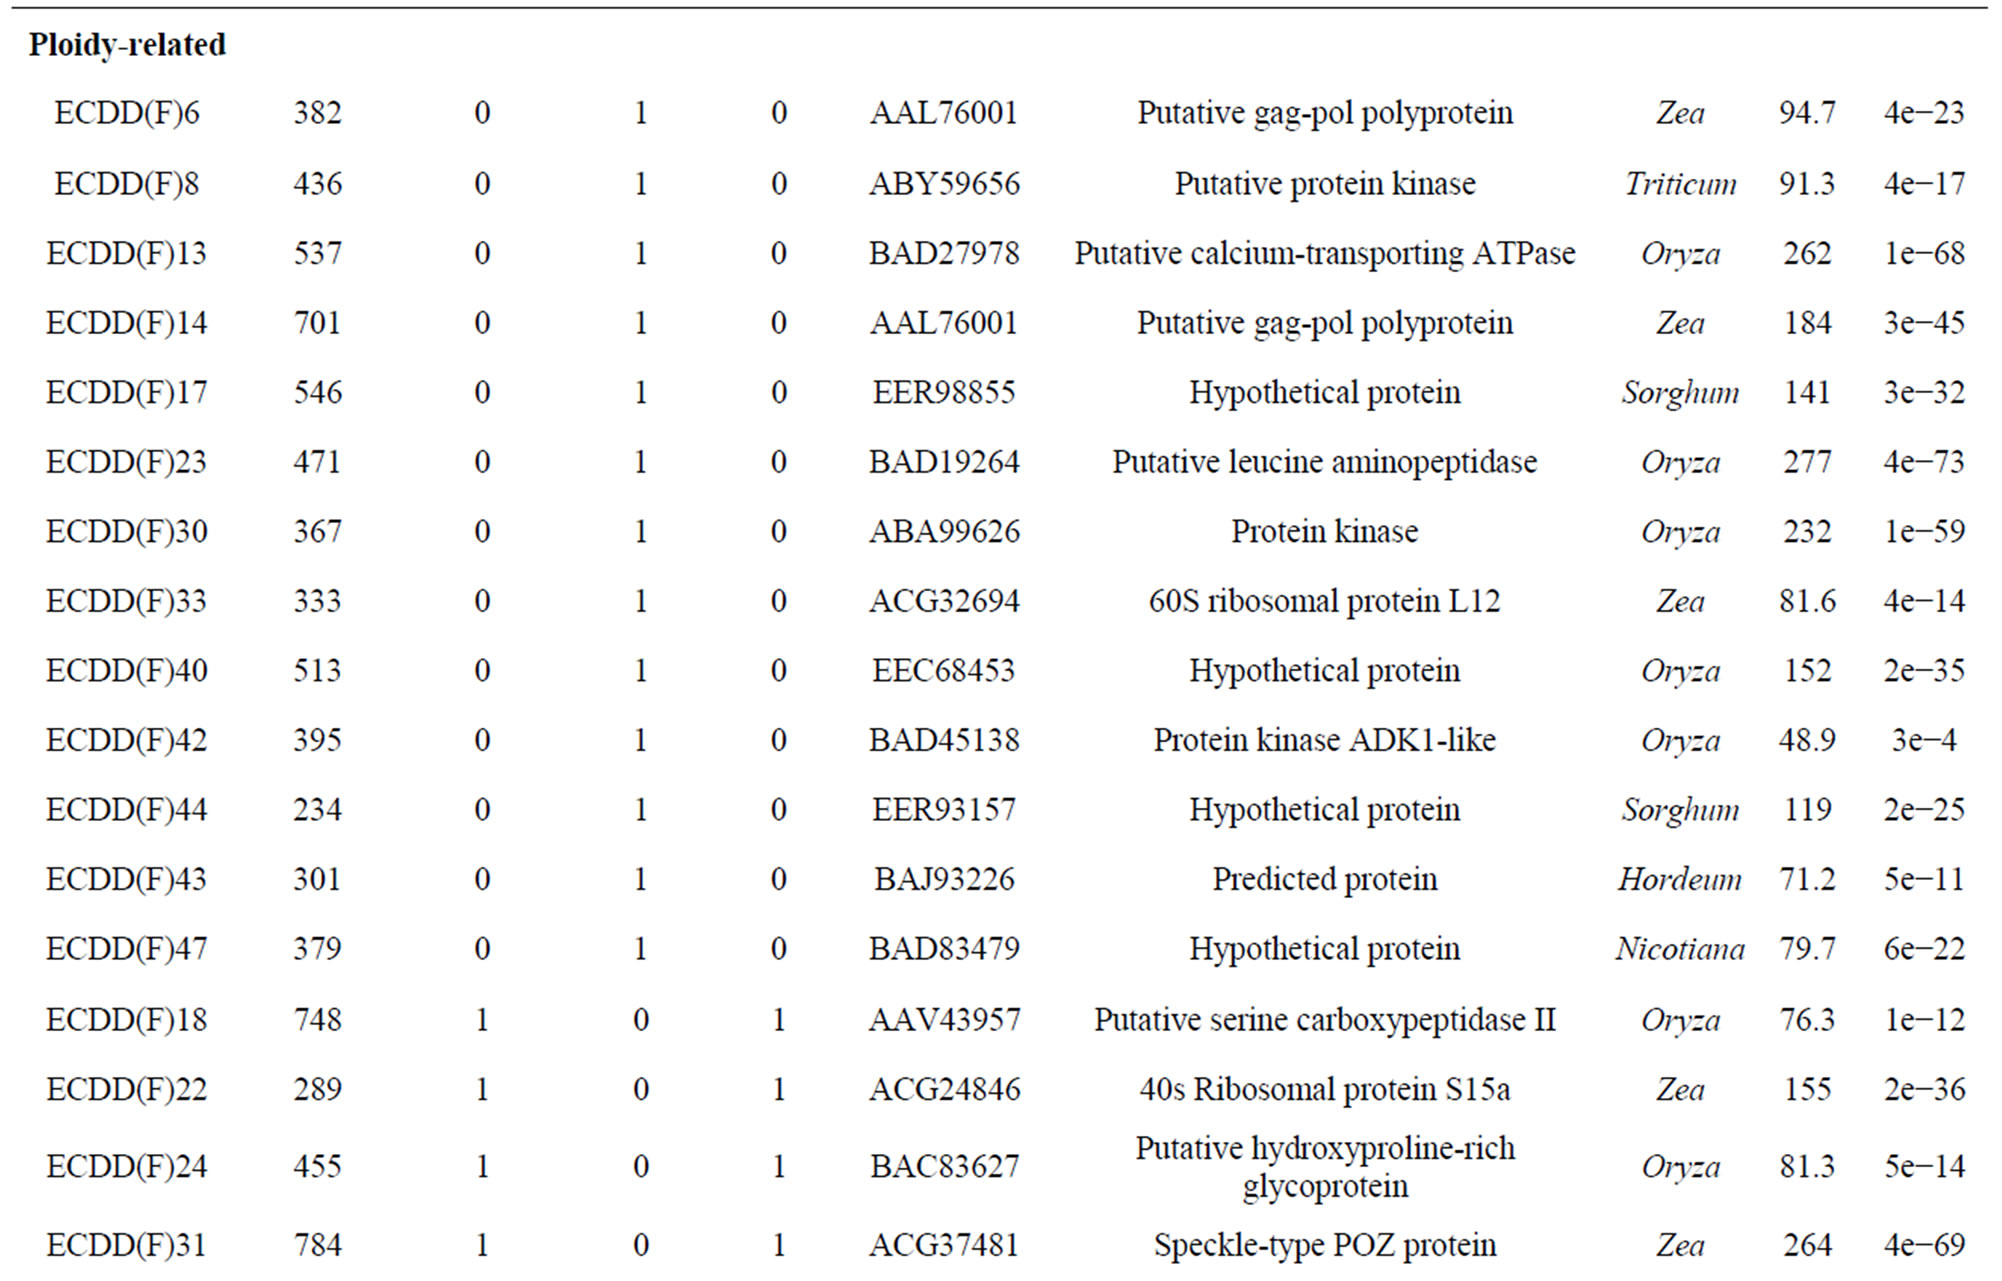
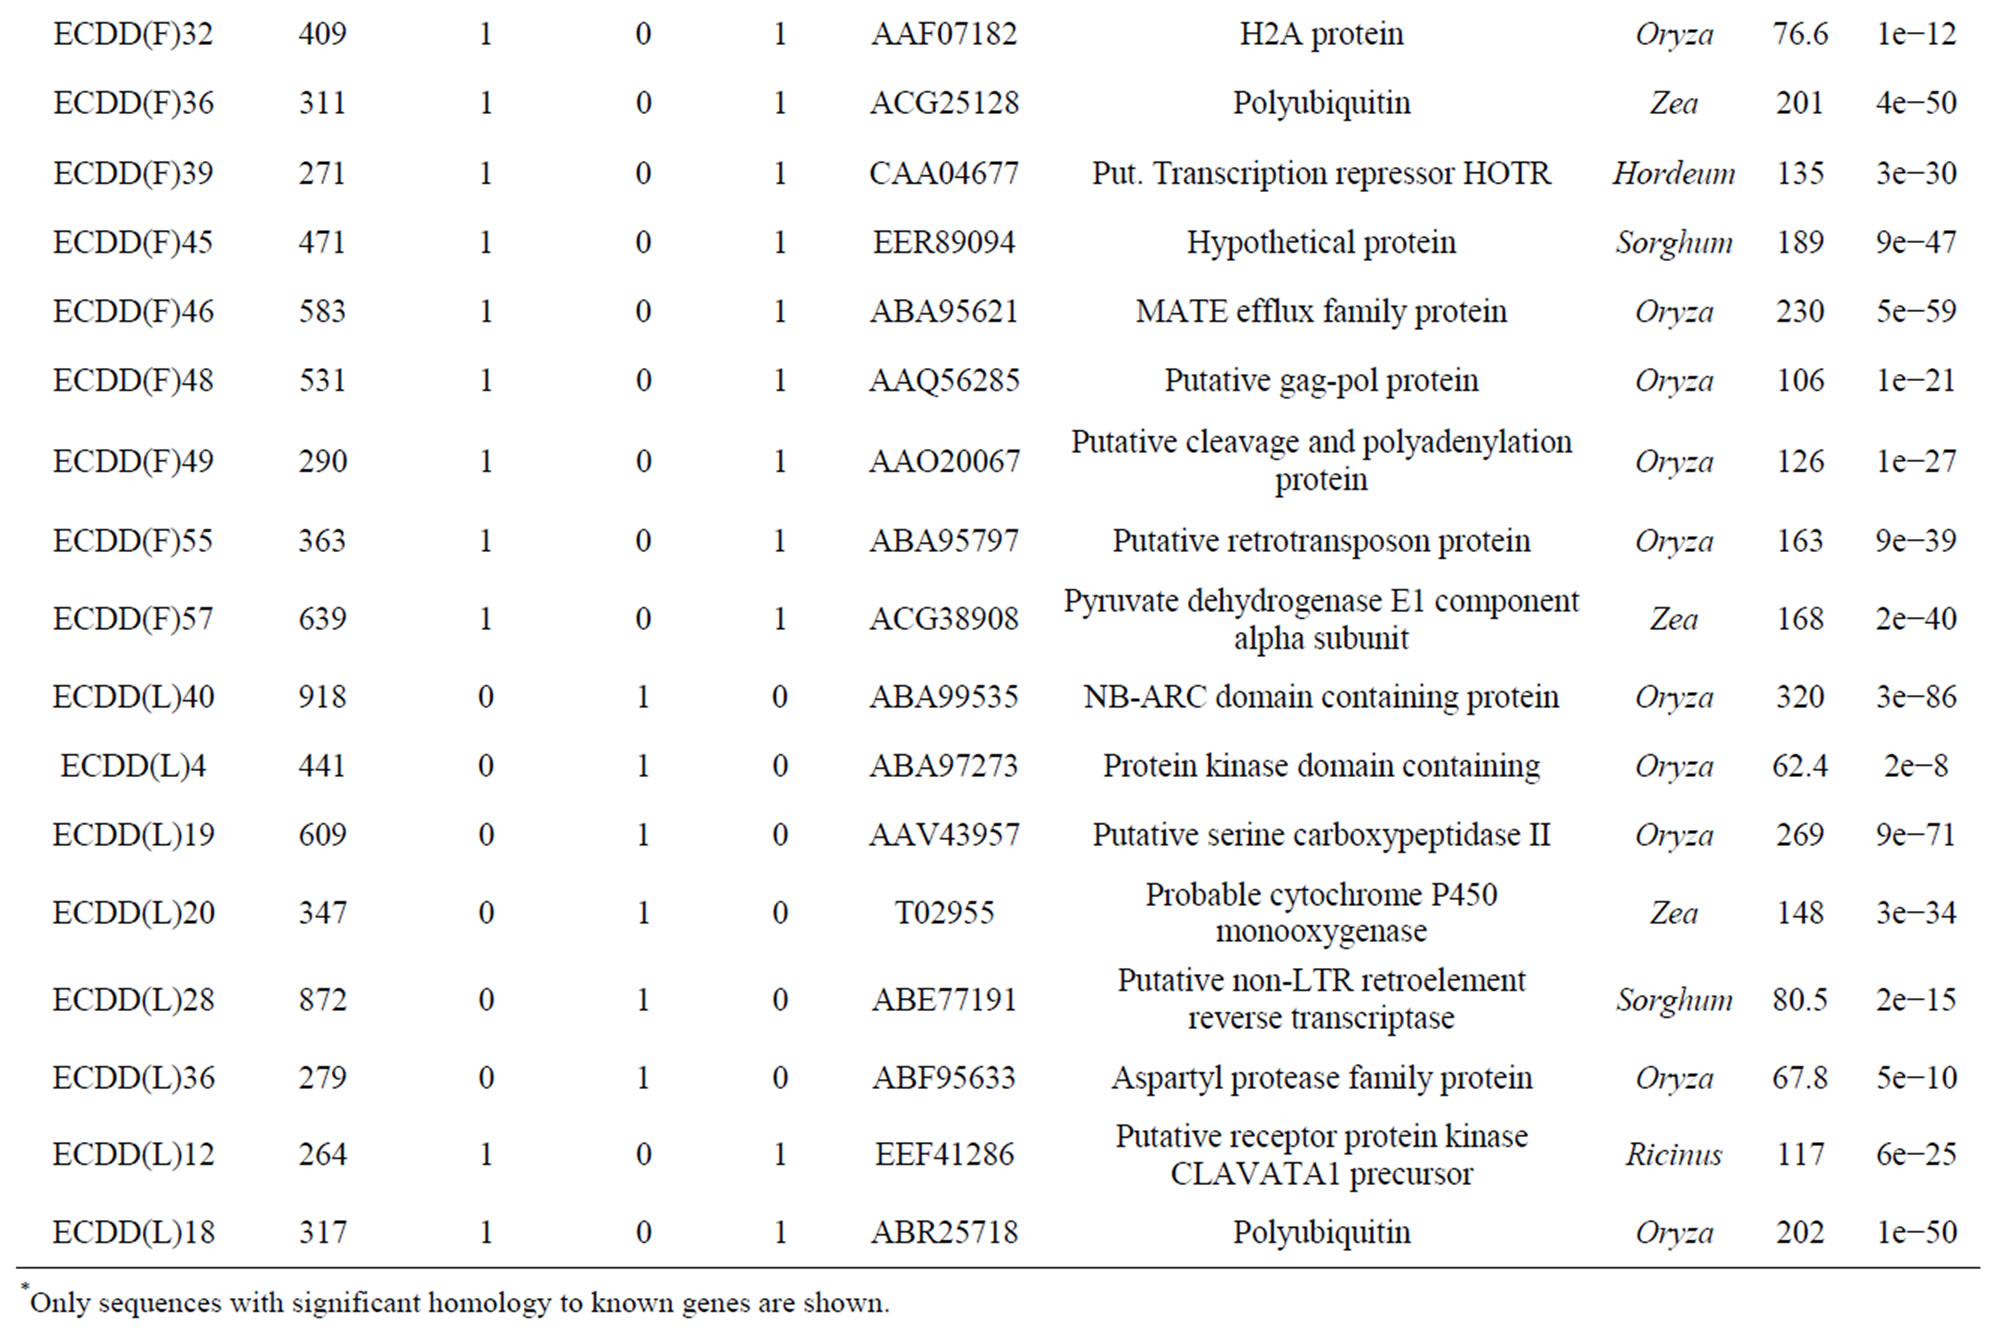
Table 3. Differentially expressed genes* in flowers (F) and leaves (L) of a euploid series of E. curvula plants with different reproductive modes and ploidy levels.
However, several factors can lead to differential representation of sequences in data sets obtained using both techniques, such us incomplete coverage, differential targeting (ESTs sequencing preferentially detects abundant transcripts, while DD equally detects both common and rare transcripts), sense-antisense sensitivity (only DD reveals sense-antisense differential expression), among others.
3.3. Validation of Gene Expression by Real-Time PCR
Real-time PCR reactions were carried out using material from plants with different ploidy levels and/or reproductive modes (T, D, and C) to amplify 15 randomly chosen genes and one internal control gene (actin). Of the 15 genes, 13 were successfully validated (Figure 3), confirming the results shown in Table 2. Two genes could not be validated, indicating that a low percentage of false positives could be expected. However, sense-antisense differential expression should be confirmed via in situ hybridization analysis before these candidates are classified as false positives, because amplicons obtained by real-time PCR can originate from sense or antisense strands, whereas DD allows differential detection of sense and antisense strands.
3.4. In Silico Mapping of Differentially Expressed Genes onto Maize Genome
The The differentially expressed genes (as determined from DD analysis and EST sequencing data) were positioned onto the corresponding maize physical map by in silico comparison of orthologous sequences. A total of 46 genes (35 from flowers and 11 from leaves) were successfully mapped in silico onto the ten chromosomes of maize. The genes were scattered among the chromosomes, indicating that genes encoding differentially expressed transcripts are evenly distributed throughout the whole maize genome. We were interested in detecting sequences located close to the chromosomal regions syntenic to the diplospory-governing locus, which is wellcharacterized in maize. Since the maize relative Tripsacum dactyloides is a diplosporous apomictic plant, maizeTripsacum hybrids have been used to detect genetic determinants for apomixis [21,50]. Apomixis in Tripsacum
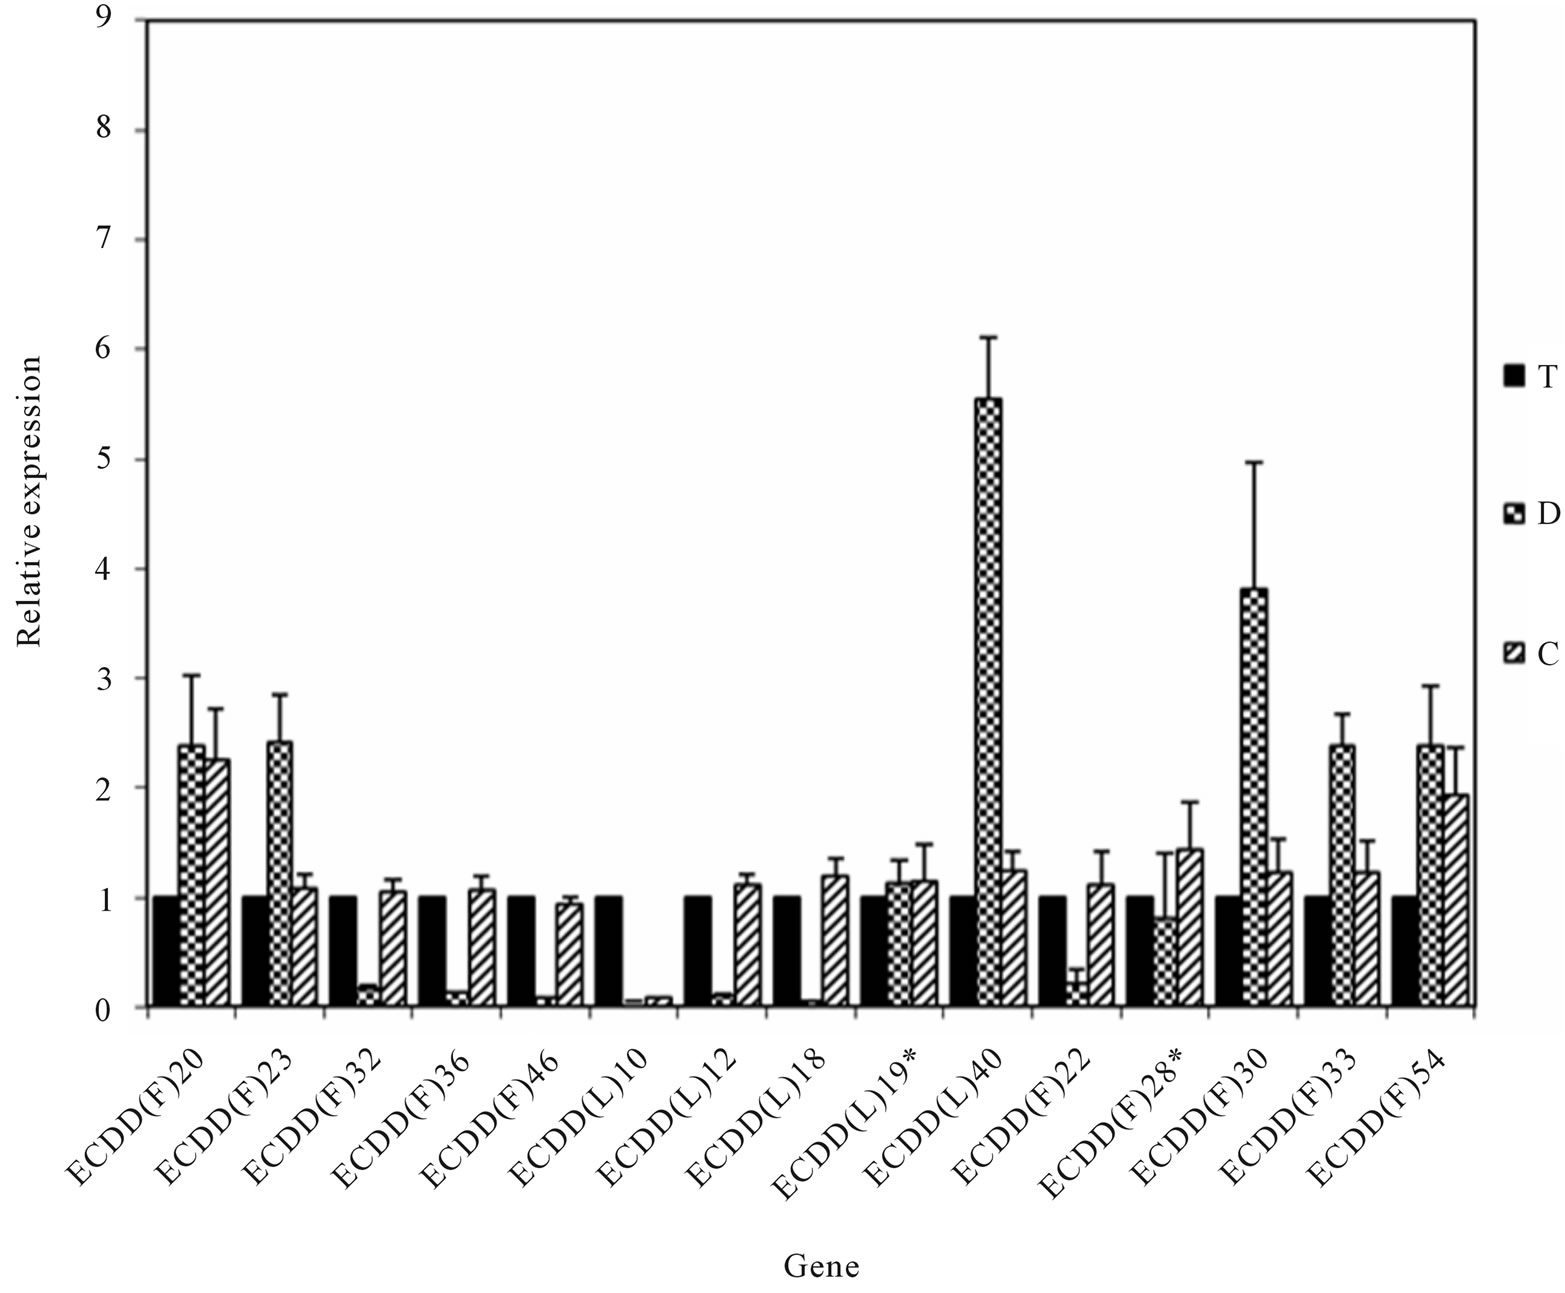
Figure 3. Real-time PCR validation of genes differentially expressed among plants in the E. curvula isogenic series with different reproductive modes and ploidy levels. The Y-axis represents relative expression compared with control genotype. Black bars correspond to the 4x apomictic genotype (T). Bars with squares and stripes correspond to 2x (D) and 4x (C) sexual genotypes, respectively. Differences between mean values were evaluated using Student’s t-tests with paired samples (P < 0.05). Standard deviations are indicated at the top of the bars. *Samples that were not validated.
is controlled by a non-recombinant region, which may comprise several mega base-pairs. Two RFLP markers reported to be linked to the trait in Tripsacum (csu68 and umc28) are located at a distal position on maize Chr 6 L (close to the telomere), at 0 cM from each other [21]. Interestingly, the ago104 locus (whose disruption causes a phenotype that mimics diplospory) maps within this particular region [20]. In other species, the apomixesgoverning regions were also detected to be large chromosomal areas with suppressed recombination, i.e., in Pennisetum squamulatum and Paspalum notatum, the apospory-governing locus involves a non-recombinant fragment of 50 Mbp and 36 Mbp, respectively [51,52].
Figure 4(a) shows the chromosomal location of the differentially expressed genes mapped onto maize Chr 6. Nineteen genes from the DD analysis and 10 from our ESTs sequencing project [35] were successfully mapped based on homology with maize sequences. The landmark csu68 was located at a distal (subtelomeric) position on the maize 6 L chromosome. All the differentially expressed sequences, except for contig 44 (hypersensitiveinduced response protein, unexpected group), were located between csu68 and the centromere. It is interesting to note that out of a total of 29 differentially expressed genes located on maize Chr 6, 3 were related to the reproductive mode, 16 were ploidy-related and 10 were in the “unexpected” group (showing similar expression in the 2x sexual and the 4x apomictic plants). Of the 29 total candidates, 17 were located within a 50.1 Mbp region surrounding markers previously associated with diplospory [21]. Most of the transcripts mapped to this particular region were affected by ploidy changes (equally expressed in both 4x genotypes, but differentially expressed in the 2x genotype, 8 transcripts) or alternatively, were in the “unexpected” group (equally expressed in the 2x sexual and the 4x apomictic genotypes, differentially expressed in the 4x sexual genotype, 8 transcripts). Only one gene mapping to this region (ECDD(F)28, retrotransposon protein, at 33.8 Mbp of the csu68 marker) was associated with the reproductive mode, being up-regulated in both sexual plants (diploid and tetraploid) and down-regulated in the apomictic one (tetraploid). These observations indicate that the expression of genes located in this region might be strongly influenced by ploidy changes, and that some particular subregions fail to respond to ploidy changes in the diplosporous genotype. However, local rearrangements of the E. curvula genome with respect to the maize one may complicate the detection of the expression scenario in this genomic area.
Figures 4(b) and (c) shows a similar in silico mapping analysis involving transcripts located on maize chromosomes 8 and 3, reported as syntenics for the diplospory region [22]. Five genes from the DD analysis and 14 ESTs could be successfully mapped on chromosome 8
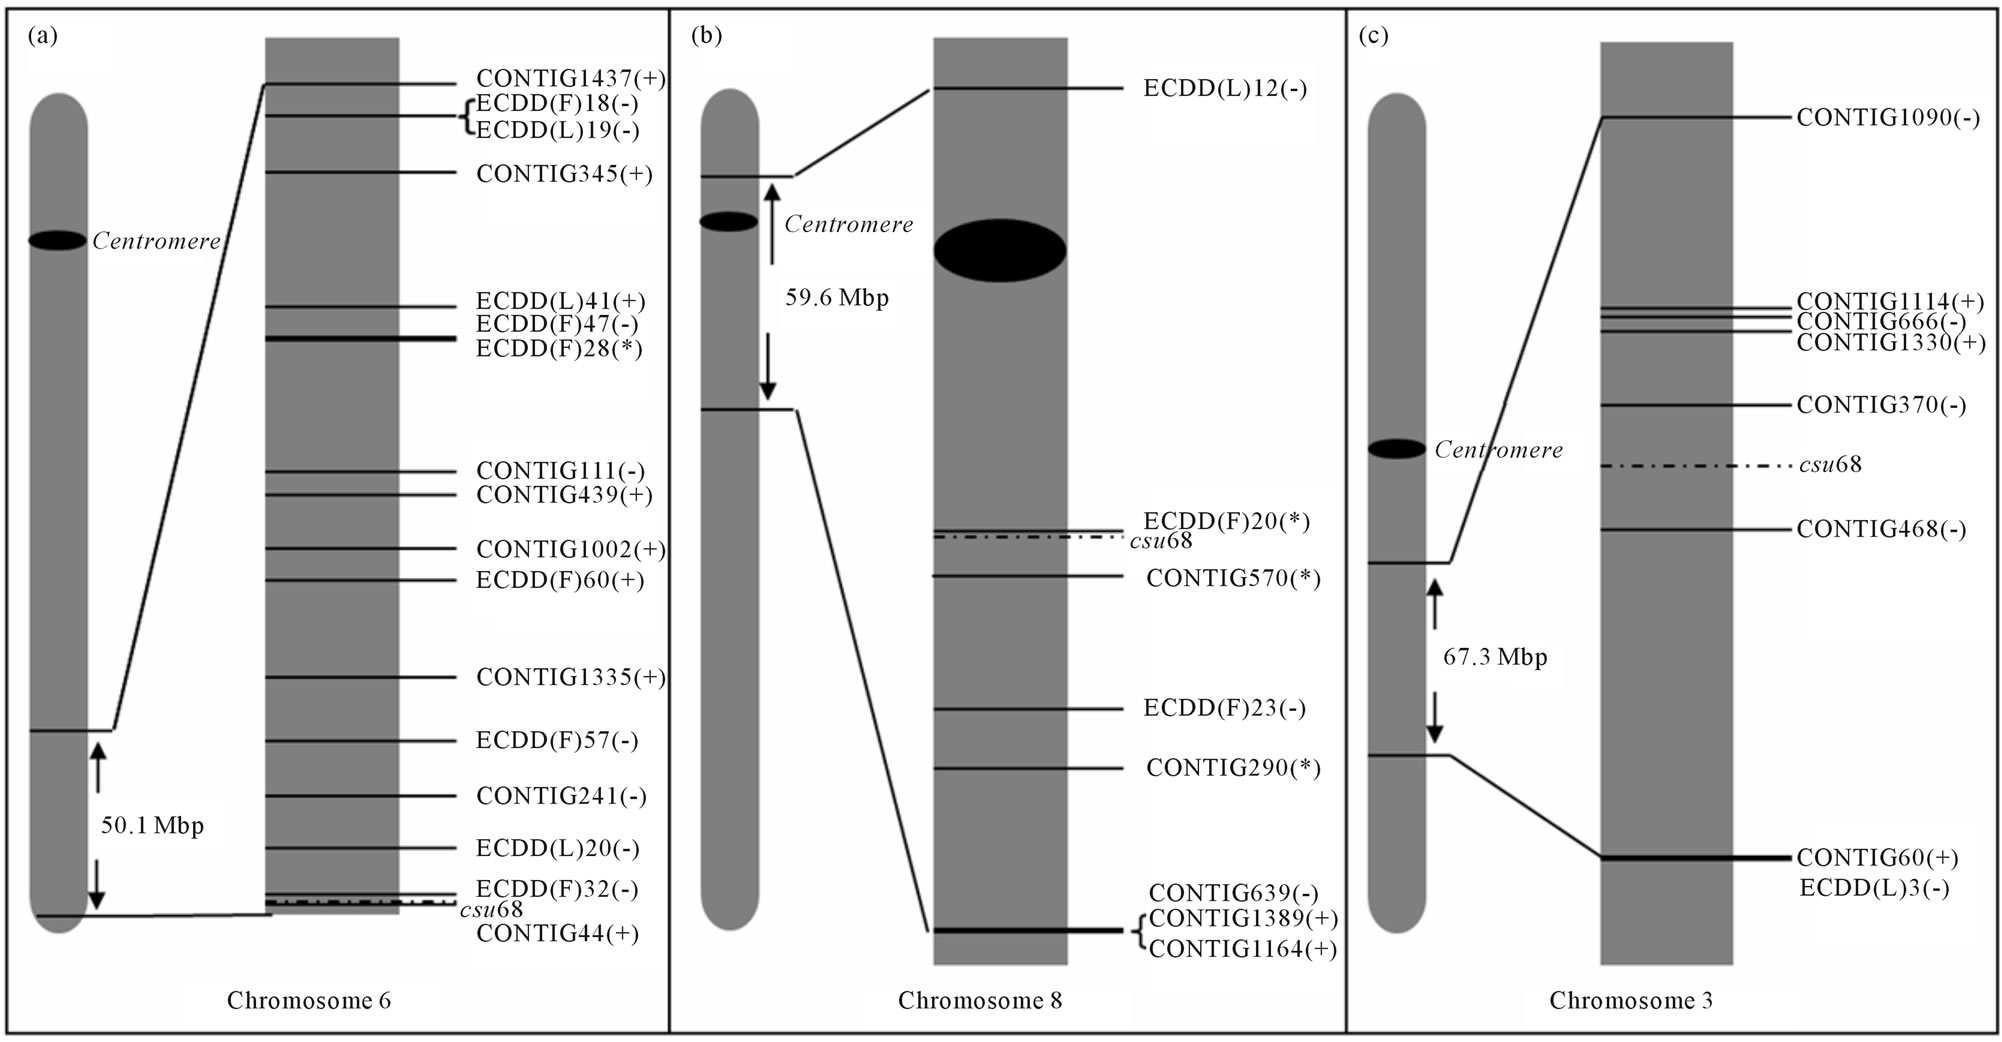
Figure 4. In silico mapping diagram. (a) Maize chromosome 6 showing the 50.1 Mbp region surrounding the csu68 marker, which was linked to the DIP locus in Tripsacum (Leblanc et al. 1995); (b) Maize chromosome 8 showing 59.6 Mbp region surrounding the csu68 marker; (c) Maize chromosome 3 showing the 67.3 Mbp region surrounding the csu68 marker. Distances from in silico mapped sequences to marker are represented in scale. (+) unexpected sequences; (−) ploidy-related sequences, (*) sequences associated with reproductive mode.
(Figure 4(b)). From a total of 19 differentially expressed genes located on maize Chr 8, 3 were diplospory-related, 9 were ploidy-related and 7 were unexpected genes. As in Chr 6 L, this region could be perceived as a ploidycontrolled region. Out of eight genes mapped within a 59.6-Mbp region, three were associated with the reproductive mode (two downregulated and one upregulated in the apomictic genotype), three were ploidy-regulated (two upregulated in the diploid genotype), and two belonged to the unexpected group. Unexpected genes in this region were downregulated in the apomictic and diploid plants. On chromosome 3 (Figure 4(c)) seven (7) genes from the DD and 19 ESTs could be successfully mapped. From a total of 26 differentially expressed genes located on maize Chr 3, three were diplospory-related, 15 were ploidyrelated, and 8 were unexpected genes. As in Chr 6 L and 8 L, this region could be perceived as a ploidy-controlled region. Out of eight genes mapped within a 67.3 Mbp region, none was associated with the reproductive mode, five were ploidy-related (three upregulated in the diploid genotype), and three belonged to the unexpected group. Two of the unexpected genes in this region were downregulated in the apomictic and diploid plants.
If we consider the expression status of these genes in the apomictic, diploid sexual, and tetraploid sexual genotypes, and the total number of genes mapped in silico, silencing predominates in the apomictic genotype with respect to the sexual ones.
Differentially expressed sequences included repetitive elements, protein kinases, ribosomal proteins, transcription factors, elongation factors, proline-rich proteins, proteins responsive to stress, cell cycle proteins, proteins with domains to bind or alter DNA, and cytochrome P450 family proteins. Sequences with similar annotations have been reported to be associated with apomixis and/or polyploidy for various other species, including Poa pratensis [53], Paspalum notatum [44,45], potato [54], Pennisetum squamulatum and Cenchrus ciliare [25], Panicum maximum [55], and Paspalum simplex [24,56]. Taking into account our previous results in E. curvula [32, 33,35], the results of the present study, and those reported for other species by other authors, there are many commonalities among the different species with respect to apomixis. Despite the variations in developmental patterns among the different species, apomixis appears to display conserved features at the molecular level. For example, annotation comparisons among sequences differentially expressed in P. pratensis [53] and P. notatum [44] revealed 5 genes with identical predicted function: outer membrane LRR receptor kinase, kinesin motor protein, GPI anchored protein, UDP glucose glucosyl transferase and ribosomal protein S12 [44]. Several of the candidates differentially expressed in both species seem to be involved in a signal transduction cascade of the ERK type, with deviations controlled by a Ras ortholog and phospholipase C [44].
Analyses of the differentially expressed genes among transcriptomes provide evidence for an association between a group of genes and a particular trait. However, further experimental evidence is required to confirm that the identified candidates participate in reproductive development and/or are regulated by ploidy changes. In the near future, the identified fragments will be used to perform genetic transformation in E. curvula using sense, antisense, and/or hairpin technology, to investigate their functional role in reproductive development.
4. Acknowledgements
This project was supported by the Agencia Nacional de Promoción Científica y Tecnológica (ANPCyT, Argentina), grants PAV 137/4, CONICET-PIP 112-200801- 01517 and SEGCyT UNS, PGI 24A/133.
REFERENCES
- G. Nogler, “Gametophytic Apomixis,” In: B. Johri, Ed., Embryology of Angiosperms, Springer Verlag, Berlin, 1984, pp. 475-518. doi:10.1007/978-3-642-69302-1_10
- P. Ozias-Akins and P. van Dijk, “Mendelian genetics of apomixis in plants,” Annual Review of Genetics, Vol. 41, No. 2, 2007, pp. 509-537. doi:10.1146/annurev.genet.40.110405.090511
- A. J. Richards, “Apomixis in Flowering Plants: An Overview,” Philosophical Transaction of the Royal Society B, Vol. 358, No. 1434, 2003, pp. 1085-1093. doi:10.1098/rstb.2003.1294
- U. Grossniklaus, “From Sexuality to Apomixis: Molecular and Genetic Approaches,” In: Y. Savidan, G. Carman, T. Dresselhaus, Eds., Flowering of Apomixis: From Mechanisms to Genetic Engineering, CIMMYT, Mexico City, 2001, pp. 168-211.
- R. A. Bicknell and A. M. Koltunow, “Understanding Apomixis: Recent Advances and Remaining Conundrums,” The Plant Cell, Vol. 16, Suppl. 1, 2004, pp. S228-S245. doi:10.1105/tpc.017921
- J. E. Bradley, G. C. Carman, M. S. Jamison and T. N. Naumova, “Heterochronic Features of the Female Germline among Several Sexual Diploid Tripsacum L. (Andropogoneae, Poaceae),” Sex Plant Reproduction, Vol. 20, No. 1, 2007, pp. 9-17. doi:10.1007/s00497-006-0038-0
- D. Grimanelli, M. García, E. Kaszas, E. Perotti and O. Leblanc, “Heterochronic Expression of Sexual Reproductive Programs during Apomictic Development in Tripsacum,” Genetics, Vol. 165, No. 3, 2003, pp. 1521-1531.
- T. F. Sharbel, M. L. Voigt, J. M. Corral, G. Galla, J. Kumlehn, C. Klukas, F. Schreiber, H. Vogel and B. Rotter, “Apomictic and Sexual Ovules of Boechera Display Heterochronic Global Gene Expression Patterns,” The Plant Cell, Vol. 22, No. 3, 2010, pp. 655-671. doi:10.1105/tpc.109.072223
- M. R. Tucker, A. C. Araujo, N. A. Paech, V. Hecht, D. L. Schmidt, J. B. Rossell, S. C. de Vries and A. M. Koltunow, “Sexual and Apomictic Reproduction in Hieracium Subgenus Pilosella Are Closely Interrelated Developmental Pathways,” The Plant Cell, Vol. 15, No. 7, 2003, pp. 1524-1537. doi:10.1105/tpc.011742
- M. D. Bennett, “Nuclear DNA Content and Minimum Generation Time in Herbaceous Plants,” Philosophical Transaction of the Royal Society B, Vol. 181, No. 1063, 1972, pp. 109-135.
- P. Voigt, N. Rethman and M. Poverene, “Lovegrasses,” In: Warm-Season (C4) Grass, American Society of Agronomy, Madison, 2004, pp. 1027-1056.
- M. Poverene and P. Voigt, “Isozyme Variation and Germplasm Relationships in the Eragrostis curvula Complex,” Biochemical Systematics and Ecology, Vol. 25, No. 1, 1997, pp. 21-32. doi:10.1016/S0305-1978(96)00089-0
- L. J. Streetman, “Reproduction of the Lovegrasses, the Genus Eragrostis: Eragrostis chloromelas Stend. E. Curvula (Schrad.) Nees., E. lehmanniana Nees. and E. superba Peyr. Wrightia,” A Botanical Journal, Vol. 3, 1963, pp. 41-51.
- C. Crane, “Classification of Apomictic Mechanisms,” In: Y. Savidan, G. Carman and T. Dresselhaus, Eds., Flowering of Apomixis: From Mechanisms to Genetic Engineering, CIMMYT, Mexico City, 2001, pp. 168-211.
- R. D. Noyes, “Inheritance of Apomeiosis (Diplospory) in Fleabanes (Erigeron, Asteraceae),” Heredity, Vol. 94, No. 2, 2005, pp. 193-198. doi:10.1038/sj.hdy.6800597
- R. D. Noyes, “Apomixis via Recombination of Genome Regions for Apomeiosis (Diplospory) and Parthenogenesis in Erigeron (Daisy Fleabane, Asteraceae),” Sexual Plant Reproduction, Vol. 19, No. 1, 2006, pp. 7-18. doi:10.1007/s00497-005-0017-x
- R. D. Noyes and L. H. Rieseberg, “Two Independent Loci Control Agamospermy (Apomixis) in the Triploid Flowering Plant Erigeron annuus,” Genetics, Vol. 155, No. 1, 2000, pp. 379-390.
- P. J. van Dijk and J. M. Bakx-Schotman, “Formation of Unreduced Megaspores (Diplospory) in Apomictic Dandelions (Taraxacum officinale, s.l.) Is Controlled by a Sex-Specific Dominant Locus,” Genetics, Vol. 166, No. 1, 2004, pp. 483-492. doi:10.1534/genetics.166.1.483
- K. Vijverberg, R. G. van der Hulst, P. Lindhout and P. J. van Dijk, “A Genetic Linkage Map of the Diplosporous Chromosomal Region in Taraxacum officinale (Common Dandelion; Asteraceae),” Theoretical and Applied Genetics, Vol. 108, No. 4, 2004, pp. 725-732. doi:10.1007/s00122-003-1474-y
- D. Grimanelli, O. Leblanc, E. Espinosa, E. Perotti, D. Gonzáles de León and Y. Savidán, “Mapping Diplosporous Apomixis in Tetraploid Tripsacum: One Gene or Several Genes?” Heredity, Vol. 80, No. 1, 1998, pp. 33-39. doi:10.1046/j.1365-2540.1998.00263.x
- O. Leblanc, D. Grimanelli, D. Gonzalez de Leon and Y. Savidán, “Detection of the Apomictic Mode of Reproduction in Maize-Tripsacum Hybrids Using Maize RFLP Markers,” Theoretical and Applied Genetics, Vol. 90, No. 7-8, 1995, pp. 1198-1203. doi:10.1007/BF00222943
- Y. Savidan, D. Grimanelli, E. Perotti and O. Leblanc, “Means for Identifying Nucleotide Sequences Involved in Apomixis,” US Patent No. 2008/0155712 A1, 2008.
- O. Calderini, S. B. Chang, H. de Jong, A. Busti, F. Paolocci, S. Arcioni, S. C. de Vries, M. H. Abma-Henkens, R. M. Lankhorst, I. S. Donnison and F. Pupilli, “Molecular Cytogenetics and DNA Sequence Analysis of an Apomixis-Linked BAC in Paspalum simplex Reveal a Non Pericentromere Location and Partial Microcolinearity with Rice,” Theoretical and Applied Genetics, Vol. 112, No. 6, 2006, pp. 1179-1191. doi:10.1007/s00122-006-0220-7
- O. Calderini, I. Donnison, L. Polegri, F. Panara, A. Thomas, S. Arcioni and F. Pupilli, “Partial Isolation of the Genomic Region Linked with Apomixis in Paspalum simplex,” Molecular Breeding, Vol. 28, No. 2, 2011, pp. 265- 276. doi:10.1007/s11032-010-9480-7
- J. A. Conner, S. Goel, G. Gunawan, M. M. CordonnierPratt, V. Ed Johnson, C. Liang, H. Wang, L. H. Pratt, J. E. Mullet, J. DeBarry, L. Yang, J. L. Bennetzen, P. E. Klein and P. Ozias-Akins, “Sequence Analysis of Bacterial Artificial Chromosome Clones from the Apospory-Specific Genomic Region of Pennisetum and Cenchrus,” Plant Physiology, Vol. 147, No. 3, 2008, pp. 1396-1411. doi:10.1104/pp.108.119081
- C. B. Yadav, Anuj, S. Kumar, M. G. Gupta and V. Bhat, “Genetic Linkage Maps of the Chromosomal Regions Associated with Apomictic and Sexual Modes of Reproduction in Cenchrus ciliaris,” Molecular Breeding, 2011.
- O. Leblanc, D. Grimanelli, M. Hernandez-Rodriguez, P. A. Galindo, A. M. Soriano-Martinez and E. Perotti, “Seed Development and Inheritance Studies in Apomictic MaizeTripsacum Hybrids Reveal Barriers for the Transfer of Apomixis into Sexual Crops,” The International Journal of Developmental Biology, Vol. 53, No. 4, 2009, pp. 585- 596. doi:10.1387/ijdb.082813ol
- V. Olmedo-Monfil, N. Durán-Figueroa, M. Arteaga-Vázquez, E. Demesa-Arévalo, D. Autran, D. Grimanelli, R. K. Slotkin, R. A. Martienssen and J. P. Vielle-Calzada, “Control of female Gamete Formation by a Small RNA Pathway in Arabidopsis,” Nature, Vol. 464, No. 7288, 2010, pp. 628-632. doi:10.1038/nature08828
- M. Singh, S. Goel, R. B. Meeley, C. Dantec, H. Parrinello, C. Michaud, O. Leblanc and D. Grimanelli, “Production of Viable Gametes without Meiosis in Maize Deficient for an ARGONAUTE Protein,” The Plant Cell, Vol. 23, No. 2, 2011, pp. 443-458. doi:10.1105/tpc.110.079020
- M. Garcia-Aguilar, C. Michaud, O. Leblanc, D. Grimanelli, “Inactivation of a DNA Methylation Pathway in Maize Reproductive Organs Results in Apomixis-Like Phenotypes,” The Plant Cell, Vol. 22, No. 10, 2010, pp. 3249-3267. doi:10.1105/tpc.109.072181
- S. Cardone, P. Polci, J. P. Selva, M. Mecchia, S. Pessino, P. Hermann, V. Cambi, P. Voigt, G. Spangenberg and V. Echenique, “Novel Genotypes of the Subtropical Grass Eragrostis curvula for the Study of Apomixis (Diplospory),” Euphytica, Vol. 151, No. 2, 2006, pp. 263-272. doi:10.1007/s10681-006-9156-x
- M. A. Mecchia, A. Ochogavía, J. P. Selva, N. Laspina, S. Felitti, L. G. Martelotto, G. Spangenberg, V. Echenique and S. C. Pessino, “Genome Polymorphisms and Gene Differential Expression in a ‘Back-and-Forth’ Ploidy-Altered Series of Weeping Lovegrass (Eragrostis curvula),” Journal of Plant Physiology, Vol. 164, No. 8, 2007, pp. 1051-1061. doi:10.1016/j.jplph.2006.07.002
- A. C. Ochogavía, G. Cervigni, J. P. Selva, V. C. Echenique and S. C. Pessino, “Variation in Cytosine Methylation Patterns during Ploidy Level Conversions in Eragrostis curvula,” Plant Molecular Biology, Vol. 70, No. 1-2, 2009, pp. 17-29. doi:10.1007/s11103-009-9454-5
- G. D. L. Cervigni, N. Paniego, M. Díaz, J. P. Selva, D. Zappacosta, D. Zanazzi, I. Landerreche, L. Martelotto, S. Felitti, S. Pessino, G. Spangenberg and V. Echenique, “Expressed Sequence Tag Analysis and Development of Gene Associated Markers in a Near-Isogenic Plant System of Eragrostis curvula,” Plant Molecular Biology, Vol. 67, No. 1-2, 2008, pp. 1-10. doi:10.1007/s11103-007-9282-4
- G. D. L. Cervigni, N. Paniego, S. Pessino, J. P. Selva, M. Díaz, G. Spangenberg and V. Echenique, “Gene Expression in Diplosporous and Sexual Eragrostis curvula Genotypes with Differing Ploidy Levels,” Plant Molecular Biology, Vol. 67, No. 1-2, 2008, pp. 11-23. doi:10.1007/s11103-008-9305-9
- P. Liang and A. B. Pardee, “Differential Display of Eukaryotic Messenger RNA by Means of the Polymerase Chain Reaction,” Science, Vol. 257, No. 5072, 1992, pp. 967-971. doi:10.1126/science.1354393
- M. V. Matz and S. A. Lukyanov, “Different Strategies of Differential Display: Areas of Application,” Nucleic Acids Research, Vol. 26, No. 24, 1998, pp. 5537-5543. doi:10.1093/nar/26.24.5537
- T. Murashige and F. Skoog, “A Revised Medium for Rapid Growth and Bioassay with Tobacco Tissue Cultures,” Physiologia Plantarum, Vol. 15, No. 3, 1962, pp. 473-497. doi:10.1111/j.1399-3054.1962.tb08052.x
- D. A. Johansen, “Plant Microtechnique,” McGraw-Hill Book Co., New York and London, 1940.
- P. Jaccard, “Nouvelles Recherches sur la Distribution Florale,” Société Vaudoise des Sciences Naturelles Bulletin, Vol. 44, 1908, pp. 223-270.
- S. Altschul, T. Madden, A. Schäffer, J. Zhang, Z. Zhang, W. Miller and D. Lipman, “Gapped BLAST and PSIBLAST: A New Generation of Protein Database Search Programs,” Nucleic Acids Research, Vol. 25, No. 27, 1997, pp. 3389-3402. doi:10.1093/nar/25.17.3389
- Z. Zhang, S. Schwartz, L. Wagner and W. Miller, “A Greedy Algorithm for Aligning DNA Sequences,” Journal of Computational Biology, Vol. 7, No. 1-2, 2000, pp. 203-214. doi:10.1089/10665270050081478
- K. J. Livak and T. D. Schmittgen, “Analysis of Relative Gene Expression Data Using Real-Time Quantitative PCR and the 2-ΔΔCt Method,” Methods, Vol. 25, No. 4, 2001, pp. 402-408. doi:10.1006/meth.2001.1262
- N. Laspina, T. Vega, G. Seijo, A. Gonzalez, L. Martelotto, J. Stein, M. Podio, J. P. Ortiz, V. Echenique, C. Quarin and S. Pessino, “Gene Expression Analysis at the Onset of Aposporous Apomixis in Paspalum notatum,” Plant Molecular Biology, Vol. 67, No. 6, 2008, pp. 615-628. doi:10.1007/s11103-008-9341-5
- L. Martelotto, J. P. Ortiz, F. Espinoza, C. Quarin and S. Pessino, “A Comprehensive Analysis of Gene Expression Alterations in a Newly Synthesized Paspalum notatum Autotetraploid,” Plant Science, Vol. 169, No. 1, 2005, pp. 211-220. doi:10.1016/j.plantsci.2005.03.015
- Y. Haoa, X. Wen and X. Deng, “Genetic and Epigenetic Evaluations of Citrus Calluses Recovered from SlowGrowth Culture,” Journal of Plant Physiology, Vol. 161, No. 4, 2004, pp. 479-484. doi:10.1078/0176-1617-01102
- L. Xiong, C. Xu, M. Shagai Maroof and Q. Zhang, “Patterns of Cytosine Methylation in an Elite Rice Hybrid and Its Parental Genotypes, Detected by a Methylation-Sensitive Amplification Polymorphism Technique,” Molecular and General Genetics, Vol. 261, No. 3, 1999, pp. 439- 446. doi:10.1007/s004380050986
- E. L. Peredo, M. A. Revilla and R. Arroyo-Garcia, “Assessment of Genetic and Epigenetic Variation in Hop Plants Regenerated from Sequential Sub-Cultures of Organogenic Calli,” Journal of Plant Physiolgy, Vol. 163, No. 10, 2006, pp. 1071-1079. doi:10.1016/j.jplph.2005.09.010
- H. Ozkan, A. A. Levy and M. Feldman, “Rapid Differentiation of Homoeologous Chromosomes in Newly-Formed Allopolyploid Wheat,” Israel Journal of Plant Sciences, Vol. 50, Suppl. 1, 2002, pp. S65-S76. doi:10.1560/E282-PV55-G4XT-DRWJ
- Y. Savidan, “Apomixis: Genetics and Breeding,” In: J. Janick, Ed., Plant Breeding Reviews, Vol. 18, Kluwer Academic Publ., Dordrecht, 2000, pp. 13-86.
- Y. Akiyama, W. W. Hanna and P. Ozias-Akins, “HighResolution Physical Mapping Reveals that the AposporySpecific Genomic Region (ASGR) in Cenchrus ciliaris Is Located on a Heterochromatic and Hemizygous Region of a Single Chromosome,” Theoretical and Applied Genetics, Vol. 111, No. 6, 2005, pp. 1042-1051. doi:10.1007/s00122-005-0020-5
- J. Stein, S. Pessino, E. Martínez, M. Rodriguez, L. Siena, C. Quarin and J .Ortiz, “A Genetic Map of Tetraploid Paspalum notatum Flügge (Bahiagrass) Based on SingleDose Molecular Markers,” Molecular Breeding, Vol. 20, No. 2, 2007, pp. 153-166. doi:10.1007/s11032-007-9083-0
- E. Albertini, G. Marconi, G. Barcaccia, L. Raggi and M. Falcinelli, “Isolation of Candidate Genes for Apomixis in Poa pratensis,” Plant Molecular Biology, Vol. 56, No. 6, 2004, pp. 879-894. doi:10.1007/s11103-004-5211-y
- R. M. Stupar, P. B. Bhaskar, B. S. Yandell, W. A. Rensink, A. L. Hart, S. Ouyang, R. E. Veilleux, J. S. Busse, R. J. Erhardt, C. R. Buell and J. Jiang, “Phenotypic and Transcriptomic Changes Associated with Potato Autopolyploidization,” Genetics, Vol. 176, No. 4, 2007, pp. 2055- 2067. doi:10.1534/genetics.107.074286
- H. Yamada-Akiyama, Y. Akiyama, M. Ebina, Q. Xu, S. Tsuruta, J. Yazaki, N. Kishimoto, S. Kikuchi, M. Takahara, T. Takamizo, S. Sugita and H. Nakagawa, “Analysis of Expressed Sequence Tags in Apomictic Guineagrass (Panicum maximum),” Journal of Plant Physiology, Vol. 166, No. 7, 2009, pp. 750-761. doi:10.1016/j.jplph.2008.10.001
- L. Polegri, O. Calderini, S. Arcioni and F Pupilli, “Specific Expression of Apomixis-Linked Alleles Revealed by comparative Transcriptomic Analysis of Sexual and Apomictic Paspalum simplex Morong Flowers,” Journal of Experimental Botany, Vol. 61, No. 6, 2010, pp. 1869-1883. doi:10.1093/jxb/erq054