Theoretical Economics Letters
Vol.4 No.7(2014), Article ID:48760,6 pages
DOI:10.4236/tel.2014.47077
Possible Tendencies of Economic Development of Russia
Sergey А. Surkov*
International Institute of Management, Moscow, Russia
Email: context2002@yandex.ru, context2002@yahoo.com
Copyright © 2014 by author and Scientific Research Publishing Inc.
This work is licensed under the Creative Commons Attribution International License (CC BY).
http://creativecommons.org/licenses/by/4.0/


Received 20 June 2014; revised 12 July 2014; accepted 10 August 2014
ABSTRACT
It was proposed to use the sum of production functions of different lifestyles, to describe the changes in the Russian economy. Values of indicators of a power function of Cobb-Douglas were received from approximate formulas on the basis of data from various sources. A good concordance with change process of Russia’s GDP, what permit to predict its behavior in the future, was received.
Keywords:Economic Ways, Economic Lifestyle, Social and Economic Structure, Revenue, Domestic Product

However, the perspective development of society depends on how advanced, albeit small part of this society lives. This prospect is not a joyful for the present. The Ministry of economic development has reduced its expectations on the long-term growth of world and Russian economy. These calculations on the prediction were carried out using the scenarios assessment for the case of a conservative scenario. According to this new basic scenario it is supposed that the share of Russia in world economy will decrease from 4.0% in 2012 to 3.4% in 2030, the main recession will begin after 2020 [1] . 2. Literature Review@NolistTemp# Promising forms of development of economic relations within the modern society lighted in many papers. For example, in sufficient detail they write about small fraction of the innovation economy in Russia. In reference [2] it is indicated that “as far as the ability to create new knowledge is concerned, Russian companies perform better. Their share of expenditure on R & D in 2007, as a percentage of GDP, was 0.7 percent”. Change of lifestyles distribution among themselves is a consequence of features of economic development. As stated in reference [3] , “modern European lifestyles are unsustainable in many ways and are based on overproduction and overconsumption; putting too much pressure on our natural resources and imposing negative environmental, economic, (individual and collective) social and health impacts”. It is noted also that this question is very important for economy. Countries that promote exports of more “sophisticated” goods grow faster. Of course it could be that by pushing investments into sophisticated activities for which the economy has no innate comparative advantage China and other countries with similar policies have ended up penalizing their economies [4] . In article F. Pfeiffer and K. Reuß [5] was made attempt to describe accumulation of the factors providing development of the human capital with age. There are two equations, one for cognitive, one for self-regulatory skills, that specify skill formation and depreciation on a yearly basis over the life span of 80 periods (years). 3. Materials and Methods@NolistTemp# The first category of data was obtained from various sources, including statistical directories, speeches of officials and articles about social and economic position of regions of Russia. The second part of the data on the share of the effects of certain lifestyles was obtained by interviewing 128 experts. 4. Theory@NolistTemp# Economic mechanism of Russia is under considerable influence from different lifestyles. The part of the population must survive, and its lifestyle is difficult to call differently, than preindustrial. Power structures have started talking about reindustrialization. The most successful part of the population implements post-industrial approach to the organization of their work. All these lifestyles mixed forming a strange mosaic of interaction that hinders the economic development of the country and strengthens the impoverishment of the population. Most of inhabitants of Russia are not confident that their diligent work will receive an adequate return in the form of material and moral compensation. It is accepted to use production function for the description the regularities of results of labor. Production function allows you to set dependence between the volume of the final product and the volumes used factors of production. The production function has the form Y = f(Xi). In the particular case it takes the form of the function Cobb-Douglas
 , where Y—the final product; A—parameter that plays a dual
role. He describes the proportion of unaccounted factors in the model and provides
a reduction to the a unified dimension of all the factors;
, where Y—the final product; A—parameter that plays a dual
role. He describes the proportion of unaccounted factors in the model and provides
a reduction to the a unified dimension of all the factors;
 —the most important factors of production;
 —elasticity coefficients characterizing the impact of factorial
signs on the outcome [6] . D. Rodrik [7] proposed several formulas of production functions for
different economic lifestyles, but combine them to assess the production in modern
society is difficult. Production function of Cobb - Douglas was the first model
of production function. It is constructed as a result of processing of statistical
data on manufacturing industry of the USA for 1899-1922. The dependence the volume
of the output on two factors: of the volume labor and capital is investigated in
the model. Function of Cobb - Douglas has the form Y = ALαKß,
where L—the volume of a manpower; α—coefficient of elasticity of labor; K—the volume
of fixed capital; ß—the coefficient of elasticity capital. In this model α
+ ß = 1. Further, the NTP factor Y = ALaKßent
was entered into the function of Cobb - Douglas, where e—base of natural logarithms;
n—coefficient of elasticity factor of NTP, i.e. parameter of increment aggregate
efficiency of factors, t—the period for which growth parameters are determined [8] . The coefficient of elasticity of a factor
of NTP characterizes an indicator of multifactor productivity as rate of a gain
of production output in addition to the gain caused by extensive factors. For definition
of components of production function for various societies it is possible to use,
as a first approximation, an approximate formula of a linear extrapolation (1).
—elasticity coefficients characterizing the impact of factorial
signs on the outcome [6] . D. Rodrik [7] proposed several formulas of production functions for
different economic lifestyles, but combine them to assess the production in modern
society is difficult. Production function of Cobb - Douglas was the first model
of production function. It is constructed as a result of processing of statistical
data on manufacturing industry of the USA for 1899-1922. The dependence the volume
of the output on two factors: of the volume labor and capital is investigated in
the model. Function of Cobb - Douglas has the form Y = ALαKß,
where L—the volume of a manpower; α—coefficient of elasticity of labor; K—the volume
of fixed capital; ß—the coefficient of elasticity capital. In this model α
+ ß = 1. Further, the NTP factor Y = ALaKßent
was entered into the function of Cobb - Douglas, where e—base of natural logarithms;
n—coefficient of elasticity factor of NTP, i.e. parameter of increment aggregate
efficiency of factors, t—the period for which growth parameters are determined [8] . The coefficient of elasticity of a factor
of NTP characterizes an indicator of multifactor productivity as rate of a gain
of production output in addition to the gain caused by extensive factors. For definition
of components of production function for various societies it is possible to use,
as a first approximation, an approximate formula of a linear extrapolation (1).
 (1) The particular case of the production function is described in article L.N.
Bulgakova [9] as
(1) The particular case of the production function is described in article L.N.
Bulgakova [9] as
 (2) 5. Results@NolistTemp# Further we will look for the production function as a
product of sedate components. Determination of indicators of the production function
for the pre-industrial society can be performed on the basis of the data presented
in the book V. M. Kudrov [10] . Calculations give
the opportunity to get this function as
(2) 5. Results@NolistTemp# Further we will look for the production function as a
product of sedate components. Determination of indicators of the production function
for the pre-industrial society can be performed on the basis of the data presented
in the book V. M. Kudrov [10] . Calculations give
the opportunity to get this function as
 (3)
(3)To account NTP we will use growth curve significant inventions by L. Mamford [11] , which is described by the expression
 (4) However, for the different periods in mankind life
this general regularity changes a little. Definition of private indicators for various
societies can be approximately obtained from the formula
(4) However, for the different periods in mankind life
this general regularity changes a little. Definition of private indicators for various
societies can be approximately obtained from the formula
 (5)
(5)
 (6)
(6)
 (7) Production function of postindustrial society was determined approximately on
the basis of data for one of the most advanced in the scientifically-advanced city
of St. Petersburg. This is due to the fact that Moscow is more associated with the
bank and trade sectors than the St. Petersburg. Production function obtained by
E. E. Kolchinskaya [14] as
(7) Production function of postindustrial society was determined approximately on
the basis of data for one of the most advanced in the scientifically-advanced city
of St. Petersburg. This is due to the fact that Moscow is more associated with the
bank and trade sectors than the St. Petersburg. Production function obtained by
E. E. Kolchinskaya [14] as
 (8) We can get dependencies material expenditures by evaluating the most typical
kinds of raw materials, such as electricity consumption. On the basis of data source
[15] , we can obtain the dependence of the form
М0.001 for typical Russian Voronezh region. The same dependence has the
form М0.113 for the Leningrad region on the basis of the source [16] . Differences and the unusual order of values of indicators
are related to the differences in energy consumption for the operation of the economic
mechanism. The formula for summarized production function has an appearance
(8) We can get dependencies material expenditures by evaluating the most typical
kinds of raw materials, such as electricity consumption. On the basis of data source
[15] , we can obtain the dependence of the form
М0.001 for typical Russian Voronezh region. The same dependence has the
form М0.113 for the Leningrad region on the basis of the source [16] . Differences and the unusual order of values of indicators
are related to the differences in energy consumption for the operation of the economic
mechanism. The formula for summarized production function has an appearance
 (9) where Yi—production functions for different formations, fi—the
share of different formations in the economic mechanism. Dependencies proportions
on the time obtained from the results of surveys experts, and have the form shown
in Figure 1. General view of the curves obtained
from the results of a survey of experts, is quite explainable. Pre-Industrial lifestyle
leaves together with outgoing generation of “baby boomers”, the part from which
“didn’t fit” into modern Russian realities. Industrial lifestyle experiencing a
“renaissance” in connection with re-industrialization plans. Post-industrial lifestyle
slowly accrues, what is connected with deficiency of sources for such growth. Analytical
representation of these dependencies, obtained by least squares, after discarding
second-order terms, is as follows: For pre-industrial lifestyle
(9) where Yi—production functions for different formations, fi—the
share of different formations in the economic mechanism. Dependencies proportions
on the time obtained from the results of surveys experts, and have the form shown
in Figure 1. General view of the curves obtained
from the results of a survey of experts, is quite explainable. Pre-Industrial lifestyle
leaves together with outgoing generation of “baby boomers”, the part from which
“didn’t fit” into modern Russian realities. Industrial lifestyle experiencing a
“renaissance” in connection with re-industrialization plans. Post-industrial lifestyle
slowly accrues, what is connected with deficiency of sources for such growth. Analytical
representation of these dependencies, obtained by least squares, after discarding
second-order terms, is as follows: For pre-industrial lifestyle
 (11) The share of post-industrial lifestyle will be
 (13) Calculations on a Formula (13) and comparison of results calculations with
change of GNP of Russia for the last decade allows receive the results shown in
Figure 2. From the graph in
Figure 2 is easy to see that the studied quantities are closely linked.
The correlation coefficient 0.993 is essential for all significance levels exceeding
0.01. The regression equation has the form
(13) Calculations on a Formula (13) and comparison of results calculations with
change of GNP of Russia for the last decade allows receive the results shown in
Figure 2. From the graph in
Figure 2 is easy to see that the studied quantities are closely linked.
The correlation coefficient 0.993 is essential for all significance levels exceeding
0.01. The regression equation has the form
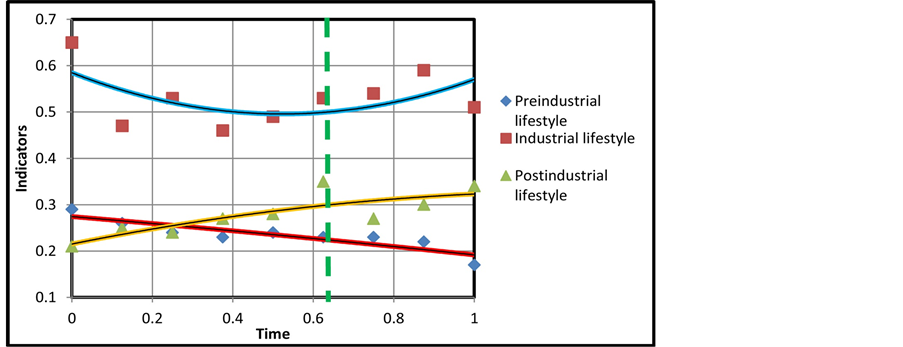
Figure 1. Dependences indicators of lifestyles on the time.

Figure 2. Comparison of Russia’s GDP and summarized production function.
 This testifies that the production function has not passed rationing, but unknown,
what could serve as the basis for such valuation. Thus, the integrations of dependencies
of changes of all three lifestyles with using additivity will not only allow to
describe, but also precisely enough will allow to predict changes of GNP of Russia.
6. Discussion@NolistTemp# Strictly speaking, the production functions defined by
Formula (3), in fact, are not quite the same because they were prepared by the approximate
formulas. It is more similar to non-normalized replicas of production functions,
all the more that indicators for various variables are defined separately. On the
other hand, they characterize the same society in the same period of its existence,
so that the error, if it is there, is not very big. Rationing especially is complicated
because there are no enough authentic data on results of the appendix of production
functions in specific conditions. Lack of constant coefficients before the functions
takes place intentionally, as this factor is taken into account coefficients attributed
experts. 7. Conclusions@NolistTemp# The obtained data testify to existence of all
three lifestyles in economy of Russia. Summation of production functions for these
lifestyles with the proposed experts weighting coefficients gives good agreement
with the course GNP Russia.
This testifies that the production function has not passed rationing, but unknown,
what could serve as the basis for such valuation. Thus, the integrations of dependencies
of changes of all three lifestyles with using additivity will not only allow to
describe, but also precisely enough will allow to predict changes of GNP of Russia.
6. Discussion@NolistTemp# Strictly speaking, the production functions defined by
Formula (3), in fact, are not quite the same because they were prepared by the approximate
formulas. It is more similar to non-normalized replicas of production functions,
all the more that indicators for various variables are defined separately. On the
other hand, they characterize the same society in the same period of its existence,
so that the error, if it is there, is not very big. Rationing especially is complicated
because there are no enough authentic data on results of the appendix of production
functions in specific conditions. Lack of constant coefficients before the functions
takes place intentionally, as this factor is taken into account coefficients attributed
experts. 7. Conclusions@NolistTemp# The obtained data testify to existence of all
three lifestyles in economy of Russia. Summation of production functions for these
lifestyles with the proposed experts weighting coefficients gives good agreement
with the course GNP Russia.This method allows to predict development of a situation and to estimate change of GNP of Russia in the future in short limits.
References
- HSBC: Russia Lags behind the Whole World. Website Quote.rbc.ru 20.01.2014.
http://quote.rbc.ru/topnews/2014/01/20/34099812.html -
Drzeniek Hanouz, M. and Prazdnichnykh, A.N. The Russia Competitiveness Report 2011.
Laying the
Foundation for Sustainable Prosperity. World Economic Forum. http://ru.scribd.com/doc/56697805/
The-Russia-Competitiveness-Report-2011 - Sustainable Lifestyles: Today’s Facts
& Tomorrow’s Trends. D1.1 Sustainable Lifestyles Baseline Re-
port. 159 p., 2013. http://www.sustainable-lifestyles.eu/fileadmin/images/content/D1.1_Baseline_
Report.pdf - Industrial Development for the 21st Century: Sustainable Development
Perspectives. UN Report,
New York, 2007, 420 p. http://www.un.org/esa/sustdev/publications/industrial_development/full_
report.pdf - Pfeiffer F. and Reub, K. (2008) Age-Dependent Skill Formation and Returns to Education. Labour Economics, №15, 631-646.
- Trunin, S.N. (2009) Labour Economics. ZAO “Publisher Economy”, Moscow, 496.
- Rodrik, D. (2007) Industrial Development: Some Stylized Facts and Policy Directions. In: Industrial Development for the 21st Century: Sustainable Development Perspectives, Unated Nations, New York, 7-29.
- Galin, D.M. (2007) Statistical Modeling of the Growth of the Economy in Transition (on the Example of Modern Russia). Dissertation for the Degree of Candidate of Economic Sciences, Moscow, 159.
- Bulgakova, L.N. (2013) Estimation of Production Function and Elasticity of Production at the Enterprises and in Branches of Region Taking into Account Production Factors, Innovations and Education. Management of Economic Systems, №1.
- Kudrov, V.M. (2009) World Economy. Yustitsinform, Moscow, 512.
- TRIZ: From the Performers—In the Innovators. Website Karyerist.ru.
http://www.careerist.ru/%D0%A2%D0%A0%D0%98%D0%97_%D0%B8%D0%B7_%D0%B8%D1%
81%D0%BF%D0%BE%D0%BB%D0%BD%D0%B8%D1%82%D0%B5%D0%BB%D0%B5%D0%B9_%
E2%80%93_%D0%B2_%D0%B8%D0%BD%D0%BD%D0%BE%D0%B2%D0%B0%D1%82%D0%BE
%D1%80%D1%8B/article7367?A=313 - Rating Subsidized Regions of Russia. Table.Website
Tayga.Info. 23.01.2014.
http://tayga.info/documents/2007/01/23/~92889 -
Logunov, V.N. (2012) Efficiency of Production Factors in Economy of the Voronezh
Region. Anthology
“Problems of Regional Economy”, V. 44. TSIRE, Center of Research of Regional Economy, Voronezh. - Kolchinskaya, E.E. Using of Production Function as Tool for Formation
of Industrial and External Economic Policy of the Region.
http://www.hse.ru/data/2013/01/14/1302993790/%D0%A1%D1%82%D0%B0%D1%82%D1%8C%
D1%8F%20-%20%D0%BF%D1%80%D0%BE%D0%B8%D0%B7%D0%B2.%20%D1%84%D1%83%
D0%BD%D0%BA.%20%D0%9A%D0%BE%D0%BB%D1%87%D0%B8%D0%BD%D1%81%D0%BA%
D0%B0%D1%8F.pdf - In April, the Power Consumption in the Voronezh Region Exceeded Last Year’s Level by 3.2%. Website. ENERGO-S. http://energo-s.org/news_107.html.03.05.2011
- Power Utilities of the Leningrad Region Took a Course on Consolidation. Website ASNinfo. Agency of Construction News. http://asninfo.ru/se/article/54902. 10.03.2014
NOTES

*LINK: http://www.ou-link.ru/link/