Paper Menu >>
Journal Menu >>
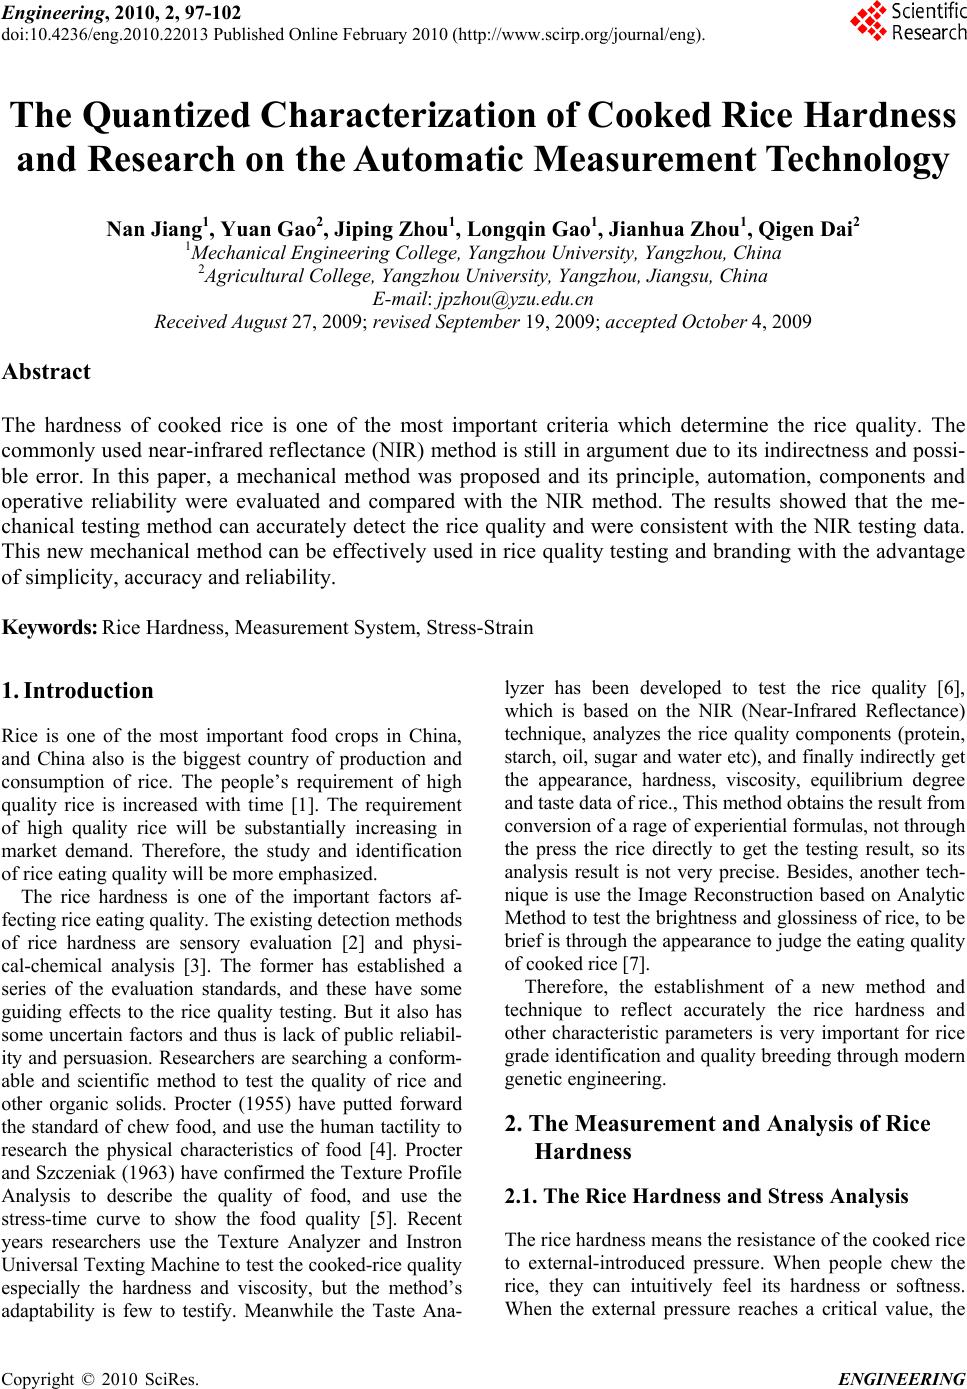 Engineering, 2010, 2, 97-102 doi:10.4236/eng.2010.22013 Published Online February 2010 (http://www.scirp.org/journal/eng). Copyright © 2010 SciRes. ENGINEERING The Quantized Characterization of Cooked Rice Hardness and Research on the Automatic Measurement Technology Nan Jiang1, Yuan Gao2, Jiping Zhou1, Longqin Gao1, Jianhua Zhou1, Qigen Dai2 1Mechanical Engineering College, Yangzhou University, Yangzhou, China 2Agricultural College, Yangzhou University, Yangzhou, Jiangsu, China E-mail: jpzhou@yzu.edu.cn Received August 27, 2009; revised September 19, 2009; accepted October 4, 2009 Abstract The hardness of cooked rice is one of the most important criteria which determine the rice quality. The commonly used near-infrared reflectance (NIR) method is still in argument due to its indirectness and possi- ble error. In this paper, a mechanical method was proposed and its principle, automation, components and operative reliability were evaluated and compared with the NIR method. The results showed that the me- chanical testing method can accurately detect the rice quality and were consistent with the NIR testing data. This new mechanical method can be effectively used in rice quality testing and branding with the advantage of simplicity, accuracy and reliability. Keywords: Rice Hardness, Measurement System, Stress-Strain 1. Introduction Rice is one of the most important food crops in China, and China also is the biggest country of production and consumption of rice. The people’s requirement of high quality rice is increased with time [1]. The requirement of high quality rice will be substantially increasing in market demand. Therefore, the study and identification of rice eating quality will be more emphasized. The rice hardness is one of the important factors af- fecting rice eating quality. The existing detection methods of rice hardness are sensory evaluation [2] and physi- cal-chemical analysis [3]. The former has established a series of the evaluation standards, and these have some guiding effects to the rice quality testing. But it also has some uncertain factors and thus is lack of public reliabil- ity and persuasion. Researchers are searching a conform- able and scientific method to test the quality of rice and other organic solids. Procter (1955) have putted forward the standard of chew food, and use the human tactility to research the physical characteristics of food [4]. Procter and Szczeniak (1963) have confirmed the Texture Profile Analysis to describe the quality of food, and use the stress-time curve to show the food quality [5]. Recent years researchers use the Texture Analyzer and Instron Universal Texting Machine to test the cooked-rice quality especially the hardness and viscosity, but the method’s adaptability is few to testify. Meanwhile the Taste Ana- lyzer has been developed to test the rice quality [6], which is based on the NIR (Near-Infrared Reflectance) technique, analyzes the rice quality components (protein, starch, oil, sugar and water etc), and finally indirectly get the appearance, hardness, viscosity, equilibrium degree and taste data of rice., This method obtains the result from conversion of a rage of experiential formulas, not through the press the rice directly to get the testing result, so its analysis result is not very precise. Besides, another tech- nique is use the Image Reconstruction based on Analytic Method to test the brightness and glossiness of rice, to be brief is through the appearance to judge the eating quality of cooked rice [7]. Therefore, the establishment of a new method and technique to reflect accurately the rice hardness and other characteristic parameters is very important for rice grade identification and quality breeding through modern genetic engineering. 2. The Measurement and Analysis of Rice Hardness 2.1. The Rice Hardness and Stress Analysis The rice hardness means the resistance of the cooked rice to external-introduced pressure. When people chew the rice, they can intuitively feel its hardness or softness. When the external pressure reaches a critical value, the 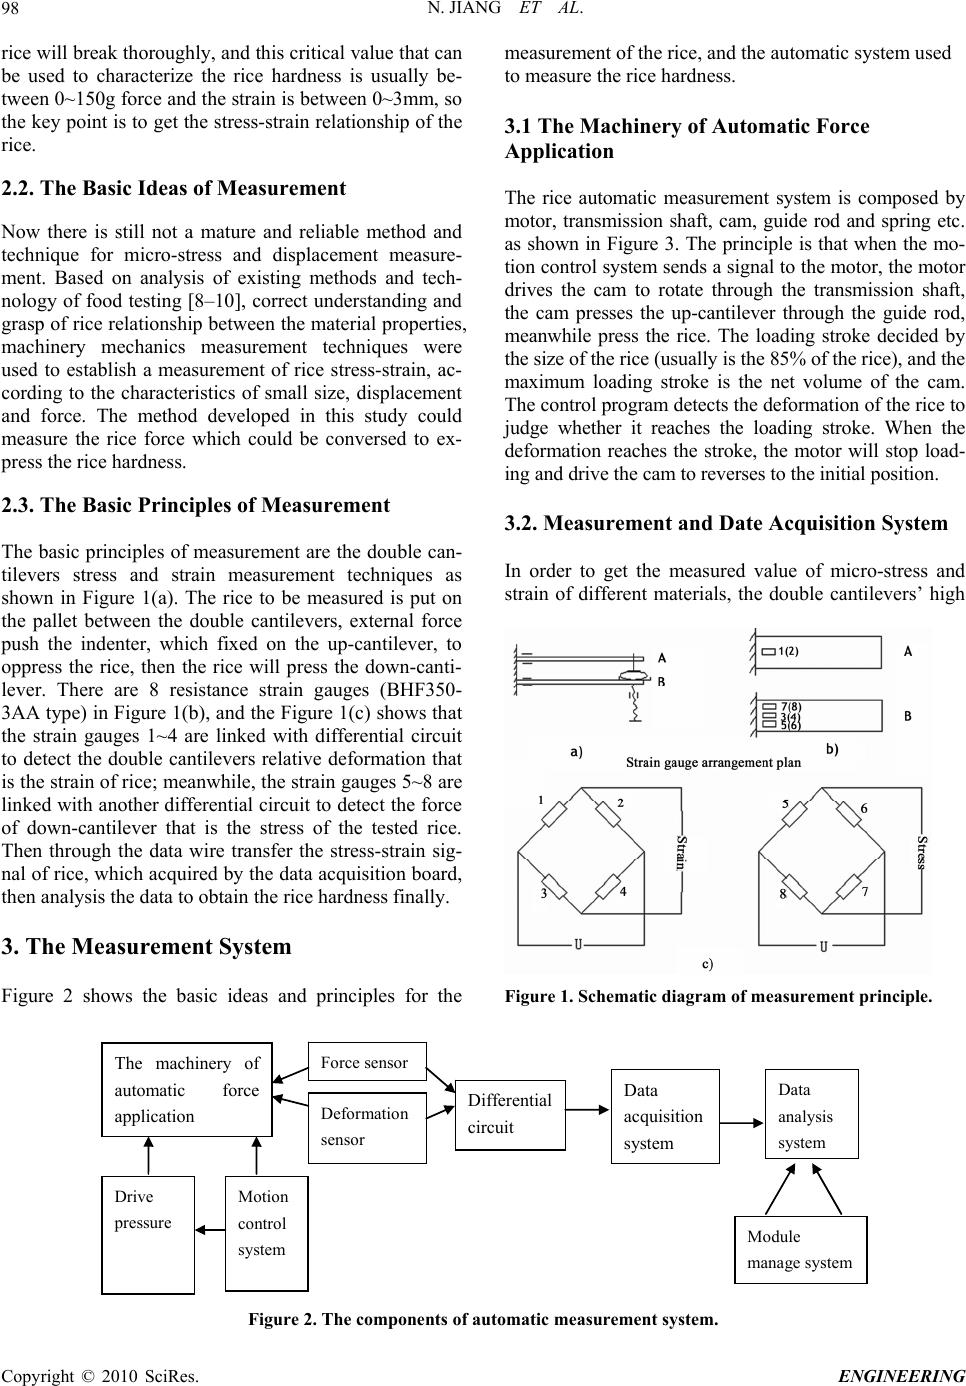 N. JIANG ET AL. Copyright © 2010 SciRes. ENGINEERING 98 rice will break thoroughly, and this critical value that can be used to characterize the rice hardness is usually be- tween 0~150g force and the strain is between 0~3mm, so the key point is to get the stress-strain relationship of the rice. 2.2. The Basic Ideas of Measurement Now there is still not a mature and reliable method and technique for micro-stress and displacement measure- ment. Based on analysis of existing methods and tech- nology of food testing [8–10], correct understanding and grasp of rice relationship between the material properties, machinery mechanics measurement techniques were used to establish a measurement of rice stress-strain, ac- cording to the characteristics of small size, displacement and force. The method developed in this study could measure the rice force which could be conversed to ex- press the rice hardness. 2.3. The Basic Principles of Measurement The basic principles of measurement are the double can- tilevers stress and strain measurement techniques as shown in Figure 1(a). The rice to be measured is put on the pallet between the double cantilevers, external force push the indenter, which fixed on the up-cantilever, to oppress the rice, then the rice will press the down-canti- lever. There are 8 resistance strain gauges (BHF350- 3AA type) in Figure 1(b), and the Figure 1(c) shows that the strain gauges 1~4 are linked with differential circuit to detect the double cantilevers relative deformation that is the strain of rice; meanwhile, the strain gauges 5~8 are linked with another differential circuit to detect the force of down-cantilever that is the stress of the tested rice. Then through the data wire transfer the stress-strain sig- nal of rice, which acquired by the data acquisition board, then analysis the data to obtain the rice hardness finally. 3. The Measurement System Figure 2 shows the basic ideas and principles for the measurement of the rice, and the automatic system used to measure the rice hardness. 3.1 The Machinery of Automatic Force Application The rice automatic measurement system is composed by motor, transmission shaft, cam, guide rod and spring etc. as shown in Figure 3. The principle is that when the mo- tion control system sends a signal to the motor, the motor drives the cam to rotate through the transmission shaft, the cam presses the up-cantilever through the guide rod, meanwhile press the rice. The loading stroke decided by the size of the rice (usually is the 85% of the rice), and the maximum loading stroke is the net volume of the cam. The control program detects the deformation of the rice to judge whether it reaches the loading stroke. When the deformation reaches the stroke, the motor will stop load- ing and drive the cam to reverses to the initial position. 3.2. Measurement and Date Acquisition System In order to get the measured value of micro-stress and strain of different materials, the double cantilevers’ high Figure 1. Schematic diagram of measurement principle. Drive pressure The machinery of automatic force application Motion control system Force sensor Deformation sensor Differential circuit Data acquisition system Data analysis s y ste m Module manage system Figure 2. The components of automatic measurement system. 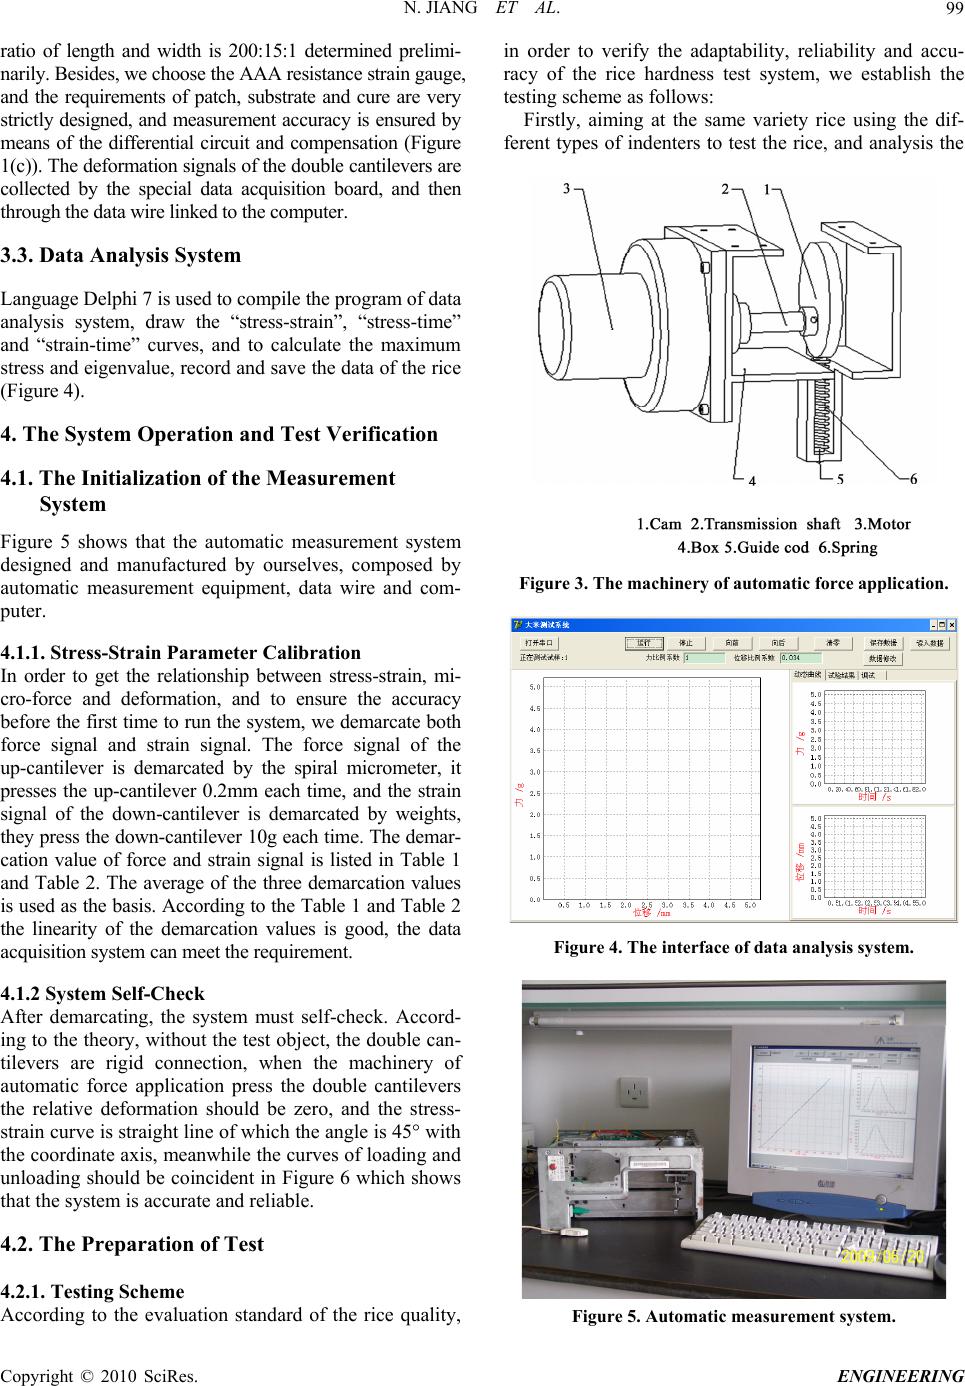 N. JIANG ET AL.99 ratio of length and width is 200:15:1 determined prelimi- narily. Besides, we choose the AAA resistance strain gauge, and the requirements of patch, substrate and cure are very strictly designed, and measurement accuracy is ensured by means of the differential circuit and compensation (Figure 1(c)). The deformation signals of the double cantilevers are collected by the special data acquisition board, and then through the data wire linked to the computer. 3.3. Data Analysis System Language Delphi 7 is used to compile the program of data analysis system, draw the “stress-strain”, “stress-time” and “strain-time” curves, and to calculate the maximum stress and eigenvalue, record and save the data of the rice (Figure 4). 4. The System Operation and Test Verification 4.1. The Initialization of the Measurement System Figure 5 shows that the automatic measurement system designed and manufactured by ourselves, composed by automatic measurement equipment, data wire and com- puter. 4.1.1. Stress-Strain Parameter Calibration In order to get the relationship between stress-strain, mi- cro-force and deformation, and to ensure the accuracy before the first time to run the system, we demarcate both force signal and strain signal. The force signal of the up-cantilever is demarcated by the spiral micrometer, it presses the up-cantilever 0.2mm each time, and the strain signal of the down-cantilever is demarcated by weights, they press the down-cantilever 10g each time. The demar- cation value of force and strain signal is listed in Table 1 and Table 2. The average of the three demarcation values is used as the basis. According to the Table 1 and Table 2 the linearity of the demarcation values is good, the data acquisition system can meet the requirement. 4.1.2 System Self-Check After demarcating, the system must self-check. Accord- ing to the theory, without the test object, the double can- tilevers are rigid connection, when the machinery of automatic force application press the double cantilevers the relative deformation should be zero, and the stress- strain curve is straight line of which the angle is 45° with the coordinate axis, meanwhile the curves of loading and unloading should be coincident in Figure 6 which shows that the system is accurate and reliable. 4.2. The Preparation of Test 4.2.1. Testing Scheme According to the evaluation standard of the rice quality, in order to verify the adaptability, reliability and accu- racy of the rice hardness test system, we establish the testing scheme as follows: Firstly, aiming at the same variety rice using the dif- ferent types of indenters to test the rice, and analysis the Figure 3. The machinery of automatic force application. Figure 4. The interface of data analysis system. Figure 5. Automatic measurement system. Copyright © 2010 SciRes. ENGINEERING 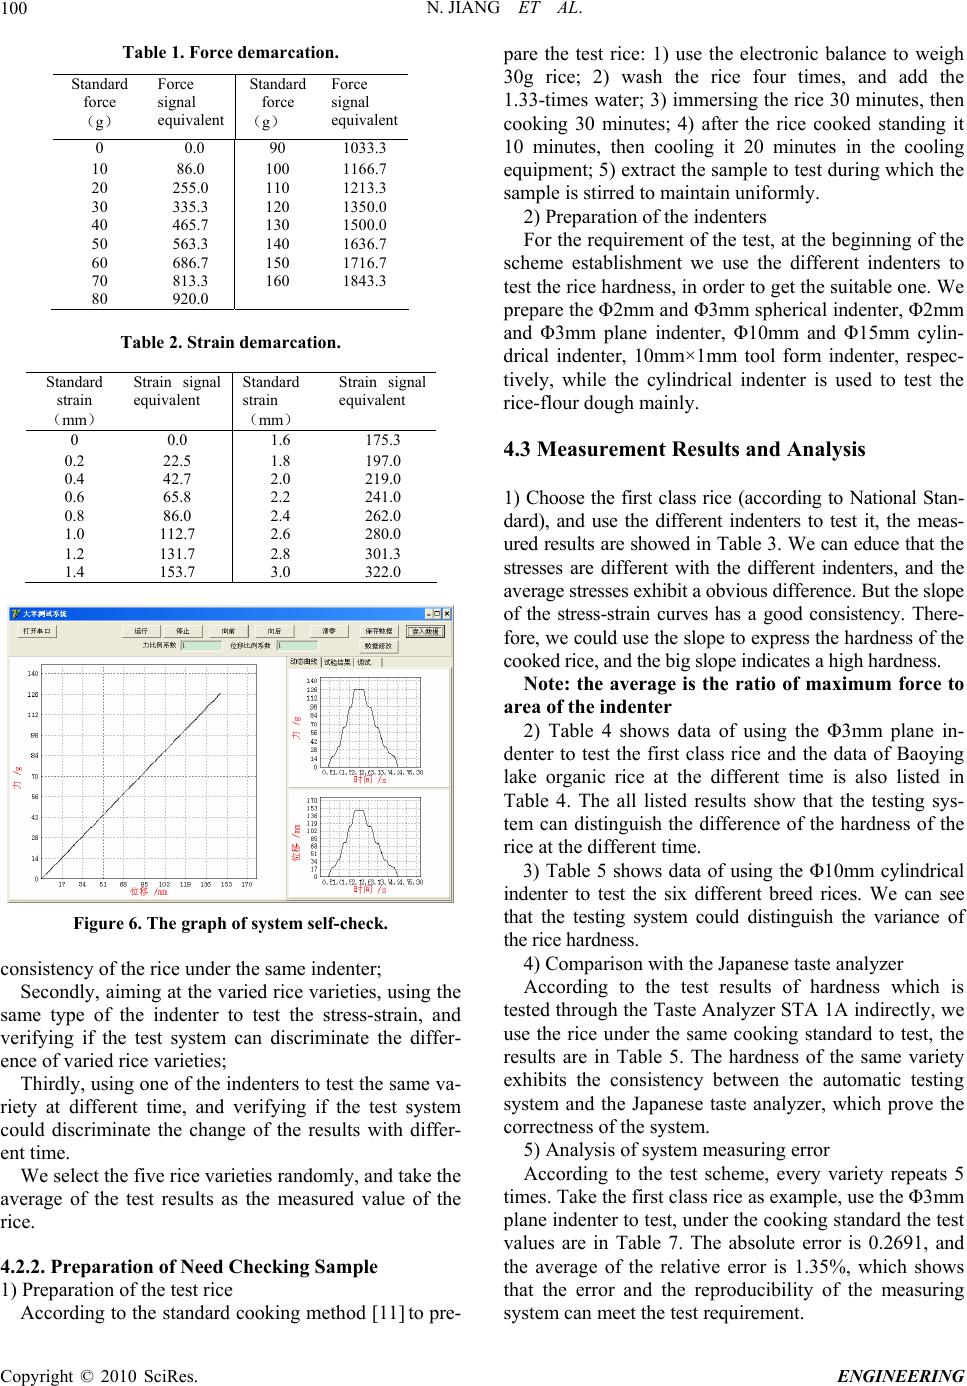 N. JIANG ET AL. Copyright © 2010 SciRes. ENGINEERING 100 Table 1. Force demarcation. Table 2. Strain demarcation. Figure 6. The graph of system self-check. consistency of the rice under the same indenter; Secondly, aiming at the varied rice varieties, using the same type of the indenter to test the stress-strain, and verifying if the test system can discriminate the differ- ence of varied rice varieties; Thirdly, using one of the indenters to test the same va- riety at different time, and verifying if the test system could discriminate the change of the results with differ- ent time. We select the five rice varieties randomly, and take the average of the test results as the measured value of the rice. 4.2.2. Preparation of Need Checking Sample 1) Preparation of the test rice According to the standard cooking method [11] to pre- pare the test rice: 1) use the electronic balance to weigh 30g rice; 2) wash the rice four times, and add the 1.33-times water; 3) immersing the rice 30 minutes, then cooking 30 minutes; 4) after the rice cooked standing it 10 minutes, then cooling it 20 minutes in the cooling equipment; 5) extract the sample to test during which the sample is stirred to maintain uniformly. Standard force (g) Force signal equivalent Standard force (g) Force signal equivalent 0 0.0 90 1033.3 10 86.0 100 1166.7 20 255.0 110 1213.3 30 335.3 120 1350.0 40 465.7 130 1500.0 50 563.3 140 1636.7 60 686.7 150 1716.7 70 813.3 160 1843.3 80 920.0 2) Preparation of the indenters For the requirement of the test, at the beginning of the scheme establishment we use the different indenters to test the rice hardness, in order to get the suitable one. We prepare the Φ2mm and Φ3mm spherical indenter, Φ2mm and Φ3mm plane indenter, Φ10mm and Φ15mm cylin- drical indenter, 10mm×1mm tool form indenter, respec- tively, while the cylindrical indenter is used to test the rice-flour dough mainly. Standard strain (mm) Strain signal equivalent Standard strain (mm) Strain signal equivalent 0 0.0 1.6 175.3 0.2 22.5 1.8 197.0 0.4 42.7 2.0 219.0 0.6 65.8 2.2 241.0 0.8 86.0 2.4 262.0 1.0 112.7 2.6 280.0 1.2 131.7 2.8 301.3 1.4 153.7 3.0 322.0 4.3 Measurement Results and Analysis 1) Choose the first class rice (according to National Stan- dard), and use the different indenters to test it, the meas- ured results are showed in Table 3. We can educe that the stresses are different with the different indenters, and the average stresses exhibit a obvious difference. But the slope of the stress-strain curves has a good consistency. There- fore, we could use the slope to express the hardness of the cooked rice, and the big slope indicates a high hardness. Note: the average is the ratio of maximum force to area of the indenter 2) Table 4 shows data of using the Φ3mm plane in- denter to test the first class rice and the data of Baoying lake organic rice at the different time is also listed in Table 4. The all listed results show that the testing sys- tem can distinguish the difference of the hardness of the rice at the different time. 3) Table 5 shows data of using the Φ10mm cylindrical indenter to test the six different breed rices. We can see that the testing system could distinguish the variance of the rice hardness. 4) Comparison with the Japanese taste analyzer According to the test results of hardness which is tested through the Taste Analyzer STA 1A indirectly, we use the rice under the same cooking standard to test, the results are in Table 5. The hardness of the same variety exhibits the consistency between the automatic testing system and the Japanese taste analyzer, which prove the correctness of the system. 5) Analysis of system measuring error According to the test scheme, every variety repeats 5 times. Take the first class rice as example, use the Φ3mm plane indenter to test, under the cooking standard the test values are in Table 7. The absolute error is 0.2691, and the average of the relative error is 1.35%, which shows that the error and the reproducibility of the measuring system can meet the test requirement. 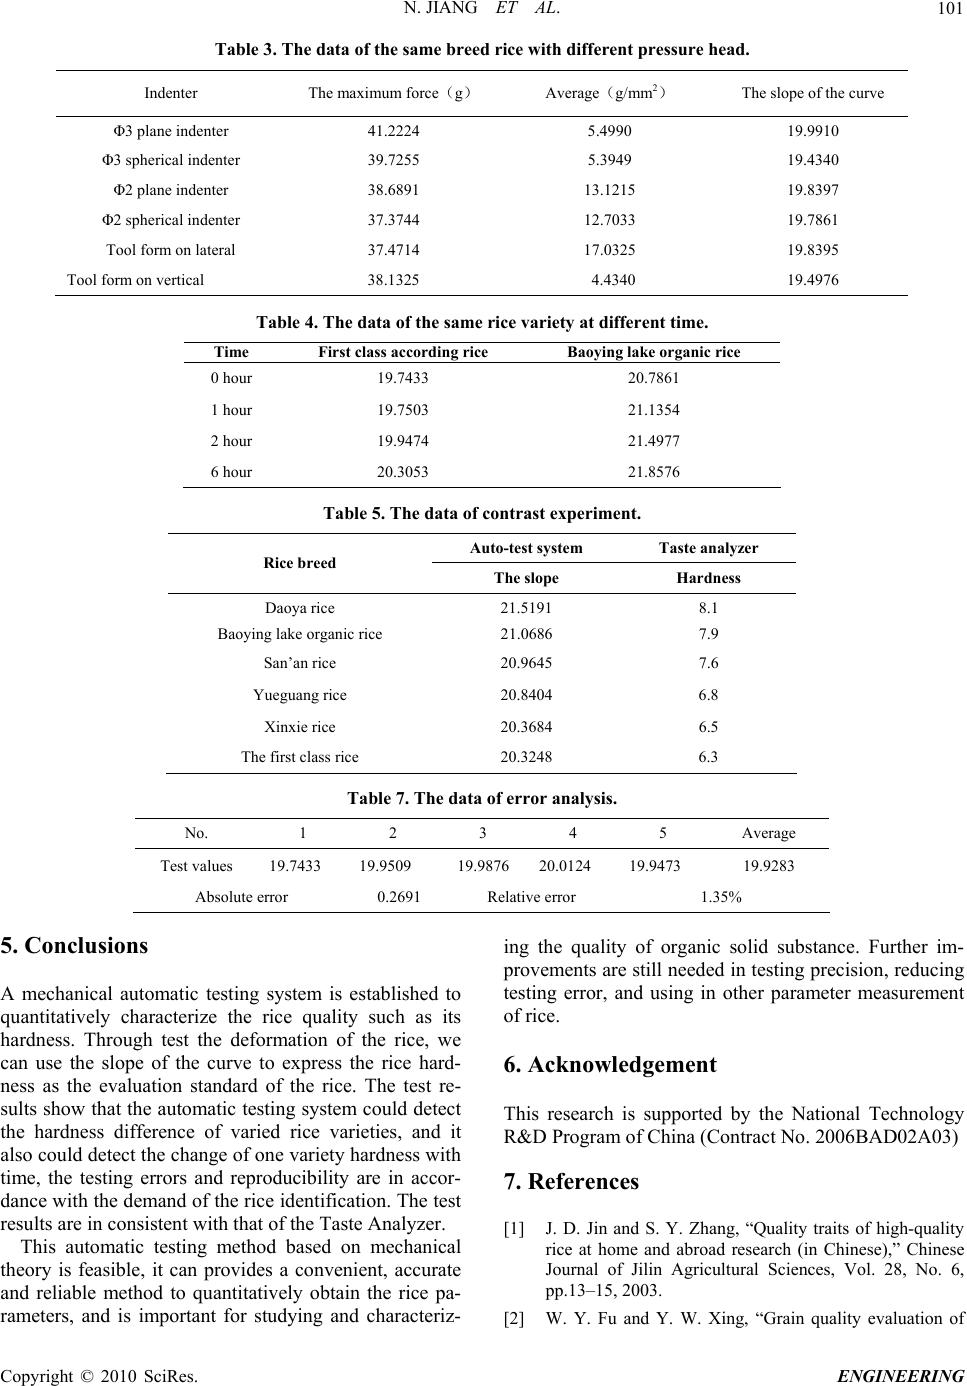 N. JIANG ET AL.101 Table 3. The data of the same breed rice with different pressure head. Table 4. The data of the same rice variety at different time. Time First class according rice Baoying lake organic rice 0 hour 19.7433 20.7861 1 hour 19.7503 21.1354 2 hour 19.9474 21.4977 6 hour 20.3053 21.8576 Table 5. The data of contrast experiment. Auto-test system Taste analyzer Rice breed The slope Hardness Daoya rice 21.5191 8.1 Baoying lake organic rice 21.0686 7.9 San’an rice 20.9645 7.6 Yueguang rice 20.8404 6.8 Xinxie rice 20.3684 6.5 The first class rice 20.3248 6.3 Table 7. The data of error analysis. No. 1 2 3 4 5 Average Test values 19.7433 19.9509 19.9876 20.0124 19.9473 19.9283 Absolute error 0.2691 Relative error 1.35% 5. Conclusions A mechanical automatic testing system is established to quantitatively characterize the rice quality such as its hardness. Through test the deformation of the rice, we can use the slope of the curve to express the rice hard- ness as the evaluation standard of the rice. The test re- sults show that the automatic testing system could detect the hardness difference of varied rice varieties, and it also could detect the change of one variety hardness with time, the testing errors and reproducibility are in accor- dance with the demand of the rice identification. The test results are in consistent with that of the Taste Analyzer. This automatic testing method based on mechanical theory is feasible, it can provides a convenient, accurate and reliable method to quantitatively obtain the rice pa- rameters, and is important for studying and characteriz- ing the quality of organic solid substance. Further im- provements are still needed in testing precision, reducing testing error, and using in other parameter measurement of rice. 6. Acknowledgement This research is supported by the National Technology R&D Program of China (Contract No. 2006BAD02A03) 7 . References [1] J. D. Jin and S. Y. Zhang, “Quality traits of high-quality rice at home and abroad research (in Chinese),” Chinese Journal of Jilin Agricultural Sciences, Vol. 28, No. 6, pp.13–15, 2003. [2] W. Y. Fu and Y. W. Xing, “Grain quality evaluation of Indenter The maximum force(g) Average(g/mm2) The slope of the curve Φ3 plane indenter 41.2224 5.4990 19.9910 Φ3 spherical indenter 39.7255 5.3949 19.4340 Φ2 plane indenter 38.6891 13.1215 19.8397 Φ2 spherical indenter 37.3744 12.7033 19.7861 Tool form on lateral 37.4714 17.0325 19.8395 Tool form on vertical 38.1325 4.4340 19.4976 Copyright © 2010 SciRes. ENGINEERING  N. JIANG ET AL. Copyright © 2010 SciRes. ENGINEERING 102 current situation and prospect (in Chinese),” Chinese Journal of Natural Science Journal of Hainan University, Vol. 14, No. 3, pp. 269~271, September 1996. [3] X. M. Zhang, Y. C. Wang etc, “Rice taste evaluation of the progress (in Chinese),” Chinese Journal of Seed, Vol. 1, pp. 52–53, 2002. [4] B. E. Procter, “Instrement evaluation and initial test,” Chinese Journal of Food Technology, Vol. 9, pp. 417– 441, 1955. [5] A. S. “Szczeniak objective measurements of food tex- ture,” Chinese Journal of Food Science, Vol. 28, pp. 420–441, 1963. [6] X. M. Zhan, T. S. Zheng, and J. H. Tao, “Study on appli- cation of texture analyzer in quality evaluation of ric (in Chinese),” Chinese Journal of Food Science, Vol. 28, No. 9, pp. 62–65. 2007. [7] A. H. Cheng, X. H. Li, X. M. Yao etc, “Study on the correlation between image analysis properties and rice sensory evaluation of japonica rice in northeast china (in Chinese),” Chinese Journal of Grain and Oil Food, Vol. 14, No. 4, pp. 25–27, 2006. [8] X. F. Guo and Y. D. Mu, “Evaluation of a method for determining texture characteristics of cooked rice (in Chinese),” Chinese Journal, Journal of the Chinese cere- als and oils association, Vol. 4, No. 21, pp. 9–11, 2006. [9] Y. Lan, O. R. Kunze, “Fissure resistance of rice varie- ties,” Chinese Journal Applied Engineering in Agriculture, Vol. 12, No. 3, pp. 365–368, 1996. [10] Y. Lan and O. R. Kunze, “Fissure characteristics related to moisture adsorption stresses in rice,” Chinese Journal Transactions of the ASAE, Vol. 39, No. 6, pp. 2168– 2174, 1996. [11] “People's Republic of China national standard quality assessment tests of rice cooking,” GB/T 15682, 1995. |