Modern Economy
Vol.06 No.12(2015), Article ID:62359,18 pages
10.4236/me.2015.612124
The Impact of Introducing Mandatory Occupational Licensing
Miana Plesca
Department of Economics, University of Guelph, Guelph, Canada

Copyright © 2015 by author and Scientific Research Publishing Inc.
This work is licensed under the Creative Commons Attribution International License (CC BY).
http://creativecommons.org/licenses/by/4.0/


Received 24 August 2015; accepted 24 December 2015; published 29 December 2015
ABSTRACT
Licensing imposes barriers to entry in an occupation, effectively restricting the supply of licensed workers in the occupation, and driving prices up. We evaluate the effects of introducing mandatory licensing in all construction trades in a Canadian province, Ontario. Evidence based on vacancies and wage premia suggests the construction trades are in short supply in Ontario. We estimate the deadweight loss for Ontario’s construction industry resulting from higher prices and decreased construction output. Using an elasticity of labour demand of 31%, we obtain a deadweight loss ranging between $19 million and $75 million, depending on projected wage increases ranging between 10% and 20%. We ignore here potential benefits resulting from the increased human capital of construction workers.
Keywords:
Occupation Licensing, Occupation Shortage, Deadweight Loss

1. Introduction
When mandatory licensing is introduced for an occupation, the rationale is typically related to increased quality in that occupation’s output. In practice, occupation licensing is implemented at the initiative and under the administration of the current association of workers in that occupation. Licensing imposes barriers to entry in that occupation, effectively restricting the supply of licensed workers in the occupation, driving their wages up. This in turn increases the price of the final good or service produced in that occupation.
We will show first the theoretical channels through which occupation licensing affects workers, consumers, employers and the economy, and also empirical evidence from the literature regarding the magnitude of those effects. The theoretical implications are evaluated in the case of Ontario, a Canadian province where the government is contemplating to introduce mandatory licensing for all construction occupations.
The paper is organized as follows. Section 2 provides a general analysis on occupational licensing and its impact on consumers, workers, firms, and the economy. We discuss both theoretical channels and empirical evidence of their magnitude. Section 3 provides evidence of the skills shortage in Ontario, and Section 4 details the computation of the deadweight loss resulting from restricting construction inputs through licensing. Section 5 makes a conclusion.
2. Costs and Benefits of Occupational Licensing Ease of Use
We document the costs and benefits of occupational licensing for customers, for the workers getting licensed, for firms and industries, and for the economy as a whole. Note that there is a timing issue involved: following the decision to introduce mandatory licensing in an occupation, it may take a while until new workers get trained and licensed, while existing workers are typically grandfathered into the licensed occupation. It has been documented that wages increase “once and for all” for workers who are grandfathered into a newly implemented occupational licensing system (Perloff, 1980 [1] ).
2.1. Costs and Benefits for Consumers
The best known effect of occupational licensing is that it restricts the number of workers in a given occupation, leading to increased wages for the workers. In turn, the higher labour costs is passed on to the consumer through a higher price of the good or service (Rottenberg, 1980 [2] ). An alternative channel is proposed by Kleiner and Kurdle (2000) [3] , who suggest that occupational licensing can lead to quality improvements resulting in increased demand for the product or service, which would also increases prices. In any case, there is substantive evidence that occupational licensing leads to increased prices for consumers (Perloff, 1980 [1] ; Carroll and Gaston, 1983 [4] ; Kleiner and Kurdle, 2000 [3] ; Adams et al., 2002 [5] ; Kleiner, 2000 [6] , 2006 [7] ) including empirical analysis performed specifically in the building industry in New Zealand (Lobo and Wilkinson, 2006 [8] ).
The benefits for consumers from occupational licensing can be twofold: (i) a reduction in consumer uncertainty regarding the quality of a product or service, and (ii) an increase in the quality of the good or service itself. The uncertainty about quality refers to a scenario where the buyer (i.e. the consumer) cannot distinguish between a high quality good or service and a low quality one, while the seller knows it. This informational asymmetry problem was first identified by Akerloff (1970) [9] in his famous “lemons model” of the used car market. Arrow (1971) [10] and Kleiner, 2000 [6] , among others, document that certification from third parties, in the form of occupational licensing, provides a means by which consumers can be assured of the quality of the product or service. Carroll and Gaston (1983) [4] and Kleiner and Gittleman (2013) [11] argue that occupational licensing screens out less skilled or competent workers who may produce a low quality good or service, thereby increasing the average quality of the good or service in that market. The second point, that licensing increases product quality, is emphasized via the increased training and human capital channel. Kleiner (2000) [6] documents that better training as a result of occupational licensing increases the quality of the good or service produced, as there is a minimum standard of skill or competency required from the worker. Nevertheless, when examining the effect of occupational licensing on output quality (e.g. for the cosmetology occupation in Carrol and Gaston, 1983 [4] and for dentistry in Kleiner and Kurdle (2000) [3] , there is little statistical evidence to support the improved quality hypothesis.
2.2. Costs and Benefits for Workers
The primary cost of occupational licensing for workers is the financial and opportunity costs of studying for and passing (or failing) an exam (Rottenberg, 1980 [2] ). In addition to restricting access, occupational licensing can reduce the mobility of workers (Pashigian, 1979 [12] ; Kleiner et al., 1982 [13] ) across geographic regions, provinces, states or countries (Tenn, 2001 [14] , Pagliero, 2009 [15] ) or between different industries (Perloff, 1980 [1] ). Occupational licensing has also been found to impede exits out of the welfare system (Dorsey, 1980 [16] ; Hazlett and Fearing, 1998 [17] ).
As discussed above, occupational licensing restricts the number of workers in a given occupation providing rents in the form of increased wages for these workers. The literature on this effect dates as far back as Adam Smith, who, in The Wealth of Nations, wrote about “the ability of crafts to lengthen apprenticeship programs and limit the number of apprentices per master, thereby ensuring higher earnings for persons in these occupations (Adam Smith, as cited in Kleiner, 2006 [7] ). This trend has also been described as a feature of modern economies (Moore, 1961 [18] ; Friedman, 1962 [19] ; Maurizi, 1974 [20] ; Kleiner and Krueger, 2009 [21] ; Pagilero 2010 [15] ). Cross sectional analysis has found that occupational licensing increases wages by approximately 15 percent (Bryson and Kleiner, 2010 [22] ). Moreover, the literature documents that licensing at multiple levels of government increases wages more than licensing at a single level, with the effect being higher for licensing compared to certification (Kleiner, 2006 [7] ).
However, panel data and time series analysis have shown that, while occupational licensing does increase wages, the effect documented in cross-sectional studies may be higher than the true effect of licensing. Due to factors such as the selection of better workers into the training required for licensing (Kleiner, 2006 [7] , Kleiner and Vorotnikov, 2012 [23] ; Timmons and Thorton, 2013 [24] ), cross-sectional studies typically capture an upper bound for the effect of mandatory licensing.
Occupational licensing has been found to increase the incentive for workers to pursue additional training, even if it is not mandated by the licensing body, given that those without training, who may produce a lower- quality product or service, could be barred from the market (Akerloff, 1970 [9] ; Shaprio, 1986 [25] ). Given the increase in human capital and monitoring of standards, in theory we should expect to see improved safety in the more hazardous activities in an occupation, like for instance a reduction in the number of work-related accidents and deaths. The empirical literature has not been able to document improvements in work safety following occupation licensing.
2.3. Costs and Benefits for the Industry and the Firm
The demand for goods and services from licensed workers may either increase or decrease, depending on the nature of the market. Demand may increase as consumers are more certain of the quality of goods or services, which would benefit the industry, but it may also decrease if some consumers demand lower-quality goods or services that are barred after the implementation of occupational licensing (Shapiro, 1986 [25] ). Empirically, occupational licensing has been found to decrease the supply of services, and the access to services (Kleiner and Krueger, 2009 [21] ; Kleiner and Gittleman, 2013 [11] ). In addition, Kleiner, 2006 [7] found that, in a comparison between states where occupations were licensed with those where the same occupations were unlicensed, the occupations in the unlicensed state exhibited a 20 percent faster growth rate.
The literature is lacking empirical analysis on the effects of occupational licensing on firm profits. On the one hand, increased demand or increased output prices would increase profits, whereas on the other hand increased wages for workers would decrease profits for firms. Occupational licensing can give an industry increased control over the supply of workers through manipulating the passing rates on the licensing exam (Maurizi, 1974 [20] ; Freeman and Kleiner 1990 [26] ). Furthermore, occupational associations can have significant political influence over legislation and its administration (Wheelan, 1998 [27] , Stigler, 1971 [28] ). While in theory licensing can result in increased output quality, this has not been documented empirically.
2.4. Welfare Implications: Deadweight Loss
Licensing will restrict entrance into the licensed occupation. The welfare implications are similar to those of a standard monopoly story, where, as wages go up and employment goes down along the labour demand curve, the lost income (welfare loss) can be measured as the triangle area below the demand curve. Income gets reallocated from consumer to licensee through a transfer of higher output price into higher wages.

Like in Kleiner, 2006 [7] , consider the following labour demand curve. Originally the equilibrium is at point A, with E workers employed at the equilibrium wage w. Certification would increase the wage from w to w’. The magnitude of the increase, as documented in the literature, ranges from about 10% or 12%, up to 20%. As a result of the wage increase, employment decreases to E’. The magnitude of the decrease in employment is dictated by the elasticity of the labour demand (which is the inverse of the demand line plotted here). The total wage bill changes from W*E at point A to W’*E’ at point B. As we move from A to B, fewer and fewer workers generate revenue. As we move to the left on the horizontal employment axis, the loss in revenue at each step, for each small change in employment, is given by the little trapeze between the two employment points, with a lower wage to the right and a slightly higher wage to the left. Summing up all these small loses we end up with the triangle ABC as the loss in revenue associated with the wage increase. This area is ΔE * ΔW/2 = (E′ − E) * (W′ − W)/2. Denote the elasticity of demand by ε where ε = (ΔE/E)/(ΔW/W). Furthermore, if the percentage increase in wages is= ΔW/W, then the deadweight loss as a function of current wage bill W*E can be computed as .
.
The magnitude of the output (deadweight) loss can be computed if one knows, or can estimate, the elasticity of labor demand. Kleiner (2006) gives the following example. Assuming a wage increase of 10% as a result of introducing licensing (the low end of the 10% to 15% estimate), and assuming that the licensing applies to 20% of the workforce, this gives a 0.10 × 0.20 = 2% increase in the total wage bill for the overall economy relative to a non-licensed market. He gives the example of the U.S. where the total wage income is 5.3trillion, therefore in the increase in the total wage bill is 0.02 × 5800 billion = 116 billion. Assuming further a wage elasticity of demand of 0.3, the wage bill loss due to the employment change alone would be 116 × 0.3 = 34.8 billion, which would lead to a deadweight loss of half of 2% × 34.8 billion = 348 million overall for the economy. A similar calculation for Ontario is performed later on in this report. While the annual loss for the Construction sector depends on the values assumed for the labour demand elasticity and for the wage increase brought up by certification, the deadweight loss for Ontario due to mandating trade certification would amount to somewhere around 60 to 70 million per year.
Another potential downside in the context of the construction industry, which we have not found mentioned in the literature, is that legitimate construction activity may migrate to the black market to avoid paying the increased cost. While there is plenty of anecdotal evidence on construction and the black market, we do not know of any academic evidence to this effect; more research in this area would be welcome.
There are also benefits to the society associated with licensing, such as the increased quality of the product or the emergence of standardization. In theory, this could help minimize consumer loss and reduce exposure to risk. While these are theoretical channels for which we do not provide empirical evidence, we wanted to mention them here because, in theory, certification could lead to gains through the risk reduction channel. Even though we do not measure it, we should still be aware of this positive effect of certification.
3. The Skilled Trades Gap in Ontario
3.1. Skill Shortage and Under-Investment in Training and Market Failure
Employers and public opinion seem confident there is a shortage of skilled labour in Canada, yet economists tend to disagree. Overall, at the macroeconomic level, all available evidence, which we summarize in the next subsection, seems to point out the contrary, that there is no shortage of skill.
One puzzling issue in this context refers to training. If indeed skills are not available to be hired in the labour market, then why don’t employers train those workers who are available? One reason for low training levels is that access to training is controlled by industry associations and unions. Apprenticeship positions are kept in short supply because of mandatory ratios, e.g. 3 journeymen to 1 apprentice. This pushes smaller companies out of the game.
Employers may not want to train workers for fear that the trained workers will get poached by a competitor, after they have invested in training. This is only possible if the human capital acquired by training is, to a large extent, general rather than firm-specific, implying that skills are somewhat transferable. This is one of the main arguments justifying direct government intervention in training, the other one being that employers would cherry-pick the best workers for training, leaving the disadvantaged workers with no training options. This is also one of the main theoretical arguments in favour of mandating occupational training and licensing.
One remaining question is why the workers themselves do not decide to get extra training at their own cost. The answer to this question is the same one that justifies the need for occupational licensing, as it relates to market failure. If expected skilled wages are high enough, workers will have an incentive to get trained and become licensed on their own accord. Besides the monetary cost of tuition, training would also involve significant wage loss during training, when time is devoted away from production in favour of skill acquisition. If workers do not have access to credit markets to finance training, or if they discount the future too much, workers will also under-invest in training.
A few other explanations can help bridge the apparent disconnect between evidence and public opinion. For instance, it is possible that employers have unrealistic expectations about the types of workers they can attract; or, if governments agree that there are labor shortages, this can be used to justify policies that reduce businesses’ labor costs.
3.2. Aggregate Skills Gap in Canada
To be able to document skill shortages, we need data from both sides of the labour market, the worker and the firm. On the worker side, a gap in the availability of skill should result in increased wages for the skilled labour, and yet we do not see any evidence of that in the data. “The fact that some of the most highly demanded occupations in the job market―chief among them trades, technicians and many professional groups―have not recorded above-average wage increases is at odds with the perception that there is a large-scale skills mismatch in Canada’s labour market. More research in Canada is required to better understand the underlying dynamics at play between current (and future) labour supply and demand. […]” (Derek Burleton, TD Vice President and Deputy Chief Economist, 2013 [29] ).
Another reason for the discrepancy between the views of employers and politicians and what the evidence suggests could be that we simply do not have good enough evidence regarding unfilled positions. While it is true that the wages of under-supplied skills should go up, this is an equilibrium outcome, and it is not very informative regarding the vacancy side: how long does it take for employers to fill a vacancy? Do vacancies stay posted a long time? How many applicants are there for each vacancy? We do not have information on most of these issues. Statistics Canada has been collecting some data until now, but they will only release aggregates over a few very broadly defined industries or regions.
The evidence summarized below, together with what is reported by other sources [29] - [32] , indicates that, while we cannot identify an aggregate skill shortage country-wide, we may be able to identify localized shortages across certain occupations and geographical locations. It does seem to be the case that the construction industry and the skilled trade occupations could be facing an increased demand, although wages have not gone up as expected in those occupations. There also seems to be a geographic shortage in some trades occupations, with Alberta and Saskatchewan being the two provinces with the most stringent needs in terms of the demand for skilled trades.
3.3. Shortages in Ontario Trades: Confirmed by Vacancy Data
In Figure 1 and Figure 2 we report our calculations from Statistics Canada’s Job Vacancy Statistics data, as in


Figure 1. Labour demand.

 (a)
(a)
 (b)
(b)
 (c)
(c)
 (d)
(d)
Figure 2. (a) Vacancies and unemployment, All Industries, Canada; (b) Vacancies and unemployment, Construction, Canada; (c) Vacancies and unemployment, All Industries, by Province; (d) Vacancies and unemployment, Construction, by Province
Plesca and Summerfield, 2014 [33] . These data contain the following aggregate statistics, from 2012 onward, at the industry level and by province: total payroll (filled jobs), vacancies (unfilled jobs), number of vacancies, and number of unemployed. The data are compiled by Statistics Canada from two major sources: the Labour Force Survey (LFS) and the Survey of Employment Payroll and Hours (SEPH) with the monthly Business Payroll Survey instrument.
In Figure 1 we focus on total labour demand, given by the sum of vacancies and unemployment (in thousands). From the first two graphs, labour demand for all industries and for construction, it is apparent that labour demand is increasing slightly in all industries, and even more so in construction, where demand is also strongly seasonal.
In the subsequent plots in Figure 2, we look more carefully into what determines the increase in demand. Wereport vacancies and unemployment figures (in thousands) and two measures of vacancy rates: vacancies as percentage of unemployed, and vacancies as percentage of labour demand. For the economy overall, it seems that the growth is driven only by growth in employment. Overall, for all industries together, there appears to be no growth in the number of vacancies or in the rate of vacancies, while for construction the vacancies show an increasing trend.
Continuing with this analysis by province, it is more difficult to interpret the results because of no data availability over certain periods of time or across provinces. For those provinces where some data is available, the conclusion seems to hold: vacancies do not increase or even decline over all industries, but they increase in construction; employment increases over all industries.
This conclusion is confirmed by other studies. “Construction-related trades in particular posted double-digit increases in their shares since the late 1990s and now account for almost 5% of total Canadian employment” (TD Report, 2013 [29] ). “Among the industries that posted employment gains (see Figure 3) the construction sector took first place as the biggest job generator in percentage terms. In addition, its outperformance was recorded both prior to the recession and the ensuing recovery. The latter development is unusual as construction is typically slow to rebound from a downturn, but a possible explanation could lie in the fact that government stimulus packages included renovation and housing measures. Robust housing markets, and more recently, a pick-up in commercial real estate activity have lit the fire under sectoral employment demand.” (TD Report, 2013 [31] ). Figure 3 in their report, reproduced here, confirms the increase in construction vacancies relative to the other industries.
The long-run trend in occupational shortages is less clear. The CIBC report (CIBC, 2013 [30] ) classifies occupations into those experiencing a skill shortage and those not based on two criteria: rapidly increasing wages and decreasing or low unemployment. According to this classification, the report identifies 25 occupations facing a skill shortage and 20 not facing a skill shortage. We reproduce here their classification in Table 1 and Table 2, noting that trades is part of neither group. Moreover, Employment and Social Development Canada (ESDC) runs a model called Canadian Occupational Projection System (COPS). According to their projections for 2011-2020, Skilled Trades will become an occupation where the supply of skill exceeds the demand. We should always take these projections with a grain of salt, as it is very difficult for a forecaster to predict the trend in macroeconomics variables ? what has happened recently to the price of oil making an excellent case for the

Figure 3. In TD Economics: Jobs in Canada. Job vacancy rate in skilled trades.

Table 1. In CIBC “In Focus” Report, December 2012.
Table 2. In CIBC “In Focus” Report, December 2012.
difficulties associated with reliable forecasting. Likewise, we hear economists periodically predicting a correction in the Ontario housing market, but there is still no sign of that happening yet.
3.4. Shortages in Ontario Trades: Confirmed by Wage Data
3.4.1. Evidence from the Labour Force Survey
We report here results from analyzing data from the 2013 Labour Force Survey. We focus on hourly wages in four trade-related occupations. According to the National Occupational Classification (NOC) codes, we consider the following two-digit occupation codes: 18 “Contractors”, 19 “Trades in Construction”, 20 “Other Trades”, and 22 “Helpers in Trades”.
Table 3 reports average hourly wages in these four occupations. If there is a shortage in skilled trades, we should see higher wages in these occupations. There is some evidence that wages of trade workers in Alberta and Saskatchewan are higher than average, which would account for the skilled trades shortage in these two provinces. Alberta’s economy in particular, tied to oil production, has been booming over this period, and anecdotal evidence reports shortages in most sectors, especially in construction and services.
At a first glance, the data seem to indicate that Ontario is lagging behind, with average skilled trades wages trailing below the national average. It would thus seem that certification is actually a welcome idea for Ontario, because the skilled trades wage is lower in Ontario than the average for Canada.
What we do here is run for each month and for each province a wage regression where on the right-hand side we condition on other productivity characteristics, such as education and age, as well as an indicator for the traded occupation. The coefficient on the Trades variable will measure the wage returns to being in a Trades occupation. That is, it measures the wage gap between for two hypothetical, average individuals who are similar in all other respects (same education and age), with the only difference being that one works in Trades, while the other one does not. In Figures 4-7 we plot this coefficient for every month, as a measure of the wage premium
Table 3. Average hourly wages in a few trades occupations.

Figure 4. Wage returns to Constructin trades, in two provinces.
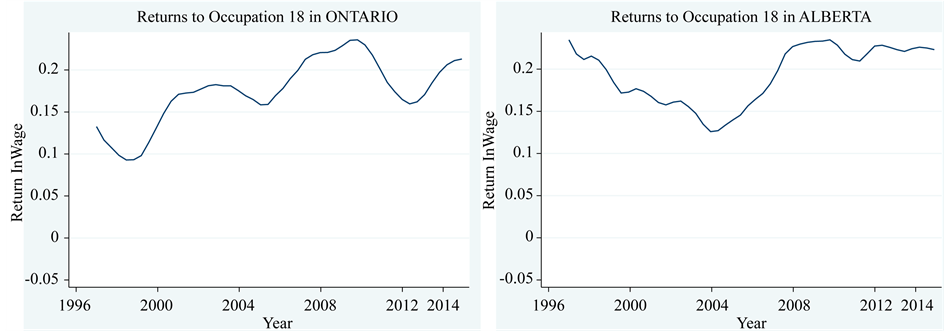
Figure 5. Wage returns to Contractors, in two provinces.

Figure 6. Wage returns to other trades, in two provinces.

Figure 7. Wage returns to helpers in trades, in two provinces.
for being in Trades, all else equal.
In the graphs reported here, we plot the returns to each of the four trade occupations relative to the rest of occupations, separately for two Canadian provinces, Ontario and Alberta. Interestingly ? and perhaps somewhat unexpectedly ? once we control for educational attainment and labour market experience, the returns to Construction Trades (Occupation 19) are high and increasing, even more clearly so in Ontario than Alberta.
In the late 1990s the returns of Construction Trades relative to other occupations were about 10% and they are currently above 15% in Ontario, and around 15% in Alberta. This is further evidence that currently there is demand for Construction Trades, as reflected by their wage premium.
Contractors, Occupation 18, have even higher returns relative to other occupations, more than 20%, and again the trend is increasing, even more clearly so in Ontario than Alberta. Labourers (Occupation 19) have lower returns, but still positive at about 5%, while Other Trades (Occupation 20) have high returns, even higher than 20% and more clearly increasing in Alberta, which makes sense given that these are likely to be workers on the oil patch.
3.4.2. Examples from Census Data
Preliminary exploration of Census Data (2011 National Household Survey) on wages of very detailed occupational codes allows us to investigate the wage patterns for more refined occupations, at the four digit level. We focus here on five trades: carpenters, electricians, pipe-fitters, supervisors, and labourers. Interestingly enough, all trades workers have labour force participation rates much higher than the average: 90% participation rates, compared to about 65% in the population, result which holds even when focusing only on males. Employment rates are also higher for workers in construction trades compared to employment rates for other occupations. Within Ontario, there seems to be a sizeable variation in the incomes of these five trade groups across Census Metropolitan Areas; nevertheless, there is little variation in unemployment rates.
Another interesting observation is that, while carpenters have higher annual incomes than labourers, they have lower hourly wages, because they work more hours per year compared to labourers. We had not expected this hourly wage result, because carpenters are supposed to have more education and skill than labourers. The higher skill of carpenters should command a bigger reward, thus higher hourly wages, when compared to labourers. Continuing with this example for Ontario, pipe-fitters and electricians have incomes above the provincial average, and above the average for most other provinces except for Alberta and to some extent Saskatchewan and British Columbia. These observations do not indicate conclusively nether the presence nor the absence of a shortage of trades in Ontario when looking at very refined occupations; on the whole though, as discussed earlier, construction trades workers seem to be in short relative supply in Ontario.
4. Analysis of the Economic Impact of Licensing Construction Trades
The small literature on licensing building trades reported a few case studies, without going into cost-benefit details (Arkani et al., 2003 [34] ; Davis et al., 2010 [35] ; Skarbek, 2008 [36] ). If Ontario were to proceed with occupation licensing for the trades, it is likely that in the short run not much will happen, as long as existing tradespersons get grandfathered into the licensed occupation. As time goes by, the channels described above may start operating in the following ways: (i) New entrants into construction trades occupations may face licensing costs―direct financial ones and opportunity cost ones―which can be substantive, especially if the licensing is to take place through a long apprenticeship process―creating barriers to entering the occupation; (ii) Wages will increase for existing tradespersons because entry is restricted; iii) Consumers would experience a corresponding price increase as some of the higher labour costs are passed onto them; iv) Output in the industry will decrease as production will shift away from the sector due to the restricted labour input.
To add numerical values to the magnitude of adjustments, we use the formula derived in Section 2.4. For the wage bill, current employment, and wages, we have exact data from the Labour Force Survey 2014. For the Elasticity of Labour Demand and for the projected wage increase due to certification we need to use numbers established elsewhere in the literature: Bruno et al. (2003) [37] , Navaretti et al. (2003) [38] , and Slaughter (2001) [39] . We do a lot of sensitivity analysis by plugging in a wide range of elasticities documented in the literature, and two measures of wage increase resulting from mandatory certification, 10% and 20%, also documented as plausible by the literature.
Table 4(a) gives the main results for the output loss following certification using four values of labour demand elasticities taken from the literature, ranging from 15% to 75%, while Table 4(b) provides sensitivity results for the loss calculation under a wider range of demand elasticities reported in the literature. We further assume certification would result in a wage increase of 10%, a lower bound of what the literature considers as the true wage effect, and we also report results using an upper bound of 20% wage increase.
To illustrate results, we focus on a mid-range labour demand elasticity of 31% - in other words, a one percent
(a)
(b)
(c)
Table 4. (a) Deadweight Loss Due to Mandatory Certification; (b) Deadweight Loss Due to Mandatory Certification. Sensitivity to demand elasticities. Wage increase 10%; (c) Total Wage Bill in Construction, Ontario, 2010 to 2014. Source: Labour Force Survey.
increase in wages would result in a 0.31 percent decline in labour demand. Assuming a 10% increase in wages we compute a deadweight loss from certification of about $18.8 million for Ontario’s construction industry, excluding those Trades that are already certified such as electricians. This deadweight loss has about $4.8 million loss coming from Contractors, $6.9 million from Construction Trades, and $7 million from Helpers in construction (Occupations 18, 19 and 22 in the North-American Occupation Classification System, 2006). If instead we allow for a 20% wage increase following certifications, the loss numbers increase to $75 million overall (excluding Other trades), and $19 million for Contractors and about $28 million each for Construction Trades and for Helpers. These are substantive costs which must be factored in by any government considering the introduction of mandatory licensing. As a reminder, while this deadweight loss from decreased production is a large cost in the analysis of mandatory licensing, we do not quantify here some potential benefits to the society such as those resulting from better educated and skilled workers.
Finally, Table 4(c) shows that the choice of 2014 as the year for our calculation has no impact on the results. From 2010 onward, the wage bill in construction (in nominal dollars) in Ontario has not changed significantly, and therefore the deadweight loss computation would look similar in other years as well.
5. Conclusions
The paper has analyzed the channels at work when a mandatory occupational licensing program is introduced. We have identified both costs and benefits associated with occupation licensing and certifications. The cost is coming from restricting access to the occupation, and the benefit may come from the increased human capital resulting from the mandated training. Furthermore, we have quantified the potential cost in the form of deadweight output loss when the labour input becomes more expensive, with an application to the construction industry in Ontario. While the magnitude of this cost is sensitive to assumptions made about the elasticity of labour demand and about the size of the wage increase following certification, under all plausible scenarios, this deadweight loss is substantive.
The paper also has an immediate policy message, as reported in Dawson Strategic (2014) [40] . Given how strong the Toronto-area housing market continues to be, fuelled by a massive number of immigrants settling here every year, Ontario can ill afford a reduction in construction output. Likewise, as public transit is supposed to go through a huge overhaul including new infrastructure and reconstruction of the old, aging one, the upgrade will require massive involvement from construction trades, which may become more expensive and scarce due to certification. Policy-makers must weigh very carefully in the trade-off between quality improvement in construction and the potential reduction in construction output at a sensitive time.
Future work can look more carefully into a general cost-benefit analysis, done separately for workers, for firms, and for the economy. At the aggregate macro level, the benefits for the society, such as resulting from a better educated workforce in the trade occupations, should also be accounted for. Quantifying these costs and benefits will be complicated by measurements issues. It may be difficult to quantify, for instance, productivity improvements resulting from the better skilled trades, or the increase in consumer demand from improved product quality.
Arguably, a better outcome could be achieved by encouraging volunteer certification, rather than mandatory licensing. Mandating training to all levels of trade people would reduce the quality signal, while decreasing the number of practitioners reduces overall quality of service. Certification could provide the same benefits as licensing in terms of training, except it would be undertaken only by the better workers, allowing more skilled trade workers to differentiate themselves from the less skilled ones both in terms of output quality and in terms of pricing, while avoiding the costs stemming from restricting supply.
Acknowledgements
We are very grateful to Scott Strickland for fantastic research assistance. We thank two anonymous referees who have provided excellent comments and suggestions. This paper is based on work provided for Dawson Strategic for the report “Modernizing Ontario’s Skilled Trades Apprenticeship and Training System Building New Opportunities through Governance and Regulatory Reform”.
Cite this paper
MianaPlesca, (2015) The Impact of Introducing Mandatory Occupational Licensing. Modern Economy,06,1309-1326. doi: 10.4236/me.2015.612124
References
- 1. Perloff, J.M. (1980) The Impact of Licensing Laws on Wage Changes in the Construction Industry. The Journal of Law and Economics, 23, 409-428. http://dx.doi.org/10.1086/466966
- 2. Rottenberg, S., Ed. (1980) Occupational Licensure and Regulation. American Enterprise Institution, Washington.
- 3. Kleiner, M.M. and Kurdle, R.T. (2000) Does Regulation Affect Economic Outcomes? The Case of Dentistry. The Journal of Law and Economics, 43, 547-582. http://dx.doi.org/10.1086/467465
- 4. Carroll, S.L. and Gaston, R.J. (1983) Occupational Licensing and the Quality of Service. Law and Human Behaviour, 7, 139-146. http://dx.doi.org/10.1007/BF01044518
- 5. Adams, A.F., Jackson, J.D. and Ekelund, R.B. (2002) Occupational Licensing in a Competitive Labour Market: The Case of Cosmetology. Journal of Labour Research, 23, 261-278.
http://dx.doi.org/10.1007/s12122-002-1006-6 - 6. Kleiner, M.M. (2000) Occupational Licensing. Journal of Economic Perspectives, 14, 189-202.
http://dx.doi.org/10.1257/jep.14.4.189 - 7. Kleiner, M.M. (2006) Licensing Occupations: Ensuring Quality or Restricting Competition? W.E Upjohn Institute for Employment Research, Kalamazoo. http://dx.doi.org/10.17848/9781429454865
- 8. Lobo, Y. and Wilkinson, S. (2006) The Effects of Occupational Licensing on Skills Needs in the Building Industry: Evidence from New Zealand. The Australian Journal of Construction Economics and Building, 6, 55-63. http://dx.doi.org/10.5130/ajceb.v6i2.2984
- 9. Akerlof, G.A. (1970) The Market for Lemons: Quality Uncertainty and the Market Mechanism. Quarterly Journal of Economics, 84, 488-500. http://dx.doi.org/10.2307/1879431
- 10. Arrow, K. (1971) Essays in the Theory of Risk-Bearing. Markham Publishing Company, Chicago.
- 11. Kleiner, M.M. and Gittleman, M. (2013) Wage Effects of Unionization and Occupational Licensing Coverage in the United States (Working Paper 19061). National Bureau of Economic Research.
- 12. Pashigian, B.P. (1979) Occupational Licensing and the Interstate Mobility of Professionals. The Journal of Law and Economics, 22, 1-25. http://dx.doi.org/10.1086/466931
- 13. Kleiner, M.M., Gay, S. and Greene, K. (1982) Barriers to Labour Migration: The Case of Occupational Licensing. Industrial Relations, 21, 383-391.
- 14. Tenn, S.A. (2001) Three Essays on the Relationship between Migration and Occupational Licensing. University of Chicago Press, Chicago.
- 15. Pagliero, M. (2010) Licensing Exam Difficulty and Entry Salaries in the US Market for Lawyers. British Journal of Industrial Relations, 48, 726-739. http://dx.doi.org/10.1111/j.1467-8543.2010.00810.x
- 16. Dorsey, S. (1980) The Occupational Licensing Queue. The Journal of Human Resources, 15, 424-434. http://dx.doi.org/10.2307/145292
- 17. Hazlett, T.W. and Fearing, J.L. (1998) Occupational Licensing and the Transition from Welfare to Work. Journal of Labour Research, 19, 277-294. http://dx.doi.org/10.1007/s12122-998-1016-0
- 18. Moore, T. (1961) The Purpose of Occupational Licensing. The Journal of Law and Economics, 4, 93-117. http://dx.doi.org/10.1086/466573
- 19. Friedman, M. (1962) Capitalism and Freedom. University of Chicago Press, Chicago.
- 20. Maurizi, A. (1974) Occupational Licensing and the Public Interest. The Journal of Political Economy, 82, 399-413. http://dx.doi.org/10.1086/260199
- 21. Kleiner, M.M. and Krueger, A.B. (2009) Analyzing the Extent and Influence of Occupational Licensing on the Labour Market. Working Paper No. 14979, National Bureau of Economic Research.
- 22. Bryson, A. and Kleiner, M.M. (2010) The Regulation of Occupations. British Journal of Industrial Relations, 48, 670-675. http://dx.doi.org/10.1111/j.1467-8543.2010.00806.x
- 23. Kleiner, M.M. and Vorotnikov, E. (2012) Complementarity and Substitution between Licensed and Unlicensed Occupations: An Analysis of Architects and Interior Designers (Working Paper). University of Minnesota, Minnesota.
- 24. Timmons, E.J. and Thornton, R. (2013) Licensing One of the World’s Oldest Professions: Massage. Journal of Law and Economics, 56, 371-388.
- 25. Shapiro, C. (1986) Investment, Moral Hazard, and Occupational Licensing. Review of Economic Studies, 53, 843-862. http://dx.doi.org/10.2307/2297722
- 26. Freeman, R.B. and Kleiner, M.M. (1990) The Impact of New Unionization on Wages and Working Conditions. Journal of Labour Economics, 8, S8-S25. http://dx.doi.org/10.1086/298243
- 27. Wheelan, C. (1999) Politics or Public Interest? An Empirical Examination of Occupational Licensure (Unpublished Manuscript). University of Chicago Press, Chicago.
- 28. Stigler, G.J. (1971) The Theory of Economic Regulation. The Bell Journal of Economics and Management Science, 2, 3-21. http://dx.doi.org/10.2307/3003160
- 29. Burleton, D. (2013) Special Report: Are Medium-Skilled Jobs in Canada Experiencing a Hollowing Out, U.S.-Style? TD Economics.
- 30. Tal, B. (2012) The Haves and Have Nots of Canada’s Labour Market. CIBC.
- 31. Burleton, D., Gulati, S., McDonald, C. and Scarfone, S. (2013) Jobs in Canada: Where, What and for Whom? TD Economics.
- 32. Curry, B. (2014) Statistics Canada Contradicts Conservative Claims on Unfilled Jobs. The Globe and Mail, 18 March.
- 33. Plesca, M. and Summerfield, F. (2014) Skill Supply, Demand and Mismatch in the Canadian Economy. SHHRC Synthesis Grant Report.
- 34. Arkani, S., Clarke, L. and Michielsens, E. (2003) Regulation for Survival: Training and Skills in the Construction Labour Market in Jersey, Channel Islands. Journal of Vocational Education and Training, 55, 261-280. http://dx.doi.org/10.1080/13636820300200229
- 35. Davis, P.R., Love, P.E.D. and Worrall, D. (2010) Occupational Licensing of Building Trades: Case of Western Australia. Journal of Professional Issues in Engineering Education and Practice, 136, 215-223.
- 36. Skarbek, D. (2008) Occupational Licensing and Asymmetric Information: Post-Hurricane Evidence from Florida. CATO Journal, 28, 73-82.
- 37. Bruno, G.S.F., Falzoni, A.M. and Helg, R. (2003) Occupational Licensing and Asymmetric Information: Post-Hurricane Evidence from Florida. Hamburgisches Welt-Wirtschafts-Archiv (HWWA).
- 38. Navaretti, G.B., Checchi, D. and Turrini, A. (2003) Adjusting Labor Demand: Multinational versus National Firms: A Cross-European Analysis. Journal of the European Economic Association, 1, 708-719.
- 39. Slaughter, M. (2001) International Trade and Labor-Demand Elasticities. Journal of International Economics, 54, 27-56. http://dx.doi.org/10.1016/S0022-1996(00)00057-X
- 40. Dawson Strategic (2014) Modernizing Ontario’s Skilled Trades Apprenticeship and Training System: Building New Opportunities through Governance and Regulatory Reform. Ontario.