Journal of Environmental Protection
Vol.05 No.12(2014), Article ID:50006,22 pages
10.4236/jep.2014.512116
Empirical assessment of coastal environmental vulnerability to sea level rise
Martin Lee Collin*, Abraham J. Melloul
Israel Hydrological Service, Jerusalem, Israel
Email: *marticollin@gmail.com
Copyright © 2014 by authors and Scientific Research Publishing Inc.
This work is licensed under the Creative Commons Attribution International License (CC BY).
http://creativecommons.org/licenses/by/4.0/


Received 7 July 2014; revised 2 August 2014; accepted 25 August 2014
ABSTRACT
Sea level rise (SLR) could critically endanger the environment along all the world’s sea coasts. Although sudden SLRs of meters-high waves that might have apocalyptic results would generally be limited to specific areas, on-going SLR of dozens of cms over decades is likely to have adverse impact on coastal environments throughout the world. This study’s objective is to assess relative regional vulnerability of global sea coasts to SLR. The study focuses upon key natural and anthropogenic parameters that might either cause or enhance SLR and thus significantly influence regional coastal environments. Careful assessment can enable reasonable estimates of relative vulnerability of such environments. An initial step involves specifying key parameters and assigning their weightings and ratings. To demonstrate the feasibility of this approach, six seacoast regions from various parts of the world have been considered in this paper, assessing their natural and anthropogenic parameters vis-à-vis general global data. The results emphasize the relative vulnerability of these areas’ environments to SLR. Recommendations are then made for improving global SLR modeling and monitoring.
Keywords:
Sea Level Rise (SLR), causal and enhancement factors of SLR, impact on coastal environment, sea water intrusion, vulnerability to SLR

1. Introduction
1.1. Definitions of Vulnerability and Usage-Value as Regarding Coastal Regional Resources
“Vulnerability” can be defined as the set of values of physical, chemical, and/or biological parameters of a coastal region’s water and land resources as related to accepted, desired standards for any given category of resource use. Quality and quantity of regional water and land resources suitable for the needs of humans, animals, or plants can vary widely; what would be satisfactory for one purpose may not be for another. Thus, “usage-value” of given water or land resources quality or quantity for a particular category of use would be the worth of a unit quantity of water or land resource of a particular quality to a user in that category [1] -[8] .
1.2. Threats to Coastal Areas by Sea Level Rise
Vulnerability of the natural resources of coastal regions to sea level rise (SLR) can be expressed by two key factors. The first is the present extent or future risk level of regional SLR. The second is the sensitivity of the quality and/or quantity of the region’s water or land resources to natural and/or anthropogenic environmental processes or activities. Natural environmental processes include regional tectonics (plate movement), coastal lithologic and soil properties (density and resistance to wave erosion, permeability, biodegradation, chemical reactions, dispersion, mechanical filtration, neutralization, and volatilization), geomorphology (coastal slope, number of embayments and estuaries, and near offshore bathymetry), and the amount of buffering coastal vegetation. Anthropogenic activities involve intensity and type of coastal land-use alteration, including residential, commercial, industrial, agricultural, or recreational land-use. The summation of these factors for each region enables prioritization of regions as regards vulnerability of their seacoast environment to SLR, enabling the highlighting of those regions having highest SLR, most critical environments, and greatest instability [9] - [15] .
1.3. Lack of Effective Measures for Identifying, Prioritizing, and Planning Mitigation of SLR in Coastal Regions
Sea level rise (SLR) currently poses a significant threat to coastal areas around the world. The risk of considerable loss of coastal resources and land-use potential appears to be growing, for a number of reasons, one of which is global climate change. SLR can occur either gradually or suddenly, but however it occurs and for whatever reasons, in recent years it has been having increased impact upon water resources as well as the integrity of land surfaces in coastal regions.
The most vulnerable coastal water resource is groundwater. Once salinated by intruding sea water, remediation of fresh water aquifers is a lengthy and complex process, effectively preventing drinking water usage of the resource for at least a human generation. Having said that, salinated groundwater can be utilized for irrigating certain crops having low sensitivity to water salinity, such as certain genotypes of tomatoes and peanuts.
Apart from the chemical impact of salinization, rising sea levels modify coastlines and alter coastal vegatation. Geomorphology of estuaries, deltas, and embayments undergo significant modification due to either sudden or gradual SLR. This, in turn, plays a major role in long-term land-use planning and management. Destruction of coastal vegetation—most critically, of wetlands and mangroves, eliminates the constructive buffering capacity of such vegetation, enabling further coastal erosion.
One of the most effective tools to evaluate potential risk of hazards and sensitivities of a coastal region to SLR would be a well-designed program of vulnerability assessment. Vulnerability of coastal regions to environmental instability may be delineated by assessing such characteristics as lithological erodibility, topographic slope, number of estuaries and embayments, and tide and wave dynamics. These are the key parameters that influence natural alteration of coastal regions, and enable prioritization as regards relative sensitivity to erosion, and subsequent creation of a pathway for inland seawater intrusion. Coastal regions having highest vulneralibility would likely suffer most from such apocalyptic events as strong hurricanes or tsunamis—“sudden SLR”. These areas would also be most vulnerable to anthropogenic activities [5] [16] - [18] .
Coastal regions with high natural vulnerability would likewise be more threatened by flooding resulting from natural or anthropogenic activities. Anthropogenic activities can significantly enhance the natural vulnerability of the coastal regions. This impact can lower usage-value for any given category of use within these regions. Vulnerability of sea coast regions, as viewed in this study, could thus be expressed as the sensitivity of the usage-value of its land and water resources to impact by erosion and SLR—whether gradual or sudden [19] .
A key anthropogenic parameter that enhances the impact on coastal regions is population demography, most specifically, urban population. The socio-economic aspects involved include rate of population growth, associated elevation in living standards, and related ecological fingerprints. Presence of industrial facilities can prove a significant factor.
Other anthropogenic activities that can influence and adversely affect sea coast regions are over-exploitation of natural resources, most critically including the deplorable global trend of deforestation and destruction of wetlands and mangroves. Emplacement of such engineering facilities as dams and levees could have a deleterious effect upon coastal regions and their environment by reducing flow of water and sediment into the sea.
It is therefore necessary to closely monitor key land and water resources of coastal regions. Protective long- and short-term regional planning measures must be taken in areas most threatened by either gradual SLR—as could result from global climate change and warming, or sudden SLR—as from the large and intense wave action of hurricanes or tsunamis [20] - [23] .
In order to accurately and comprehensively assess risk to coastal regions owing to SLR, a well-planned mitigation-planning program should be emplaced to delineate, evaluate, and prioritize the key parameters that both cause SLR as well as enhance its effects.
1.4. Objectives of Study
The objectives of this study are to:
· select natural and anthropogenic parameters that could influence the vulnerability of coastal regional environments and lead to their actual or potential instability;
· propose an approach for the weighting and rating of each parameter involved towards determining and assessing natural vulnerability; and
· present a prioritized relative assessment of the vulnerability of selected coastal regions in order to offer a effective delineation of areas on which to focus and develop means for mitigating detrimental impact of SLR.
2. Methodology of Assessment of Coastal Environmental Vulnerability to SLR
This study involves an approach similar to that of the US EPA’s DRASTIC model [5] [24] . The objective is to estimate relative vulnerability to SLR for any specific coastal region. An initial step selects key parameters to assess the stage of SLR, its effect upon the local environment, and the potential degree of enhancement of its regional environmental effect. Key parameters that could cause or mitigate SLR itself, as well as those that could enhance the effects of SLR would be delineated, evaluated, and prioritized. Further steps would assess the vulnerability of selected areas of study by estimating theoretical weightings of the parameter involved, and assessing their actual ratings as related to comprehensive, worst-case global values for each parameter utilized [5] [24] [25] .
2.1. Selection of Parameters for Coastal Environmental Vulnerability Assessment
To model the degree of coastal environmental vulnerability to SLR, a set of key natural and anthropogenic parameters that could either cause or mitigate global SLR should be delineated, evaluated, and prioritized. These same steps should likewise assess all key natural and anthropogenic parameters that could either enhance or mitigate the effect of SLR upon coastal regions.
2.1.1. Parameters That Could cause or mitigate SLR (Table 1)
1) Natural parameters that could cause or mitigate SLR
a) Melting of glaciers, ice caps, and polar sea ice (Mel)
Scientific reports regarding melting of glaciers, icecaps, and polar sea ice are well documented. It has been forecasted that Arctic ice-cover could entirely disappear within the coming 100 years [26] [27] .
Melting is expected to have its greatest SLR effect on marginal areas of glaciers, and would likely have a lesser effect within the polar glaciers and icecaps themselves. The influence of glacial and icecap melting should be lower in regions far from these glaciers and icecaps, but SLR might be still be minimally influenced by such melting. Lowest melting may be attributed to areas around coastal inland seas, owing to the limited influence of continental glaciers upon these watersheds.
It should be clearly understood that a robust trend of on-going melting of polar ice would likely lead to a “positive feed-back loop”. This involves the fact that areas covered by ice are the most effective reflectors of sunlight on the planet, whilst sea water is the best absorber of incoming sunlight. Thus, polar water is warmed. The more ice melted, the warmer the water and the greater the on-going warming and melting of ice. Signifi-

Table 1. Weighting and ratings of study regions as regards parameters that define causal and enhancing factors with regards to global SLR.
SLR study regions: 1. Coastal plain of Israel (ISRw); 2. SW coast of Iceland (ICEsw); 3. SE coast of Australia (AUSse); 4. SW coast of India (INDsw); 5. SE coast of China (CHIse); 6. SE coast of the USA (USAse).
cantly, such climate change would likewise melt the vast Arctic permafrost zones. These areas of frozen vegetation have remained mummified in icy suspension for eons in vast northern regions of Canada and Russia. Once melted, they would return enormous quanties of CO2 and methane (CH4) to the ambient atmosphere, methane being a far, far more efficient green-house gas than CO2. Once global climate change crosses a certain bounding level, it’s quite possible for Earth to endure a fate similar to that experienced by our neighboring planet Venus— viz., uncontrollable global heating involving evaporation of oceans, seas, & lakes, development of permanent cloud-cover, and alteration of Earth into a hot global hell [28] .
The process of climate change clearly indicates that as global warming melts continental and other peripheral polar glaciers, resultant melt-water would add to the volume of water in oceans and seas, as well as lower its salinity and temperature. The contribution of glacial melting would differ from place to place, of course. In the US, between 1880 and 2010, ice regression was around 30cm in 130 years or around 0.2 cm per year. European glaciers have contracted by between 30% to 40% over the past 100 years. Arctic glaciers have lost about 10% of their permanent ice [26] . Antarctic glaciers, having a thickness of nearly 2000 m of ice, store about 70% of the fresh water reserves of the world—more than 30 billion m3 of ice (fifteen times that of Greenland). In a scenario of exponential increase in global temperature, such melting will likely lead to serious SLR consequences. The total melting of Antarctic glaciers could contribute to an SLR of 70 m. Total melting of Greenland’s glaciers could raise sea level by 6m. Total melting of continental glaciers can be expected to raise sea level by 0.4 m [29] . It should be noted that melting of Antarctic and Greenland glaciers would be anticipated only along their oceanic peripheries. It would thus appear that such total melting could contribute to a total of around 10cm by 2100 [30] [31] .
b) Geological parameters (Geo). Tectonics (Tec) and volcanic eruptions (Vol)
Geological discussion of tectonics during the 19th and 20th centuries took for granted that the continents were immutably set in place, the stable canvas upon which all geological activity was applied, as if involving coats of paint upon an unchangeable surface. Just why volcanic eruptions and earthquakes occurred remained mysterious and evidently random and haphazard. It was only in the late 1960s and early 70s that the concept of plate tectonics and continental drift became the accepted basis upon which geology could rationally account for the on-going violence of global tectonic activity [31] [32] .
Geological events involve instability and movement of crustal areas, generally dictated by proximity to faults affected by movement of global continental plates or sub-segments. Resultant earthquakes can alter continental and sea bottom crustal surfaces. Tectonic events can suddenly and significantly alter ocean-bottom topography, which can easily cause a rise in SLR and trigger such unusually high sea wave events as tsunamis. Events of this kind can alter the geometry of oceanic basin rims and coastal boundaries, as well as sea water temperatures, thus influencing SLR.
c) Sedimentation from estuaries and carbonate deposits (Sed)
Natural erosion of rock exposures by rain and wind introduces on-going sedimentation into streams and estuaries. This sediment is transported by estuaries into the sea, altering coastal bathymetry by raising sea floor levels. As a further result of global warming and climate change, higher average ambient temperatures increase amounts of carbonates that precipitate to the sea floor, thus raising sea floor levels and constricting sea basins, yielding SLR.
d) Sudden seawater dynamics—Tsunamis (Tsu) and Hurricanes
Such natural orogenic events as earthquakes or volcanic explosions, whose focal points are in or adjacent to oceans or seas, can lead to significant sudden SLR, to which coastal regions are highly vulnerable. Two examples of the dimensions of a disaster owing to sudden SLR can be noted here: the tsunami of 26 December 2004 in Indonesia, and that of 2011 along the NE coast of Japan.
Significant ancillary damage to infrastructure from tsunamis and hurricanes could include loss of fresh coastal water resources. Wave pressure could lead to upward and lateral groundwater movement, resulting in amplified degrees of freshwater/salt water mixing and reduced fresh water volume. Worldwide reports attest to a decrease in size of fresh water lenses owing to subsurface pressure waves [33] - [35] .
Statistically, major tsunamis occur with a frequency of around one per decade. Hurricanes are experienced with a frequency of at least two or three events per year in regions typically affected by them.
Impact of sudden SLR events on regional coastal environments and human welfare has recently included the following examples:
· in Indonesia, fresh water of about 75,000 wells was contaminated by mud and saline water, and damaged by sewerage;
· along the eastern coast of India, ponds and wells were contaminated due to mixing of seawater, leading to a scarcity of drinking water, while groundwater within 500 m of the coast became highly saline, increasing 10 to 100 fold, and land surface subsidence was reported;
· in Sri Lanka, around 60,000 shallow wells in the affected coastal settlements were impacted and were registered as no longer useable [34] , and
· in the Maldive Islands, flooding salinated many wells; in a number of wells, sandy bottoms were raised, indicating vertical upward pressure resulting from the force of the tsunami wave being transmitted through the subsurface, lifting the sandy bottoms of the wells.
Data from impacted areas around the Indian Ocean indicate that tsunami-caused wave pulses of 10 to 20 m could destroy most ground and surface water monitoring systems. Soils for several kilometers inland from the coast could become salinated.
On 11th March, 2011, a magnitude 9.0 (Richter Scale) earthquake occurred, having an epicenter approxima- tely 100 km off the northeastern shore of Honshu, Japan. A Richter magnitude of 9 is characterized as one that can lay waste to an area of several thousand km surrounding the epicenter. Earthquakes of such a magnitude are known to occur globally once every 20 years. Japan is situated astride the “Ring of Fire”, a subduction zone intersection between the Pacific and North American tectonic plates. Stress between these adjacent plates is released in the form of earthquakes that can cause devastating tsunamis. Volcanic eruptions regularly occur along this subduction zone; thus, the territorial term, “Ring of Fire” [35] .
Regions most threatened by such strong incursions of seawater would include coastal areas and islands in and around the Pacific and Indian Oceans, especially those having low relief. In Europe, such areas could include the Netherlands, the southern French coast, and estuarine regions along the British coast, where large cities such as London could be endangered. In the USA, such east coast cities as New York, Boston, Miami, New Orleans, etc. could easily be threatened by sudden SLR [34] - [37] .
e) Climate change due to natural factors
Along with factors involving natural events on Earth, global temperatures can be affected by extra-terrestrial factors. These factors have been shown to have altered global ambient weather over periods of thousands of years. Ice ages, and even mini-ice ages, are well documented over the 65.5 million years of the Cenozoic era, including the latest, Anthropocene epoch. Prominent influences regarding the cyclical nature of ice ages and warming periods include a number of parameters that can influence SLR [38] - [41] .
Precession of the poles (Pol)
Earth’s axis as it circles the sun is skewed 23.5˚ off a perfect 90˚ alignment. Precession involving a full rotation of this axis takes around 26,000 years, i.e., for Earth to return to its original orientation vis-à-vis the sun. For the Earth’s surface, its polar areas experience the greatest cyclical variation of solar influence over those 26,000 years. When Earth’s axis through the North Pole is oriented towards the sun, northern regions experience greater warming vis-à-vis those years when the axis is oriented away from the sun. The opposite is true for southern climes. Northern regions thus experience a 26,000 years periodic warming cycle while southern regions experience a 26,000 years cooling cycle, and visa versa [42] .
Solar winds, sunspot cycles, cosmic rays, and interstellar dust clouds (Sol, Cos)
Sunspots are massive solar storms, brought about by emergence of magnetic bands through the sun’s photosphere. They generate solar storms of plasma, called solar winds, which race outwards and often intersect the earth’s magnetic field. These interactions result in the familiar and beautiful auroræ borealis or australis. In years of extreme solar storms, these flows of plasma can overload electrical networks, as occurred in Quebec late in the last century. Solar winds can block on-going bombardment of the earth’s atmosphere by cosmic rays, the majority of which originate from supernovæ, as stars more massive than our sun explode in their final stage of burning carbon and producing iron in their cores. The gamma rays and neutrinos of these cosmic rays strip electrons from atoms in their path, producing a trail of ionized atoms. It has been theorized that water vapor condenses around the path of these cosmic rays through earth’s atmosphere, resulting in cloud formation. Clouds in earth’s atmosphere reflect sunlight, causing cooler ground level temperatures. As a result, the more cosmic rays striking our earth’s atmosphere, the greater the global cloud-cover, and the lower the ambient global temperature.
However, during periods of greatest sunspot activity, a periodicity that varies over eleven years, solar winds obstruct the flow of cosmic rays into earth’s atmosphere, reducing cloud-cover, and warming earth’s surface. It is theorized that the 11-year sunspot cycle itself rises and falls over long periods of time, and that this could contribute significantly to the periodic ice ages and warmer eras the earth experiences. The validity of either short- or long-term sunspot cycles as agents affecting global warming is yet to be scientifically verified. For that reason, the degree of involvement of sunspot cycles as agents affecting global warming is currently a focus of intense astronomical research.
An additional factor that could play a part in long-term global climate change, but has not been assigned a weighting here is our solar system’s entrance into interstellar gas clouds. Such a factor would not appear to involve any known periodicity, and thus could not be involved in any planning model for global climate change [42] .
f) Global dimming (Gld)
Several parameters could contribute towards actually mitigating general global warming and consequent sea level rise. Much as both natural and anthropogenic parameters can cause SLR, so there are both natural and anthropogenic parameters that can work towards mitigating global warming and resultant SLR. Significant amongst geological parameters, volcanic eruptions can generate global cooling over periods of one to ten years. Such instances spawn mini-nuclear winters. However, such intervals are short-lived, lack periodicity or a cyclical nature, and can therefore be ruled out as a factor in periodic global warming on a long-term basis.
Research has increasingly been focusing upon parameters having the possibility of contributing to a slight but on-going decrease in the amount of solar radiation reaching the Earth’s surface. Such an effect could be caused by ærosols or particulates, such as those that might rise into the stratosphere in the course of volcanic eruptions. This was impressively documented following the eruption of Mt. Krakatoa in 1883. Prolonged global periods of artificial winter might have ensued after the Chicxilub comet or asteroid ejected sufficient material into the upper atmosphere at the end of the Cretaceous and the beginning of the Tertiary periods, roughly 65 million years ago. The impact is believed to have caused the extinction of the dinasours, owing to the global die-out of vegetation due to the likely subsequent ten-year-long global winter.
Atmospheric ærosol particulates can become nuclei for the creation of water drops, producing cloudy, reflective surfaces that might mirror solar visible light and infrared radiation back into space, and away from the ground surface, thus leading to a gradual drop in global temperatures, i.e., “global dimming” [45] . For that reason it is difficult to give a weighting to such a parameter. An additional source of potential global dimming might result from the on-going bombardment of earth by interstellar cosmic rays, which can significantly affect Earth’s global atmosphere and resultant climate. Such interstellar cosmic rays could lead to increased global clouding, with resultant cooling of earth’s surface, as noted above [43] [44] .
2) Anthropogenic parameters that could cause SLR
a) Global warming and climate change: greenhouse gases (Ghg)
It might be possible to estimate the potential for global warming over the coming 21st century by assessing sea levels of the late Pliocene era, when continents were aligned much as they are today, and when CO2 concentrations in the earth’s atmosphere were at levels some scientists anticipate by the end of this century, if no significant changes occur in anthropogenic CO2 and methane production (employment of fossil fuels for energy, growing of livestock, emplacement of waste dumps, etc.). Bore-hole analyses of 16O vis-à-vis 18O content of mid-Pliocene bedrock have been made throughout the globe recently by a consortium of nations as part of the Integrated Ocean Drilling Program (IODP) and the USGS’s Pliocene Research, Interpretation, and Synoptic Mapping (PRISM) project. Sampling areas have included Greenland and Iceland, along the US SE coast, California, Peru, and Antarctica. These projects have been coordinated and collated with findings from the United Kingdom’s Hadley Centre Coupled Model (HadCM3). The studies estimate a fairly broad range of potential global average temperature rises, of between 1.1 and 6.7 degrees Celsius, and a worldwide SLR of anywhere between 18 and 59 cm. If, in fact, global average temperatures actually rise to those of the mid-Pliocene, significant SLR in North America could result in submerging the entire state of Florida and the island nation of Cuba beneath the Atlantic Ocean and the Caribbean Sea. The entire coastal plain of the state of North Carolina could be under ocean water [13] [45] [46] .
It would appear a reasonable presumption that on-going SLR partially owing to modern human activities could thus be due to global warming resulting from emissions coming from the burning of fossil fuels for transportation, housing, and industry. These emissions include particulates, aerosols, new chemical products, and numerous amounts of such greenhouse gases as CO2, N2O, CH4 (from agricultural fauna), etc. [27] [46] .
Over the past 400 years, the amount of CO2 in earth’s atmosphere has increased in parallel with average ambient atmospheric temperature. There has been a greater than 25% increase in CO2 during the industrial era. Recently, the increase has amounted to 0.4% to 0.5%/year [27] .
The latest reports of the World Meteorological Organization (WMO) and the United Nations Program for the Environment (UNPE) anticipates a sharp increase in world ambient temperature of between 1.4˚C and 5.8˚C by 2100. Ocean and sea water temperatures may also increase significantly by 2100. Considering the rising trend in CO2 over recent decades, expectations of significant global warming with climatic alteration of SLR, would appear a sensible expectation [46] .
As noted above, global warming will likely lead to melting of continental and other peripheral polar glaciers [28] [51] . Although melting of Antarctic and Greenland glaciers can be expected only along their oceanic peripheries, it would appear that such total melting could contribute to a total of around 10 cm by 2100 [30] .
The factor of anthropogenic generation of greenhouse gases into the atmosphere, leading to global warming, has been theoretically examined in numerous scientific models. The veracity of these models remains to be pro- ven. On the other hand, whilst such long-term factors as global precession and long-term sunspot cycle variation, or short-term sunspot cycle/cosmic ray periodicity and volcanism can play significant roles in periodic global warming, human civilization cannot influence these factors. Humanity can, however, significantly and rapidly reduce anthropogenic generation of greenhouse gases into the atmosphere, and thus play a key part towards precluding global warming, with resultant sea level rise. The authors of this article believe this warranted, regardless of ultimate proof of causation.
Despite controversial influences and effects, assessment of SLR and its trends have been reported by the Intergovernmental Panel on Climate Change (IPCC), based upon data from Topex-Poseidon satellite measure- ments [52] . These maps indicate that sea water warming has caused more than twice the SLR noted in earlier measurements. Previous reports, based on pre-1990 data, indicated SLR of around 1 - 1.5 mm/y. Additional reports, based on data from 1992-1998 indicate that an SLR of 50 to 100 cm could be expected by the end of the 21st century [38] [47] .
These satellite maps indicate SLR of between 5 to 20 mm per year, as well as SLR in various areas resulting from a steric effect (see following paragraph). Alteration in these satellite value trends has been noticeable over recent years (1992-2002) in maregraphic tide level measurements from stations located along the eastern portion of the Mediterranean Sea, including the Israeli coasts of Tel Aviv, Ashdod, and Hadera [48] .
A portion of SLR appears attributable to the steric effect, a thermal expansion of sea water. As noted above, this effect can result from a combination of both natural and anthropogenic factors that contribute to an increase in sea water temperature. A world map of SLR due to the steric effect can give an idea of the variety of SLR changes that are possible in a variety of areas owing to this effect [27] .
Coarse estimation of on-going SLR carried out for Israel’s Coastal aquifer, presuming an SLR of 0.5 m with a seashore slope of 0.1%, anticipate permanent fresh groundwater storage loss of around 25 million cubic meters for each km of lateral coastal intrusion of sea water [49] [50] . Thus, even with a low level of on-going SLR, gradual SLR can adversely impact ever-expanding areas of the region, such expansion being a function of relative vulnerability levels to SLR within the region.
Given the potential destructive impact of SLR, such questions arise as: 1) Is the SLR trend globally stable in space and time? and 2) How might coastal environments respond to SLR? In other words, what is the vulnerability of sea coast areas to SLR, and how ought this be assessed? [22] [46] [51] [52] .
b) Deforestation, intensive agriculture, and wetland deterioration (Def)
As world population increases, demand for basic resources and fuels augment other ancillary effects of global warming. As with forests, intensive agriculture involves production of ground surface vegetative cover and biotope. However, the O2/CO2 metabolism of most agricultural crops is far lower than that of forest tree cover. Whilst both crops and forest trees can mitigate CO2 emissions, agriculture involves not only vegetative crops but also the breeding and raising of grass-eating animals, with resultant methane emissions. Recent intensive agricultural expansion in some portions of the world has clearly been achieved at the expense of forest cover (Brazil, Africa, etc.), ultimately resulting in significantly reduced mitigation of CO2 emissions [39] [53] - [55] .
Deforestation can involve depletion of such critical sea coast vegetation as mangroves and other wetlands. Over the past century the world has lost about 80% of its coastal forests, mangroves, and wetland vegetation [58] . The destruction of mangroves and wetlands eliminates their helpful buffering effect along the coast and can seriously impair the ability of a sea coast to resist wave-induced erosion. Intensive agriculture and coastal land-use alteration, the replacing of mangroves and wetlands with human habitations and commercial enterprises, have been the major cause of this loss. As noted below, rampant removal of forest cover and wetlands, especially mangrove swamps, can play a critical role towards accelerating the effects of CO2 emissions, reducing natural mitigation of CO2 buildup, while at the same time reducing the buffering effect of local sea coast vegetation [54] [55] .
c) Engineering alteration of coastal configuration (Eng)
Certain engineering alterations of coastal configurations can constrain the borders of seas and oceans, changing the bathymetry of these basins by reducing the volume of water they can contain, thus raising sea levels [40] .
2.1.2. Parameters That Could enhance the effect of SLR (Table 1)
1) Natural parameters that could enhance the effect of SLR
a) Lithology (Lit)
The degree of alteration that can be expected along a sea coast as a result of SLR would be significantly influenced by that coast’s lithology and stratigraphy. Shorelines with easily erodible lithologies could be expected to suffer more severe regression from SLR than shorelines protected by more resistant lithologies. Sea coast lithologies can range from easily erodible, unconsolidated sand, silt, and clay sediment, through consolidated sandstone, calcareous-cemented sandstone (“kurkar”), and limestone, to more resistant dolomite, igneous, and metamorphic rocks. More easily erodible lithology could lead to development of embayments, which could be enlarged under pressure of severe waves and tidal action [14] [27] [37] [56] [57] .
b) Coastal slope (Slo)
Gradual, gentle slopes enable rising seawater to more readily penetrate inland. This lateral advance affects the various infrastructures sited along the coast, as well as the salinity of coastal groundwater aquifers [58] .
c) Embayment (Emb) and Estuaries (Est)
As noted above, the number of coastal embayments can be significantly influenced by coastal lithology. Embayments, as well as estuaries, provide natural pathways for inland seawater intrusion. The greater the number of embayments, the greater a sea coast’s regional aquifers’ vulnerability to SLR [58] .
d) Bathymetry—Bat
The geological factors of local lithology, stratigraphy, and resultant geomorphology dictate coastal bathymetry. This parameter can in most of cases be correlated with coastal slope. Low bathymetry involves shallow coastal regions that in this study would be defined to involve depths of less than 100 m lying within 100 km of the seashore. The effect of sea water wave erosion is higher in areas of higher bathymetry, and lower in areas of lower bathymetry, but the steric effect of water warming can then begin to factor in and become more evident [58] .
e) Waves (Wav)
Wave amplitudes along the coasts of closed seas are generally considerably smaller than those encountered along open ocean and sea coastlines, sometimes around 10 times smaller. However, global climate change could lead to increased incidence of such singular events as hurricanes and tropical storms, which would involve suddenly increased wave amplitudes. Even coastlines of closed seas could prove vulnerable to such sudden SLR events, which can destroy buildings and infrastructure, sundering retaining levies, and thereby discharging lake and river water into lower topographic inland environments. Such hurricanes as “Katrina”, which struck New Orleans, Louisiana, and the northern Gulf of Mexico at the end of August 2005, can involve tremendous wind speeds causing waves more than three meters high [59] [60] .
f) Tides (Tid)
Tides are natural effects of the gravitational influence of the moon and sun. This on-going advance and recession of masses of water would not be expected to be significantly altered by climate change. Susceptibility of sea coast regions to destructive tidal incursions could, however, be augmented by anthropogenic activities [61] .
g) Vegetative cover and coastal soil conservation (Veg)
Deforestation often results from intensive demand by the local population for increased agricultural production. “Slash-and-burn” agriculture lays waste beautiful and ecologically-critical old-growth forest cover, both in equatorial jungles, such as Brazil’s Amazon region or Indonesia, as well as in northern forests such as those of Washington, Oregon, and British Columbia, in North America, or the outback of Australia.
Destruction of naturally protective coastal wetland vegetation, such as mangroves, which serve as hugely efficient buffers for highly erodible coastal lithologies, augments coastal instability. Long term, such changes can intensify destructive effects of hurricanes and tsunamis.
Vegetation enhances soil fertility by retaining soil æration. As tree-cover and other vegetation filter the air, cleansing it of excess CO2 in return for added O2, their root systems protect soil from erosion. And especially along coastlines, vegetative cover critically maintains lithologic integrity. Tree-cover and deeply-rooted soil- and sand-fixing plants and groundcover adapted to local environments, such as fescue, could serve as efficient anchors in areas where physiographic vulnerability of steep-sloping sea-side cliffs and valley walls are prone to erosion [11] [62] - [64] .
2) Anthropogenic parameters that could enhance the effect of SLR
a) Population growth rate (Pgr)
Population Growth Rate (Pgr) is a function of standard of living and social behavior. Population increase leads to increased energy consumption, which is positively correlated with use of fossil fuels, and in consequence, with emission of greenhouse gases. Countries having the highest population growth rates, such as those in Africa and the Middle East, while not producing high per capita CO2, nonetheless contribute significantly to greenhouse gas emissions, owing to high populations, the energy-producing materials they consume, and agricultural emissions from livestock. Countries with lower population growth rates, such as those in Western Europe and North America, augment greenhouse gas emissions with higher rates of energy consumption and consequent total CO2 emission per capita [23] [64] - [66] .
Moderate global population growth, assuming constant CO2 emission per capita, irrespective of standard of living increases, must be considered in the context of on-going, and even increasing, levels of removal of forest cover and wetlands.
b) Gross Domestic Product (Gdp)
The gross domestic product (Gdp) of a country is one means of measuring the size of its economy. GDP is defined as the total market value of all goods and services produced within a given country in a given period of time (usually a calendar year). In other words, GDP = consumption + gross investment + government spending + (exports − imports), “Gross” means depreciation of capital stock is not subtracted. Consumption and investment in this equation are expenditures on goods and services. The exports-minus-imports portion of the equation (often called net exports) adjusts this by subtracting the part of these expenditures not produced domestically (imports), and yielding return to the domestic area (exports).
Total energy consumption and production are generally positively correlated with the size of population as well as with standard of living, as expressed by Gross Domestic Product (GDP) per capita for each country [67] . Thus, a close correlation of GDP with total CO2 emissions would be expected and could be expressed as CO2 emission per unit of GDP. This correlation can be roughly estimated by multiplying population numbers by increases in total CO2 emission per capita for any given area of study [38] .
c) Urbanization (Urb)
Urban population (Urb) is a key parameter enhancing total per capita CO2 emissions. Mega-cities are rapidly multiplying throughout the world, mainly in coastal areas. This parameter is closely correlated with industrialization and other anthropogenic activities. These result in intensive additive increases in energy consummation and consequently, total CO2 emissions, while simultaneously leading to development of problematic microclimates. In many developing countries future land-use alteration appears to focus upon their coastal areas [68] . Whereas the global contribution to SLR of small developing countries would be expected to remain low, greenhouse gases resulting from their urbanization could contribute to global warming, threatening the local environment and ecology [51] [69] .
d) Inappropriate long-term land-use planning (Ipl)
Long-term land-use planning can play a key role towards enhancing or mitigating the effect of SLR in coastal regions. Sustainable exploitation of regional natural water and land resources, proper maintenance of forest and tree cover and wetlands, compatible levels of agriculture with regional geomorphology and soils, and sensitive emplacement of engineering facilities within the coastal landscape are factors which might work towards mitigating the effect of SLR in sensitive regions. On the other hand, poorly planned and inappropriate land-usage could rapidly and significantly exacerbate regional consequences of SLR [23] [70] - [72] .
Over-exploitation of regional natural resources (Exp)
As well as causing global warming, over-exploitation of fossil fuels can lower groundwater heads, resulting in sinking of regional topographic ground surface levels [28] . Groundwater heads can also be lowered, inducing sea water intrusion and deteriorating groundwater quality both along the coast and inland [49] .
Engineering facilities impacting sea coast environments (Eng)
Construction of levees blocks direct impact of coastal waves. Construction of dams stores and regularizes surface water resources for agriculture, domestic drinking water, and energy production. On the other hand, such facilities can also have such destructive effects as reducing flow of water and sediment into the sea. This can lead to increased coastal erosion, resulting in further regression of the seashore. Prominent examples include dams on the Rhone, Elbre, and Nile within the Mediterranean Sea’s catchment area. In the case of the Nile, river discharge has been reduced more than 80% since the construction of the Aswan Dam. Consequent reduction in sedimentation has lead to severe erosion of its delta, as well as depletion of previous natural beach sand and silt distribution to adjacent eastern Mediterranean shorelines [39] [77] . Resultant erosion of coastal material towards the sea bottom can alter the bathymetry and geometry of shorelines as well as the hydrogeological boundary of coastal aquifer systems [49] [56] [62] .
2.2 Assessment of Vulnerability of Coastal Regions to SLR
2.2.1. Assessing causal and enhancing factors based upon selected parameters
Causal and enhancing factors, Fc and Fe, involve selected parameters, as given in Table 2.
Table 2. Empirical assessment of coastal environmental vulnerability to SLR.
R = Rating; W = Weighting; Vi = Vulnerability = Fc + Fe.
The causal factor, Fc, includes key influencing natural and anthropogenic parameters listed in the table and in the equation:
 (1)*
(1)*
*The meaning of all these symbols is given in Table 2.
Certain parameters would appear to have minimal influence, and are coincidentally difficult to assess. These parameters have been assigned lowest or zero weighting, with rankings equal to zero, owing to their universal and global influence, as shown in Table 2. For the causal factor Fc these parameters are Pep, Ext, and Gld.
The enhancing factor, Fe, includes natural and anthropogenic parameters listed in the table and in the equation:
 (2)*
(2)*
*The meaning of all these symbols are given in Table 2.
2.2.2. Factor calculation based upon parameter assessment by weighting and rating
1) Parameter weighting assessment
Parameter weighting is based in this study upon assessment by hydrologists and ecologists of cogent parameters involved in SLR and its environmental effects. Such assessment can often involve simple common sense and intuition.
To express the degree of influence of a parameter upon SLR or upon a sea coast’s vulnerability to SLR, a weighting is attributed to each parameter. As shown in Table 2, the greater the weighting, the more significant that parameter’s influence could be considered upon SLR or upon a sea coast’s vulnerability to SLR. Thus, for each selected parameter (j) a weighting (Wcj or Wej) has been assigned, increasing from lowest values—those deemed to have lowest influence, to highest values—those deemed to have highest influence. The total influence upon a specific area would thus be the sum of the weightings given to each of the parameters that define the causal and enhancing factors. It should be noted that such parameters could have either positive or negative influence.
Parameter weighting estimation has been based here either upon field experience or support from the literature, as well as evident linkage between the parameter and SLR and its effect upon coastal environments. For some parameters the weighting has also been based upon subjective intuition. Estimation of weightings is not the objective of this study, but rather is employed as a means of showing how such a weighting can influence regional parameter estimation and the relationship between a parameter and SLR and its effect upon a coastal environment. This study’s weighting estimation is given in Table 2, which indicates the variation of these weightings for each of the parameters [5] [17] [73] - [75] .
Thus, for the causal factor, highest weightings are attributed to melting of glaciers and polar ice (Mel), assigned a weighting of 35%, and to CO2 greenhouse gas (Gco), assigned a weighting of 25%. CO2 contributes to global climate change owing to its significant impact upon global warming and thus indirectly influences the steric effect. Parameters with high weightings owing to their critical regional impact include waves (Wav) resulting from hurricanes, or tectonics (Geo). These are assigned weightings of 13%. Lowest weightings have been given here to extraterrestrial events (Ext), engineering activities (Eng), and global dimming (Gld)—which is assigned a negative value of −8%.
The enhancing factor includes such parameters as geomorphologic coastal relief, which can be expressed by beach slope (Slo) and the number of coastal estuaries and embayments (Emb). A highest weighting of 30% has been assigned to lithology (Lit), which can influence erosion potential of coastal rock. Coastal slopes (Slo), population growth rate (Pgr), and GDP (Gdp) are each assigned weighting values of 15%. Lowest weighting values are given to engineering activities (Eng) and tides (Tid). Off-shore expression of geomorphology-bathy- metry (Bat), is assigned a weighting of 8%, as it influences ocean basin volume as well as the size of near-shore waves. This parameter can be inversely correlated to the steric effect of warming of coastal water. Vegetative cover (Veg) is assigned a negative weighting value of −15%, as this parameter can significantly mitigate the effect of SLR upon a coastal region.
2) Parameter rating assessment
As noted above, a weighting has been assigned the relative potential influence of each parameter involved upon the vulnerability of any coastal area to SLR. To evaluate the relative influence of a parameter upon a specific study region, each parameter in that region (Rjr) has been here assigned a rating (R), to characterize the impact of the parameter (j) upon that region (r). A highest rating of 6 is assigned in any particular study region to a parameter that is expected to have the highest influence upon SLR potential for that region. A lowest rating of 1 would be given to a parameter that should have least influence upon SLR potential for the region.
As shown in Table 2, a negative weighting can be assigned to parameters that appear to mitigate SLR or reduce its effects upon the regional environment. Table 2 indicates the substantial variation in natural and anthropogenic parameters in coastal areas that can cause or enhance the effects of SLR. This is especially apparent in such developed areas as the USA, when compared to other areas in the world. Thus, to determine differences between study regions, maximum potential value of each parameter is employed here to evaluate both causal and enhancing factors, as a basis for prioritization of the areas.
As given in Table 2, each parameter Xji that contributes to the factor can be expressed by its weighting (Wj) and rating (Raj), such that:
 (3)
(3)
The summation of this expression for all parameters involved yields a comprehensive value of causal and enhanced factors (Fc and Fe) involved for any particular study region.
2.2.3. Numerical and graphical prioritization of coastal region vulnerability to SLR
Vulnerability of a coastal region to SLR is influenced by the SLR causal and enhancing factors effecting a regional environment. This vulnerability is denoted here as “Vf”, a value that characterizes each region. Vf is assessed by the addition of the values for the causal factor, as presented in Figure 1.
Vf is calculated by estimating causal and enhancing factors of an area. The larger the Vf value, the more vulnerable a region is to SLR. This paper attributes a Vf value to each area “i” of the study region (Vfi). Where possible, Vfi values can then be compared to measured SLRi values for a particular area, to illustrate the gap between assessed and measured SLR.
3. Discussion: Application to Selected Global Coastal Areas
3.1. Regions of Study and Presentation of Data and Results
Coastal environmental vulnerability to sea level rise (SLR) is here seen to involve two factors, Fc and Fe.
In order to illustrate the use of the approach taken in this study, six varied coastal regions in different areas of the world (Figure 1) have been selected for assessment. Vulnerability of each of these regions is given as regards a worst-case scenario of each of these factors. The regions are:
1) The coastal plain of Israel (ISRw), located along the eastern coast of the Mediterranean Sea;
2) The southwestern coast of Iceland (ICEsw), along the northern Atlantic Ocean;
3) The southeastern coast of Australia (AUSse), along the South Pacific Ocean;
4) The southwestern coast of India (INDsw), from Mumbai to Cape Comorian, along the Arabian Sea;
5) The southeastern coast of China (CHIse), from Hainan to Taiwan, along the South China Sea coast; and
6) The southeastern coast of the USA (USAse) from North Carolina to Miami, along the Atlantic Ocean.
3.2. Weighting and Rating of Selected Causal and Enhancing Parameters Regarding SLR
Natural and anthropogenic causal and enhancing parameters have been selected for estimating relative vulnerability of regions to SLR, as discussed above in Section 2.1 and Table 2. This table presents weightings for each parameter, indicating relative importance of each parameter in relation to the others, where the total weighting of each factor’s parameters is 100%. In the regions being evaluated, each parameter has been assigned a rating value, indicating the relative degree of influence of that parameter upon the specific regional environment, ranging from lowest –1, to highest –6.
3.2.1. Key parameters That define the causal factor Fc
1) Natural causal parameters
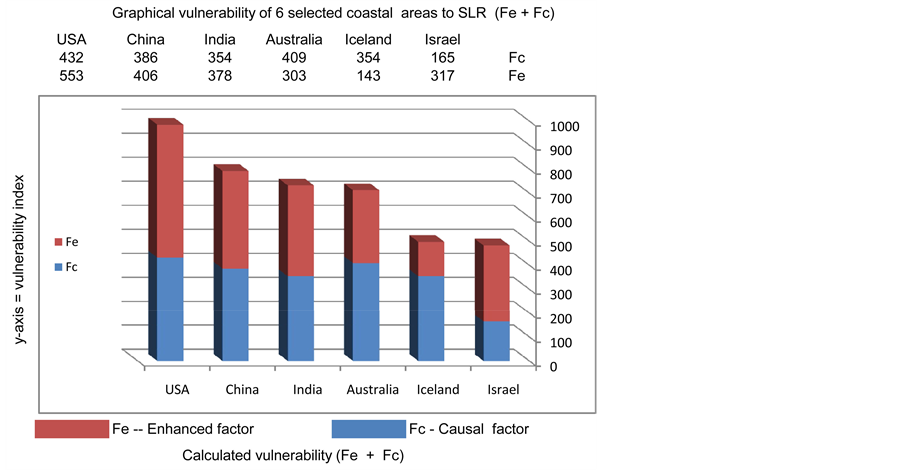
Figure 1. Graphical vulnerability of 6 selected coastal areas to SLR (Fe + Fc).
Key natural parameters that can significantly cause SLR in the regions under consideration in this study include:
a) Melting of glaciers and icecaps (Mel)
For the causal natural parameter of melting of glaciers, icecaps, and polar sea ice, Table 2, assigns the highest weighting of 35%.
For this parameter, a highest rating of 6 can be attributed to regions close to the Arctic, such as the southwestern coast of Iceland (ICEsw). There, melting of glaciers and the interior icecap appears to be most significant. This suspicion has been supported over recent years by reported evidence of Arctic warming, and forecasts that Arctic ice-cover could disappear entirely within the coming 100 years [26] [30] .
A relatively high rating of 5 can be attributed to areas that might be influenced by melting of polar glaciers and icecaps, such as the southeastern coast of Australia (AUSse), owing to its relative proximity to the Antarctic Icecap.
A moderate rating of 4 could be given to more peripheral areas, such as the southeastern US coast (USAse), owing to the influence of Arctic melting to its north.
Lower ratings of 3 and 2 can be respectively attributed to such regions as southwestern India (INDsw) and southeastern China (CHIse), which are far from polar glaciers and icecaps, but where SLR might be minimally influenced by melting of such continent glaciers as those in the Himalayan mountains.
A lowest rating of 1 may be attributed to such coastal Mediterranean areas as Israel (ISRw), exposed to the more limited influence of European continental glaciers upon the Mediterranean watershed.
b) Tectonics (Tec) and volcanic eruptions (Vol)
A relatively high weighting of 13% is attributed here to the causal natural geologic parameter of tectonics and volcanic eruptions. For this parameter, as presented in Table 2, a highest rating value of 6 can be attributed to the southwestern coast of Iceland (ICEsw), located on the Mid-Atlantic Ridge, one of the earth’s most active tectonic zones. Values of 5 and 4 are assigned to areas located farther away from highly active tectonic zones, such as the coasts of southeastern China (CHIse) and southeastern Australia (AUSse). Intermediate values of 3 and 2 can be attributed to less tectonically and volcanically active regions, such as those located along the southeastern coast of the USA and the eastern Mediterranean Israeli coast, (ISRw). This region is relatively quiet tectonically, but can still be disturbed by earth tremors to the north and northeast, in Greece and Turkey, where the African Plate is colliding with the Eurasian Plate, and movements along the Syrian-African rift, immediately bordering the region to the east, in the Jordan River Valley, which divides the African and the Arabian plates. A lowest rating of 1 can characterize quietest regions having very low probability of impact from seismic movement, such as the southwestern coast of India.
c) Sedimentation (Sed)
The causal natural geologic parameter of sedimentation involves contributions of sand, silt, and clay issuing from estuaries into the sea, as well as carbonate deposition from coastal water. It is here given a weighting of 10%. As shown in Table 2, a highest rating of 6 can be attributed to the southeastern US coast (USAse). A rating of 5 has been given to the southeastern coast of China (CHIse). A rating of 4 is assigned to the southwestern India (INDsw), and a rating of 3 to the southeastern coast of Australia (AUSse). Finally, a rating of 2 would seem to characterize the eastern Mediterranean coastal region (ISRw), and a rating of 1 the southwestern coast of Iceland (ICEsw).
d) Tsumamis (Tsu)
The natural causal parameter of tsunamis (Tsu) involves highly dynamic sudden rises in seawater level. The dynamic, massive wave amplitudes engendered by tsunamis are usually caused by earthquakes or volcanic explosions. Such sudden SLR incidents are here given a weighting of 7% (Table 2).
As presented in Table 2, a high rating for this parameter of 6 can be attributed to the southwestern coastal region of India (INDsw). A rating of 5 is given to the southeastern coast of Australia (AUSse), and rating of 4 to the southeastern coastal region of China (CHIse). A rating of 3 is assigned to the southwestern coastal region of Iceland (ICEsw), and a rating of 2 for the eastern coastal region of the Mediterranean (ISRw). The lowest rating of 1 would appear to characterize the southeastern coastal region of the USA (USAse), as shown in Figure 1 [33] .
e) Climate change due to natural factors (Cli)
The natural causal parameter of climate change due to natural factors is here given a weighting of 8% (Table 2) owing to its significant influence upon global SLR. However, the time-frame for such climatic alterations generally involves periods of thousands to millions of years, and for this reason, ratings involving this parameter have not been assessed here for the study regions. This parameter is influenced by movement of tectonic plates, axial tilt of the globe—its obliquity and precession of its poles, and possible consequential glacial and interglacial fluctuation. Extraterrestrial influences that could apply to natural global climate change include solar winds and storms, sunspot cycles, movement of our solar system into and out of cosmic gas and dust clouds, impact of nearby supernovæ, and influence of cosmic rays upon earth’s atmosphere. As regards the potential impact of cosmic rays, resultant increases in global cloud-cover might actually lead to “global dimming”, such that this extra-terrestrial parameter might be assigned a weighting of −8% (Table 2).
2) Anthropogenic causal parameters
a) Greenhouse gases (Gre)
A key anthropogenic parameter that influences SLR is total CO2 emission. This parameter is thus given here a weighting of 25% (Table 1).
A major contributor of CO2 per capita is the USA, which puts out around 25% of total global CO2 emissions, and is here assigned a rating of 6, ranking first amongst the regions considered in this study. China’s CO2 emissions are just below those the USA [84] . Although China has a relatively lower standard of living than the USA, it has a larger population, such that its total CO2 emissions have already reached around 12% of the global total, or more than 24 billion metric tons per year. China is thus assigned here a rating of 5. Following China, the third most important contributor of CO2 emissions, with around 5% of total global CO2 emissions, is India, here assigned a rating of 4.
Amongst smaller contributors, Australia’s CO2 emissions amount to 1.5% of total global emissions, and are here assigned a rating of 3. Israel, with less than 7 million inhabitants, is here assigned a rating of 2, and Iceland, with its 300,000 inhabitants, and emitting a remarkably small amount of CO2 owing to its use of clean hydroelectric and geothermal energy, is assigned a rating of 1, its contribution being almost negligible.
b) Deforestation (Def)
The weighting assigned here to the anthropogenic causal parameter of deforestation, intensive agriculture, and wetland deterioration is about 8% (Table 2).
Of the regions reviewed here, a maximal rating of 6 is given to India, where deforestation is currently on the increase. China is assigned a rating of 5, having increased its forest cover by 1.2% over the past decade. Australia is given a rating of 4, having decreased its record of deforestation by 0.2%. The USA is awarded a rating of 3, having increased its forested land by 0.2%. Israel has had good record in fighting deforestation, and is given a rating of 2 with an almost 5% increase in forest. Iceland is assigned a rating of 1, having significantly increased its forested land [76] [77] .
c) Engineering Activities (Eng)
The anthropogenic causal parameter of engineering alteration of coastal configuration is assigned in this study a weighting of 2% (Table 2).
Engineering alteration of coastal configuration can have a noticeable effect upon inland seas and lakes. The rating assigned to the USA is 6, to Australia 5, and to China 4. India is rated at 3, Israel 2, and Iceland 1, its contribution being almost negligible.
3.2.2. Key parameters That define the enhancing factor Fe
1) Natural enhancing parameters
Amongst the parameters that have a major influence upon the factor of enhancing the effect of SLR in coastal regions are:
a) Lithology (Lit) and Geomorphology
These two natural enhancing parameters, which play a key role as regards the potential degree of alteration of coastal configuration, are assigned here a weighting of 30% (Table 2). Lithology critically affects the erodibility of rocks. Where coastal lithology is highly erodible and where this coincides with the presence of an unconfined coastal aquifer, boundary conditions of the aquifer stand in high danger. The coastal regional geomorphology upon which SLR would be likely to have the high impact would be one that involves low slopes (Slo) and a high density of embayments and estuaries (Emb), i.e.: five or more estuaries per 100 km. of coastline [34] [76] .
An approximation of the order of magnitude of this danger concerning permanent groundwater reserve loss (PRL) has been assessed for Israel’s Coastal aquifer. This indicates that for an SLR rate of 0.5 m, a PLR of around 16 million cubic meters (MCM) per km could be expected [49] . The largest portion of such losses would result from significant lateral seawater intrusion into the aquifer, as well as from alterations in the drainage basin basis. It should be noted that such losses cannot be easily rehabilitated and may be considered essentially irreversible [77] [78] .
In light of this, Israel’s Coastal region can be assigned a maximum rating of 6. Lithology along the eastern Mediterranean coast can produce either of two extreme scenarios to regional coastal aquifers. The first scenario involves erosion removing more impervious lithological layers and exposing more permeable lithological layers to sea water intrusion. The second scenario, in total contrast, involves the supply via coastal erosion and subsequent sedimentation of impervious inland material, which then infiltrates and blocks the pores of existing pervious aquifer lithology. A high lithology rating of 5 is likewise given to the southeastern coast of the USA. The southeastern coast of China is here given a rating of 4. The southwestern coast of India is assigned a rating of 3. Australia’s southeastern coast is given a rating of 2. The lowest rating of 1 on this relative scale is assigned to the southwestern coast of Iceland, the coastal rocks of which are least erodible of all the six study regions [49] .
b) Coastal slope (Slo)
The natural enhancing parameter of shoreline slope is most often also a function of sea coast lithology. Gradual slopes provide pathways for rapid inland intrusion of sea water. It’s weighting is thus assigned here as 15% of the total factor [49] (Table 2).
Of the six study regions being assessed in this report, the most gradual slopes, those most sensitive to SLR, would be along the eastern Mediterranean shoreline of Israel, given a rating here of 6. Slightly less susceptible would be the southeastern coast of the USA, assigned a rating of 5. A rating of 4 is attributed to the southeastern coast of China. The southwestern coast of India is given a rating of 3. The southeastern coast of Australia is assigned a rating of 2. And the steep slopes of the southwestern coast of Iceland are given a rating of 1.
c) Bathymetry—Bat
The natural enhancing parameter of bathymetry is another function of sea coast lithology. In this case, the more gradual the offshore approach to a shoreline, the less effective the battering of wave action upon coastal rocks and beaches. On the other hand, abrupt off-shore drop-offs enable the fullest power of waves to erode coastal lithology. Thus, this parameter has here been assigned a weighting of 8% (Table 2).
In this regard, of the six study regions considered in this report, the region having the deepest off-shore bathymetry is the southwestern coast of Iceland, here given a rating of 6. Australia’s southwestern coast is given a rating of 5. A rating of 4 is attributed to the southwestern coast of India. A rating of 3 is given the southeastern coast of China. The southeastern coast of the USA is assigned a rating of 2. And Israel’s eastern Mediterranean shoreline is given a rating of 1.
d) Embayments (Emb)
The natural enhancing parameters of embayments and estuaries, additional functions of sea coast lithology, can significantly augment the regional environmental impact of SLR. More embayment creates more inland access to coastal sea water intrusion. Additional estuaries along a coast afford more pathways for SLR to invade deeper into a coastal region. These parameters are thus assigned a weighting of 6% (Table 2).
Of the six study regions dealt with here, the one with the greatest number of embayments and estuaries is the southeastern coast of the USA, here given a rating of 6. The southeastern coast of China is assigned a rating of 5. The southwestern Icelandic coast is given a rating of 4. A rating of 3 is attributed to the southwestern coast of India. The southeastern coast of Australia is assigned a rating of 2, and the eastern Mediterranean shoreline of Israel is given a lowest rating of 1.
e) Waves (Wav)
The natural enhancing parameter of wave action lends strength to the impact potential of SLR upon a regional coastline. The larger the waves and the greater the strength with which they strike the shoreline lithology, the more rapid the erosion and instability of that coast. Hurricane winds can drive waves with great force against shoreline rocks and beaches. The 2005 hurricane “Katrina”, which struck New Orleans, Louisiana, and the northern Gulf of Mexico, involved tremendous wind speeds, causing waves more than three meters high [83] . Therefore, the weighting assigned here to wave action is 8% (Table 2).
Although its coast is rimmed with the least erodible lithology, the shoreline of Iceland would be expected to be pounded by the highest and strongest on-going battery of waves of the six areas considered in this study, such that the southwestern coast of Iceland is given a highest rating of 6. The southeastern coast of the USA is assigned a rating of 5. A rating of 4 is attributed to the southeastern coast of Australia. The southeastern coast of China is given a rating of 3. A rating of 2 is assigned to the southwestern coast of India, and the eastern Mediterranean coast of Israel is given a lowest rating of 1.
f) Tides (Tid)
The more significant the incursion of tidal action along a coastline, the deeper into that shoreline seawater intrudes on a daily basis. Thus, the natural enhancing parameter of tides has been here assigned a weighting of 4% (Table 2).
Of the six study regions assessed here, highest tidal activity occurs along Iceland’s southwestern coast, which is therefore assigned a rating of 6. Australia’s southeastern coast is given a rating of 5. A rating of 4 is attributed to India’s southwestern coast. China’s southeastern coast is assigned a rating of 3. The southeastern coast of the USA is given a rating of 2. Of the six study regions considered in this study, that with the least tidal action is the eastern Mediterranean coast of Israel, given a rating here of 1.
g) Vegetative cover and coastal soil conservation (Veg)
Owing to the mitigating effect of the natural enhancing parameter of vegetation and coastal soil conservation, this parameter has been here assigned a negative weighting of −15% (Table 2).
Highest vegetation cover of the six study regions considered in this study can be found along the southeastern coast of the USA. As this parameter actually mitigates the regional effect of SLR, the rating given to the southeastern coast of the USA is actually the lowest, 1. Ratings for this parameter are 2 for the southwestern coast of Australia, 3 for the southwestern coast of India, 4 for the southeastern coast of China, 5 for the eastern Mediterranean coast of Israel, and 6 for the southwestern coast of Iceland.
2) Anthropogenic enhancing factors
a) Population growth rate (Pgr)
The anthropogenic enhancing parameter of population growth could well be considered the “proximal cause” of coastal vulnerability to SLR. World population increase over the coming 50 years is expected to remain low (from nearly 0% in Europe to around 3% in some Asian and African countries [80] ). Comparing world populations in 2000 with that expected by 2050 [64] [79] -[81] , the most significant increases are anticipated in India, with an increase of more than half-a-billion inhabitants in 50 years, an increase of about 56%. This parameter is thus given here a weighting of 15% (Table 2).
Ratings for the six study regions assessed here then place the southwestern coast of India at 6, the southeastern coast of the USA at 5, the southeastern coast of Australia at 4, the southeastern coast of China at 3, the eastern Mediterranean coast of Israel at 2, and the southwestern coast of Iceland at 1.
b) Gross Domestic Product (Gdp)
Gross Domestic Product is a most helpful means of measuring the size and robustness of a region’s economy. It is generally positively correlated with the size of population as well as with its standard of living and population growth. As a result of a more sensitive economy and infrastructure, the weighting assigned to the anthropogenic enhancing parameter of gross domestic product is 15% (Table 2).
Owing to this increased sensitivity, it can be presumed that the effects of SLR in the regions studied in this paper would be allotted higher ratings in accordance with higher GDPs. Therefore, a highest rating of 6 has been assigned to the southeastern coast of the USA. A rating of 5 is given to the southwestern coast of Iceland. The southeastern coast of Australia receives a rating of 4. Israel’s eastern Mediterranean coast is assigned a rating of 3. A rating of 2 is allotted to the southeastern coast of China. And the southwestern coast of India receives a rating of 1.
c) Urban population (Urb)
The anthropogenic enhancement parameter of urbanization is closely linked with a region’s population growth rate and its economic GDP. Mega-cities are rapidly becoming more common throughout the world, mainly in coastal areas. This parameter is closely correlated with industrialization and anthropogenic activities. For this reason, trends of this key parameter closely relate to energy consumption and total CO2 emissions of a region, and simultaneously lead to development of varied microclimates. As presented in Table 2, urbanization as a percentage of the ambient national population is highest in Iceland, Israel and Australia, where more than 90% of the population of each is urban. The USA has a 78% urban population, China 39%, and India 28%. But even for such small countries as Iceland and Israel, future development appears to focus upon their coastal areas. Whilst global contribution to SLR for such small countries should remain quite low, even such a small country as Israel could contribute significant amounts of greenhouse gases. This parameter is thus assigned here a weighting of 8 % (Table 2).
In light of the discussion above, a highest urban population rating of 6 is here attributed to the southeastern coast of the USA, with a rating of 5 to the southeastern coast of China, 4 to the southwestern coast of India, 3 attributed to the Mediterranean coast of Israel, a rating of 2 to Australia’s southeastern coast, and a rating of 1 to Iceland’s southwestern coast.
d) Inappropriate long-term land-use planning (Ilp)
Poor long-term land-use planning and over-exploitation of regional natural resources can seriously endanger coastal populations and infrastructure. Therefore, these anthropogenic enhancement parameters are here assigned a weighting of 6 (Table 2).
The key aspect of inappropriate long-term land-use involves over-exploitation of regional natural resources of coastal areas, whether by industrialization, urbanization, or agriculture. This has led to significant alteration of the coastlines of many countries. In such coastal areas, the reduction of wetlands and mangroves appears to have significantly reduced coastal buffering potential as regards SLR, leading to accelerated erosion and instability of these coasts, harming local ecologic biotopes, as well as microclimates. Wetland and mangrove deterioration can have an enhancing effect upon SLR.
At this time, the most inappropriate long-term land-use planning and over-exploitation of regional natural resources (Oex) appear to be taking place along the southeastern coast of China, which is here given a rating of 6. A rating of 5 is attributed to the southeastern coast of the USA. The southwestern coast of India is given a rating of 4. Australia’s southeastern coast is given a rating of 3. The eastern Mediterranean coast of Israel is rated at 2. And a rating of 1 is given the southwestern coast of Iceland.
4. Conclusions and Recommendations
4.1. Conclusions
The authors, along with Sara Secunda, of the Israel Ministry of the Environment, wrote an internal paper— “Groundwater vulnerability assessment using a composite model combining DRASTIC with agricultural land- use in Israel’s Sharon region” in 1997 [5] . This paper promoted an approach which involved basing on-going groundwater quality monitoring upon regional vulnerability assessment. The study noted that no country in the world is sufficiently wealthy to uniformly monitor its entire area for all potential key parameters that might be required for a meaningful assessment of groundwater quality. It therefore advocated a program that would prioritize areas having maximal vulnerability to potential pollution, and then intensively monitoring such locations. The present study takes a similar approach towards empirically assessing coastal environmental vulnerability to sea level rise (SLR). It thus recommends that global regions be prioritized as regards potential vulnerability to SLR, such that water resources and land-use management planning be formulated in light of anticipated impact as regards both selected natural as well as anthropogenic SLR causal and enhancement parameters to SLR. Once assigned weightings, these parameters would be rated to reflect the likely percentage of involvement each parameter might be expected to play in causing or enhancing SLR.
4.2. Trends
The world’s countries and regions are affected by on-going trends regarding population, urbanization, degree of exploitation of natural resources, and industrialization. The latter parameter often leads to creation of new chemical products having unknown impacts on human beings and their environment. All of these parameters can lead to critical climate alteration. Growth trends in each can indicate the direction and intensity of human activities over coming decades. All of these parameters can provide decision-making bodies the requisite early- warning signals concerning coastal land-use planning and resource management, enabling possible mitigation of potential malaise that might contribute to climate changes.
Global climate change will certainly significantly impact coastal areas. Small coastal countries as Israel and Iceland, whose CO2 emissions are negligible as regard the global CO2 balance, must nonetheless prepare effective protection for their local coastal environments, to minimize further erosion and deterioration of coastal groundwater. All coastal countries and regions must assess vulnerability of cogent parameters and their influence upon SLR.
Current data point to a 70% increase in global population—nearly ten billion inhabitants—over the coming 50 years. China and India have large populations and justified desires for industrialization, intensive agriculture, and improvement in living standards. They will likely contribute significantly to increased total global CO2 emissions per capita. The USA will also likely remain a key contributor of global CO2 and other greenhouse gases. Thus, future trends in industrialized indicate seriously higher global greenhouse gas levels.
4.3. Vulnerability and Prioritization of Coastal Areas
The methodology employed in this study takes into consideration selected parameters that can cause and/or enhance coastal SLR. It advocates assessment of regional vulnerability and future trends that might influence causes or enhancement factors of SLR, and consequently enable prioritization of regional land-use decision-making and resource management. Such prioritization will require adequate regional vulnerability assessment of natural and anthropogenic parameters that can cause or enhance SLR. This assessment can focus attention upon areas where gauging stations, groundwater well assessment, and other monitoring endeavors are warranted, in order to pinpoint SLR impact data for any given region.
In this study, six diverse regions of the world have been assessed as to their coastal vulnerability to SLR. These regions differ significantly in their socio-economics, geographic location, and dimensions. Each region is characterized and prioritized regarding its relative vulnerability to SLR, as well as vis-à-vis global values, as presented in Table 2. Figure 1 presents a graphical representation of the relative vulnerability of this study’s six selected coastal regions. The six regions are 1) Israel’s coastal plain, 2) Iceland’s southwestern coast, 3) Australia’s southeastern coast, 4) India’s southwestern coast (from Mumbai to Cape Comorian), 5) China’s southeastern coast (from Hainan to Taiwan), 6) the USA’s southeastern coast (from North Carolina to Miami). These six regions are set out along the x-axis of the figure. The y-axis depicts the relative vulnerability (Vf) of these regions, displaying the causal (bottom) and enhancement (top) assessment factors. Vf is assessed by the addition of the values for the causal factor, as presented in Figure 1. Apart from such one-off events as tsunamis and hurricanes, organized management measures of this sort could succeed in minimizing or mitigating SLR damage to regional coastal infrastructure.
This study indicates that attention should be focused upon such highly sensitive regions as the eastern US coast (Table 2). This includes such cities as New York, Boston, Miami, New Orleans, etc., all of which could be significantly threatened by SLR [37] .
The southeastern coast of China, with its numerous estuaries, where erosion rates exceed sedimentation rates, can be representative of coastal regions that stand at slightly lower and yet significant risk from SLR. Such global areas are located along the Pacific and Indian Oceans, as well as in Europe, where shallow portions of the Netherlands, the Camargue region of southern France, and certain estuarine regions along the British coast, where large cites such as Edinburgh and London could be in serious danger.
Coastal regions assigned lower levels of risk to SLR in this study include southeastern Australia and southwestern Iceland (Table 2). Lowest priority is given here to the eastern Mediterranean coastal area, including Israel, which ought to parallel SLR risk levels for other closed inner-sea regions. It should not be forgotten, though, that the Mediterranean region possesses a coastline of approximately 45,000 km, along which reside around 500 million inhabitants. From pre-Biblical times, this basin has been the focus of intensive anthropogenic activities, and its cultural heritage dots the coastline with a multitude of precious prehistoric and historic archeological sites—the sources of Western Civilization. For such a region, notwithstanding a lower level of prioritization regarding risk potential to SLR, the adverse effect of SLR on regional coastal environment could prove quite significant.
4.4. Recommended Measures
In light of deleterious changes and the serious threat of SLR that could unfold in the very near future, the following recommendations may be advisable for assessing coastal environmental vulnerability and for regional coastal management:
· Near the coast, critical fresh groundwater levels should be determined, towards establishing “red-lines” regarding sea level alterations; it would, for instance, prove helpful to emplace additional, well-functioning observation wells along the coast.
· Preventive hydrological and engineering measures should be employed to mitigate seawater intrusion into the aquifer, to avert further hydrological and ecological deterioration, as well as to rehabilitate coastal wetlands and other vegetative cover, while encouraging the reforestation of inland areas.
· Steps should be taken towards increasing the levels of on-going satellite monitoring measurement of SLR and parameters that affect SLR along coastal regions, while improving levels of data availability and accuracy.
· Special attention ought to be paid to preclude and reverse the annihilation of coastal wetlands, forests, and other protective vegetation parameters that significantly influence the enhancement of SLR’s effect upon the coastal environment.
· As numerical assessments involved would be relative and qualitative rather than quantitative; resultant models should be subsequently calibrated by in situ data, as was the case with the vulnerability mapping of Israel and such subsequent data-acquisition programs as POLLSITE [82] .
· High-resolution shoreline mapping and surveillance of coastal areas having steep slopes with erodible rocks and unstable cliffs should be carried out, in light of expected SLR and increased wave action.
· Methodology should be improved for delineating and prioritizing key areas where vulnerability to SLR is maximal, and where early-warning signals as regards potential resource loss are urgently required to mitigate imminent risk to the regional coastal environment by SLR.
· The approach advocated in this study could be improved and augmented by:
*updating the manner of assessing weighting and rating parameters by, for instance, enlarging the Delphic approach used in the US EPA’s DRASTIC model to include a larger professional population [5] ,
*incorporating professional advice to minimize alterations in sedimentation and erosion rates that could alter regional/local coastal environmental vulnerability to SLR, groundwater resources deterioration by saliniza- tion, and pollution of fresh coastal groundwater due to flooding of sea and polluted water, etc., and
*increasing effective forecasting regarding the anticipated extent of remediation required to compensate for groundwater rendered unusable for human use as well as the amount of alternative fresh water recharge which must be then supplied by means of reclaimed sewage water or by sea or brackish water desalinization.
· Finally, to operationally execute and consolidate such recommendations, in the context of long-term regional and national planning, all relevant personnel should be involved from such governmental ministries as infrastructure, health, environmental quality, economics, etc., as well as from such academic institutes as engineering, science, and economics. The United Nations should enforce global laws and protocols to mitigate pollution through the world (via such accords as those of Rio de Janeiro, Kyoto, and Montreal [83] [84] .
References
- Bachmat, Y. and Collin, M. (1990) Management-Oriented Assessment of Groundwater Vulnerability to Pollution. Israel Hydrological Service Report, Jerusalem, 30 p.
- Melloul, A.J. and Collin, M.L. (1994) The Hydrological Malaise of the Gaza Strip. Journal of Earth Sciences, 43, 105-116.
- Melloul, A.J. and Collin, M.L. (2001) A Hierarchy of Groundwater Management, Land-Use, and Social Needs Integrated for Sustainable Resource Development. Environment, Development and Sustainability, 3, 45-59. http://dx.doi.org/10.1023/A:1011420206575
- US Environmental Protection Agency (1985) DRASTIC: A Standard System for Evaluating Groundwater Potential Using Hydrogeological Settings. NWWA/EPA Series, Ada, 163 p.
- Secunda, S., Collin, M. and Melloul, A. (1998) Groundwater Vulnerability Assessment Using a Composite Model Combining DRASTIC with Extensive Agricultural Land-Use in Israel’s Sharon Region. Journal of Environmental Management, 54, 131-142. http://dx.doi.org/10.1006/jema.1998.0221
- Brown, L.R. (2009) Could Food Shortages Bring down Civilization? Scientific American, 300, 50-57. http://dx.doi.org/10.1038/scientificamerican0509-50
- Zoller, U., Goldenberg, L.C. and Melloul, A.J. (1998) The Short-Cut Enhanced Contamination of the Gaza Strip Coastal Aquifer. Water Research, 32, 1779-1788.
- Israel Hydrological Service Report (2003) Development of Groundwater Resources in Israel up to Autumn 2002. Hydrological Service, Jerusalem, 5/01, 300 p. (In Hebrew)
- Appleyard, S. (1995) The Impact of Urban Development on Recharge and Groundwater Quality in Coastal Aquifer in Perth, Western Australia. Hydrogeology Journal, 3, 65-75. http://dx.doi.org/10.1007/s100400050072
- Goldenberg, L.C., Melloul, A. and Zoller, U. (1996) The “Short-Cut” Approach for the Reality of Enhanced Ground- water Contamination. Journal of Environmental Management, 46, 311-326. http://dx.doi.org/10.1006/jema.1996.0024
- Lal, R. (1996) Deforestation and Land-Use Effects on Soil Degradation and Rehabilitation in Western Nigeria. III. Runoff Soil Erosion and Nutrient Loss. Land Degradation & Development, 7, 99-119. http://dx.doi.org/10.1002/(SICI)1099-145X(199606)7:2<99::AID-LDR220>3.0.CO;2-F
- Albaladejo, J., Martinez-Mena, M., Roldan, A. and Castillo, V. (1998) Soil Degradation and Desertification Induced by Vegetation Removal in a Semi-Arid Environment. Soil Use and Management, 14, 1-5. http://dx.doi.org/10.1111/j.1475-2743.1998.tb00602.x
- Cabanes, C., Cazenave, A. and Le Provost, C. (2001) Sea Level Rise during Past 40 Years Determined from Satellites and in Situ Observations. Science, 294, 840-842. http://dx.doi.org/10.1126/science.1063556
- Porat, I. (2004) Influence of Sea Level Rise on Israel’s Coastal Aquifer. Israel Hydrological Service Internal Report, 1, 35-40. (In Hebrew)
- Muskat, L., Rosenthal, E., Ronen, D. and Margaritz, M. (1989) Organic Contaminants in the Israeli Coastal Aquifer. Environmental Quality and Ecosystem Stability, Proceedings of 4th International Conference of the Israel Society for Ecology and Environmental Quality Sciences, Jerusalem, 4-A, 471-477.
- Mitchell, J.G. (1996) Our Polluted Runoff. National Geographic Magazine, 189, 106-125.
- Melloul, A.J. and Wollman, S.H. (2009) Qualitative Hydrological and Land-Use Planning Tools for the Israel Coastal Aquifer. Science of the Total Environment, 309, 1-17.
- Melloul, A.J. and Collin, M.L. (2001) A Hierarchy of Groundwater Management, Land-Use, and Social Needs Integrated for Sustainable Resource Development (Part b). Environment, Development and Sustainability, 3, 45-59. http://dx.doi.org/10.1023/A:1011420206575
- Melloul, A.J. and Goldenberg, L.C. (1997) Monitoring of Seawater Intrusion in Coastal Aquifers: Basics and Local Concerns. Journal of Environmental Management, 51, 73-86. http://dx.doi.org/10.1006/jema.1997.0136
- Melloul, A.J. and Zeitoun, D.G. (1999) A Semi-Empirical Approach to Seawater Intrusion Monitoring in Israel’s Coastal Aquifer, Chapter 16. In: Bear, J., Cheng, A.H.D., Sorek, S., Ouazar, D. and Herrera, I., Eds., Theory and Applications of Transport in Porous Media: Seawater Intrusion in Coastal Aquifers-Concepts, Methods and Practices, Environmental Science & Engineering, Springer, New York, 543-557.
- Melloul, A.J. (2004) Sea Water Rise and Its Impact on the Israel Coastal Aquifer. Agamit Water in Our Country Jour- nal, 168, 6-8. (In Hebrew)
- Rahmstorf, S. (2012) Global Warming and Climate Change—Greenhouse Gases: Modeling Sea Level Rise. Nature Education Knowledge, 3, 11.
- Melloul, A.J. and Goldenberg, L.C. (1994) Groundwater Pollution by Airborne Toxic Contaminants: A Factor to Be Considered in Groundwater Management. Groundwater Quality Management, 93, 95-105.
- US Environmental Protection Agency (1985) DRASTIC: A Standard System for Evaluating Groundwater Potential Using Hydrogeological Settings. NWWA/EPA Series, Washington DC, 163 p.
- Preller, R.H., Posey, P.G., Maslowsky, D. and Pham, T.C. (2002) Ice Prediction Systems. Oceanography, 15, 44-56. http://dx.doi.org/10.5670/oceanog.2002.35
- World Wildlife Foundation (2012) Arctic Climate Change, Melting of Glaciers, Ice Caps, and Polar Sea Ice. Arctic Climate Change, 6. http://wwf.panda.org/what_we_do/where_we_work/arctic/what_we_do/climate/
- (2005) Service hydrographique et Oceanographique de la marine. http://fr.wikipedia.org/wiki/Service_hydrographique_et_oc%C3%A9anographique_de_la_marine http://www.ens-lyon.fr/Planet-* (In French)
- Sagan, C. (1980) Cosmos. 79, 320.
- Bell, R.E. (2008) The Unquiet Ice. Scientific American, 298, 60-67. http://dx.doi.org/10.1038/scientificamerican0208-60
- Climate Dialogue (2013) Melting of Glaciers and Icecaps—An Extended Summary of the Climate Dialogue on Arctic Sea Ice. 20.
- Sigurdsson, H. (1999) Melting the Earth. Oxford University Press, Oxford, 136-152.
- Winchester, S. (2003) Krakatoa. Harper, New York, 98-114.
- Bryant, E. and Nott, T. (2001) Geological Indicators of Large Tsunamis in Australia. Natural Hazards, 24, 231-249.
- International Groundwater Resources Assessment Centre (2005) Sudden Seawater Dynamics—Tsunamis and Hurricanes. 8. http://www.un-igrac.org/publications/135
- (2013) National Oceanic and Atmospheric Administration, Center for Tsunami Reseach. http://www.tsunami.noaa.gov/tsunami_story.html
- Forkasiewickz, J. and Margat, J. (1982) L’exploitation des rיserves d'eau souterraine en zones aride etemi aride: Essai de synthese. Bulletin du BRGM, 3, 115-126.
- Gornitz, V. (1991) Global Coastal Hazards from Future Sea Level Rise. Palaeogeography, Palaeoclimatology, Palaeoecology, Global and Planetary Change Section, Elsevier Science Publishers, Vol. 89, 379-398. http://dx.doi.org/10.1016/0031-0182(91)90173-O
- World Data Bank, The World Bank Gross Domestic Product (2007) Correlation of Population Numbers and Total CO2 Emission per Capita. 16.
- Melloul, A.J. and Goldenberg, L.C. (1993) The Rainy Winter of 1991/92 and Its Influence on the Groundwater Quality in the Coastal Plain Aquifer of Israel. Water and Irrigation Journal, 319, 51-54. (Hebrew)
- Melloul, A.J. and Goldenberg, L.C. (1994) Groundwater Pollution by Airborne Toxic Contaminants: A Factor to Be Considered in Groundwater Management, Groundwater Quality Management. In: Kovar and Soveri, Eds., Groundwater Quality Management, IAHS Publication No. 220, 95-105.
- McKibben, B. (2007) Carbon’s New Math: To Deal with Global Warming, the First Step Is to Do the Numbers. National Geographic Magazine, 212, 33-37.
- Ohmura, A., Lang, H., Lenoble, J. and Geleyn, J. (1989) Secular Variation of Global Radiation in Europe. In: Current Problems in Atmospheric Radiation, Deepack Publ., Hampton, 298-231.
- Stanhill, G. and Cohen, S. (2001) Global Dimming: A Review of the Evidence for a Widespread and Significant Reduction in Global Radiation with Discussion of Its Probable Causes and Possible Agricultural Consequences. Agricultural and Forest Meteorology, 107, 255-278. http://dx.doi.org/10.1016/S0168-1923(00)00241-0
- Pinhas, A., Pavel, K., Yoram, J.K. and Schwarzbard, R. (2005) Global Dimming or Local Dimming Effect of Urbanization on Sunlight. Geophysical Research Letters, 32, 4.
- Jancovici, J. (2008) Le rechauffement climatique: Quelques notions elementaires de physique: Qu’est ce que l'effet de serre. 6 p. http://www.manicore.com/documentation/serre/physique.html (In French)
- Mc Bean, G. (2004) Climate Change and Extreme Weather: A Basis for Action. Natural Hazards, 31, 177-190.
- (2013) Intergovernmental Panel on Climate Change. https://www.ipcc.ch/report/ar5/wg1/docs/WGIAR5_SPM_brochure_en.pdf
- Shirman, B. (2001) Israel Coastal Sea Level Changes between 1958 and 1991. Israel Survey Report, RD4/1.17. http://www.pol.ac.uk/PSML/
- Melloul, A.J. and Collin, M.L. (2005) Seawater Rise and Its Adverse Input on Stressed Coastal Aquifers and Their Groundwater Reserves. In Section 4: Coastal and Estuarial Problems. In: Cunha, M. de Conceic’o, Brebbia, C.A., Wessex, A., Eds., Water Resources Management III, Wessex Institute of Technology, 184-192.
- Melloul, A.J. and Collin, M.L. (2005) Mediterranean Sea Level Rise and Its Impact on Seawater Intrusion and the Permanent Reserves of Israel’s Coastal Aquifer. Israel Hydrological Service Internal Hydro Report, Jerusalem, 2005/5.
- Zwingle, E. (2002) MegaCities-Challenges for Humanity. National Geographic Magazine, November 2002.
- Stix, G., et al. (2006) Energy’s Future—Beyond Carbon. Scientific American Magazine, 295, 1-94.
- Vaccari, D.A. (2009) Phosphorus—A Looming Crisis. Scientific American, 300, 42-47. http://dx.doi.org/10.1038/scientificamerican0609-54
- Govindasamy, C. (2011) Deforestation, Intensive Agriculture, and Wetland Deterioration. International Journal of Plant, Animal, and Environmental Science, 1, 13.
- Warne, K. (2007) Forests of the Tide (Mangroves). National Geographic Magazine, 211, 132-151.
- Rosen, D.S. (2002) Long-Term Remedial Measures of Sedimentological Impact Due to Coastal Developments on the Southeastern Mediterranean Coast. Littoral, the Changing Coast EUROCOAST/EUCC, Eurocoast, 2, 322-331.
- PaPay, M. (2004) Coasts of Israel, Sea Level Rise and the Situation of Mediterranean Sea Coasts. Report 5, Society of Nature Protection and the Coast, Jerusalem, 65. (In Hebrew)
- Global Information (1996) Bathymetry, Topography, and Relief. http://www.intermargins.org/maps/bathymetry.htm
- Caires, S. and Sterl, A. (2003) Waves Maps Based on Data from Topex-Poseidon Satellite. Journal of Geophysical Research: Oceans, 108.
- Barras, J.A. (2007) Satellite Images and Aerial Photographs of the Effects of Hurricanes Katrina and Rita on Coastal Louisiana. Waves-Effect of Hurricane Katrina on New Orleans LA, USGS Data Series 281, 14.
- (2005) Tides, between Sky and Earth (in French) http://www.cosmovisions.com/CT.marees.htm
- Brunn, P. (1983) Review of Conditions for Uses of the Bruun Rule of Erosion. Coastal Engineering, 7, 77-89. http://dx.doi.org/10.1016/0378-3839(83)90028-5
- Morris, C. (1964) The Rights and Duties of Beasts and Trees: A Law Teacher’s Essay for Landscape Architects. Journal of Legal Education, 17, 186-192.
- Pew Research (2014) Global Population Estimates by Age: 1950-2050. http://www.pewglobal.org/2014/01/30/global-population/
- US Census Bureau (2006) Total Mid-Year Population of the World, 1950-2050. http://www.census.gov/ipc/www/worldpop.html
- Skurie, J. (2013) Population Growth Rate—Moderate Global Population Growth Expectations. National Geographic Daily News, 11 July 2013, 15.
- Rummel, R.J. (1976) Gross Domestic Product—Total Energy Consumption Positively Correlated with Population and Standard of Living—Understanding Correlation. Dept. of Political Science, University of Hawaii, Honolulu, 16.
- Briassoulis, H. (2000) Future Land-Use Alteration to Focus upon Coastal Areas; Analysis of Land-Use Change: Theoretical and Modeling Approaches. Regional Science, Regional Research Institute, West Virginia University, Morgantown, 16.
- Wingo, L. (1975) Cities and Space: The Future Use of Urban Land. Johns Hopkins Press, Baltimore, 256 p.
- Travis, C.C. and Doty, C. (1990) ES&T Views: Can Contaminated Aquifers at Superfund Sites Be Remediated? Environmental Science & Technology, 24, 1464-1466. http://dx.doi.org/10.1021/es00080a600
- Schultz, G.A. and Hornbogen, M. (1995) Sustainable Development of Water Resources Systems with Regard to Long Changes of Design Variables, Modeling and Management of Sustainable Basin-Scale Water Resource Systems. Proceedings of Boulder Symposium, 231, 31-40.
- Pretty, J.N. (1996) Sustainability Works. United Nations Environment Program (UNEP), Our Planet. Vol. 8, 19-22.
- Lutgens, F.K. and Tarbuck, E.J. (2004) The Heat Is On—Global Warming. National Geographic Magazine, 206, 2-75.
- Aller, L., Bennet, J.H., Lehr, H. and Petty, R.J. (1985) DRASTIC: A Standardized System for Evaluating Groundwater Potential Using Hydrogeological Settings. EPA/600/2-85/ 018/r.s, Kerr Environmental Research Laboratory, US Environmental Protection Agency, Ada, 163p.
- Andersen, L.J. and Gosk, E. (1989) Applicability of Vulnerability Maps. Environmental Geology and Water Sciences, 13, 39-43. http://dx.doi.org/10.1007/BF01666570
- Horton, T. (2005) Why Can’t We Save the Bay? National Geographic, Jun 2005.
- Verger, F. (2000) The Consequences of the Seawater Rise on Low Tide Slopes. 24. (in French).
- National Weather Service (2005) The 2005 Hurricane Katrina Caused Waves More than Three Meters High. NOAA, National Hurricane Center, Storm Surge Overview, 25. http://www.nws.noaa.gov/om/assessments/pdfs/Katrina.pdf
- Gale, J.J. and Freund, P. (2006) An Assessment of the Costs and Global Impact of Potential Non-CO2 Greenhouse Gases. Netherlands Environmental Assessment Agency (NEAA), 22.
- World Population Prospects (2004) The 2004 Revision Population Data Base—Hydrological Impacts on Seasonal Sea Level Change. UN Population Div. http://www.un.org/esa/population/publications/WPP2004/2004Highlights_finalrevised.pdf
- Malthus, T.R. (1798) An Essay on the Principle of Population. Chap. 5, 39-45.
- Collin, M.L. (1995) POLLSITE Land-Use Register. Israel Hydrological Service, Hydrological Report, Jerusalem, Vol. 2, No. 95, 35 p.
- (1992) United Nations Conference on Environment and Development (UNCED), Rio de Janeiro. http://www.un.org/documents/ga/conf151/aconf15126-1annex1.htm
- United Nations Conference on Environment and Development (UNCED) (2012) Canada and the Kyoto Protocol. http://en.wikipedia.org/wiki/Canada_and_the_Kyoto_Protocol
- .
NOTES

*Corresponding author.