Smart Grid and Renewable Energy
Vol. 4 No. 1 (2013) , Article ID: 28141 , 14 pages DOI:10.4236/sgre.2013.41013
Modeling, Control & Fault Management of Microgrids
![]()
1Department of Electrical Engineering, Sahand University of Technology, Tabriz, Iran; 2Saman Gostar Company (Distributor of SANTERNO, Italy), Tehran, Iran; 3Department of Electrical Engineering, Iran University of Science and Technology, Tehran, Iran.
Email: M_Moradian86@yahoo.com, info@sgt-group.com, Sajadmoradian@yahoo.com
Received September 11th, 2012; revised November 13th, 2012; accepted November 20th, 2012
Keywords: Microgrid; Decentralize Control; Wind Energy Conversion System; Microturbine; Solar Cell
ABSTRACT
In this paper, modeling and decentralize control principles of a MicroGrid (MG) whom equipped with three Distributed Generation (DG) systems (consist of: Solar Cell System (SCS), MicroTurbine System (MTS) and Wind Energy Conversion System (WECS)) is simulated. Three arrangement of load changing have investigated for the system. In first one the system doesn’t have transfer of power between MG and grid. In other two arrangements system have transfer of power between MG and utility grid. Of course in third case transfer of power between DG resources is considerable. Case study system is equipped by energy storage devices (battery bank) for each DG’s separately by means of increasing the MG reliability. For WECS and SCS, MPPT control and for MTS, voltage and frequency (V&F) controller has designed. The purpose of this paper is load respond in MG and storage process of surplus energy by consider of load changing. MATLAB/Simulink and its libraries (mainly the Sim Power Systems toolbox) were employed in order to develop a simulation platform suitable for identifying MG control requirements. This paper reported a control and operation of MG in network tension by applying a three phase fault.
1. Introduction
Microgrid concept widely developed in countries such as USA, Canada, Japan and UK. It has been investigated and implemented [1,2]. The increase in researches due to benefits of this type of networks including provide the reliability and security of network and loads, high efficiency, environmentally friendly and self-healing [3]. In today’s power systems, very large problems including electricity production cost and also reduce of fossil fuel, on the other hand, the increasing pollution created from burning oil and gas and dramatically growth of demands has been increase the greenhouse gases in the air which is considered as a big threat for ozone layer. Because electricity costs much less and in some cases is zero (for DG Resources), so in today’s power systems used distributed energy resources (e.g. wind and sun are free resources to generate electricity). Another advantage of smart grid which it should be mentioned is loss reduction caused by power transmission line. Because one of the goals in smart grids is producing power by distributed energy resources and removed the power plant as much as possible. So with this, the line power flowing and its corresponding losses can be reduced to acceptable level. In recent years, many researches about structure, control and implementation of smart grids has been worked in laboratories. Control of MG and performance of energy storages have close relationships, which in this paper have been reviewed. By energy storage MG control can be more easily and the system reliability can be increased. A MG is a connection of distributed energy resources like: wind energy conversion, microturbine, fuel cell, PV arrays, Combined Heat and Power (CHP) and energy saving factors such as flywheel, batteries or Uninterruptable Power Supply (UPS) and power capacitors in low voltage power systems [4].
Basic structure of a typical MG is shown and discussed in [5].
Here is assumed that distributed generation sources have the ability to respond the loads. After disappearing network fault, synchronization operation performed and isolated network connected to Utility Power Source again [6].
In reference [7] a very simple scheme of a MG with three DG resources has been studied. In the article that was published in 2010, there is no mention and have not been analyzed the: DG resources structure, controllers of each micro source, fault occurrence in the grid and reaction of MG against the sudden event and also transferred power between DG’s.
Note that the decentralized control means that on each DG resources has been an independent controller and each of this resources performed control operations independently. May be the type of applied controller is different and even similar. Fault events that may lead to islanding of a distribution system are discussed in [8]. The work described in this paper regards the simulation and control of the MG equipped by three distributed energy storage device and local loads. Used distributed generations in this paper are consists of: WECS, SCS (with MPPT control strategies), and MTS (with voltage and frequency control strategy). The robustness of the tested control strategies were studied for disturbances taking place in the utility network, followed by a forced islanding of the MG. Experimental tests for islanding and synchronization were presented in [9]. Islanding of the MG can take place by unplanned events like faults in the utility network or by planned actions like maintenance requirements.
2. Structure of Distributed Generation Systems
In Figure 1 the general structure of a micro-distribution network is shown. The input power producing by distributed generation resources converted to electrical energy for network and load requirements. Control tasks are divided into two parts:
1) Input-Side Controller: which should be possible to take the maximum power from the input source. Naturally, the protection of input side converter must be in considered.
2) Grid-Side Controller: that can follow these tasks: a) Input active power control derived for network; b) Control of the reactive power transferred between network and micro-grid; c) DC link voltage control; d) Synchronization of network; e) Assurance of power quality injected to the network. Generally the network controller position is VSI, which both amplitude and phase of the output voltage are controlled. All items listed above are the basic features for the grid-side controller that these converters should have. Studied network in this paper consists of two distributed generation sources, which is briefly explains their structure.
3) Microgrids Internal Structure: According to given system studied in this article is including distribution generating resources of PV and MT. The structure of this two system and their relevant controlling parts are shown below. It is noteworthy that PV and Fuel Cell (FC) systems have similar hardware structures [10,11].
3.1) Photovoltaic and FC systems: As previously noted the PV and FC hardware structure is similar. Although voltage or current by FC and PV is low, but by binding a set of them together can increase the production levels and also can increase or decrease the voltage level by using DC-DC converters such as boost converter for increasing the voltage level.
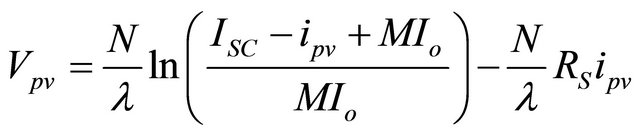
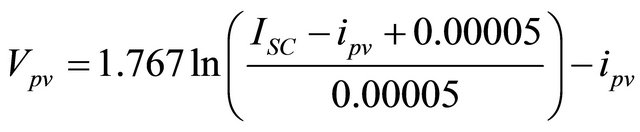
Non-linear relationship between  obtain from the below equation [12].
 (1)
(1)
Which in it  is short circuit current,
  is reverse saturation current,
  is series resistance and
  is constant factor which is depends on the type of materials used in cell.
In this paper a silicon solar panel, ( ) has been used. Sample model is constructed by Iranian Optical Fiber Fabrication Company (OFFC) that related table of its coefficients and parameters comes to Table A1 [13].
According to related values Equation (1) is written as follows:
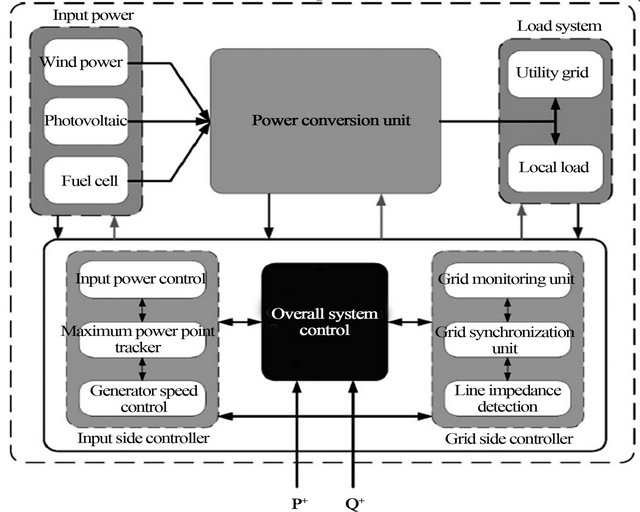
Figure 1. Topology of smart systems control.
 (2)
(2)
Non-linear characteristics of 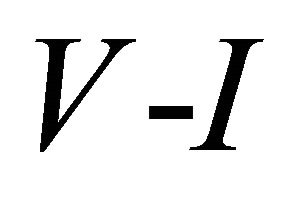 and
and 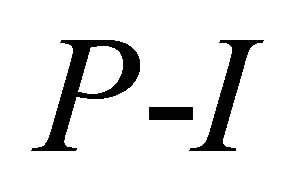 are shown in Figure 2.
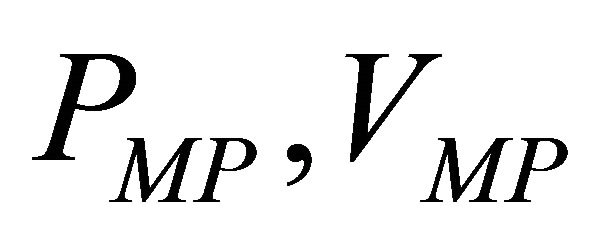 are known as power and voltage of maximum power in
  cell. These Curves are:
By changing temperature, the coefficients will changes [12]. Two samples of these changes are estimated in Equations 3-a (70˚C) and 3-b (−20˚C).
 (3-a)
(3-a)
 (3-b)
(3-b)
For displaying MPPT technique in  we act the way [14]: cell voltage with corresponding maximum power production by considering the open circuit voltage for different temperature show a dependency.
 (4)
(4)
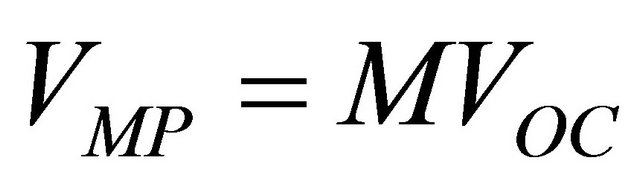
This equation shows MPPT technique which in it  called voltage factor that for OFFC its value considered 0.71. This method for maximum power estimating is simple and fast.
Equivalent circuit to  cell block shown in Figure 3(a) which the related equation to non-linear
  relationship is placement. Also a delay function to limit the current of rapid response to voltage controlled source and to improving the convergence responses is used.
For VMPPT its related equivalent circuit shown in Figure 3(b). This block will calculate the open circuit voltage (By using  and Equation (2)), then comprised it with PV output voltage and produces the fire command for the PWM block. The delay shown here is the same reason as in Figure 3(a).
Now we want to see the performance of this system in
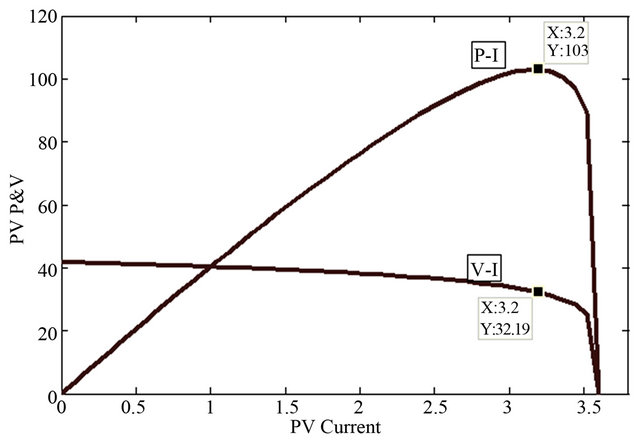
Figure 2. Non-linear characteristics of V-I and P-I.
connected to the grid-connected mode and with applying a controller in AC part according to what is seen in Figure 4. After increasing the voltage level by boost, we paralleled it by energy storage devices (That somehow we can call them UPS). We do this in order to increase reliability of system. Now it is necessary that DC voltage produced by inverter becomes AC. The purpose of the grid-side controller is to maintain DC link voltage at a constant value regardless production power range.
Vector control in a rotating reference frame with the line voltage vector is used. The purpose in this controller is regulation of DC voltage and reactive power control. Using the Park conversions, voltage equations can be controlled to reference frame d-q. The idea of control is taken from [10].
Figure 5 shows simulated model of grid-side controller. PI standard controllers are used in order to regulate the line current in rotational synchronous frame in internal control loop and DC voltage in external loop.
 is active part of current and
  is reactive section on current. In order to obtain a transformation from active power, the value of current reference
  (reactive part) considered as zero. PLL used in figure is to synchronize converter frequency with main grid. It is assumed that the harmonics produced by switching is zero.
3. Structure And Mts Control Model
Recently microturbines have been much attention because of their small size, relative low cost, repair and cheap maintenance and relatively simple control. Different dynamic models have been discussed for micro-turbines by Rowen, Hannet, Saha and Nern for combustion gas turbine [15-17]. In 1993 mathematical method of gas turbine by Rowen was developed [15]. While in 1993, Prime Mover Working Group by considering the control of speed, acceleration, fuel and temperature made this model wider [16]. MT used in this article is a small combustion turbine with an installed capacity 25 to 500 KW and a high rotation speed (between 50,000 to 120,000 rpm). This model includes the speed governor,
 (a)
(a) (b)
(b)
Figure 3. Equivalent circuit of (a) PV cell (b) VMPPT.
Figure 4. SCS in grid-connected mode and applying grid-side controller.
Figure 5. Equivalent circuit of grid-side controller.
acceleration control block, fuel system control and temperature control. Single-shaft turbine model is considered. Power producer with a Permanent Magnet Synchronous Generator (PMSG) has two poles and smooth poles rotor. Because of high speed shaft, generators of an AC voltage source will be a high frequency (frequency angular higher than 100,000 rad/sec) [17]. Since turbines moves at high speed, so AC generator is a high-frequency generator which cannot be directly coupled the AC network [18]. One way to model a system of distributed generation MT, based on all classification system are three following separate parts [19,20]:
1) Module 1: mechanical system of turbine and fuel.
2) Module 2: PMSG and AC/DC rectifier and energy storage devices.
3) Module 3: AC/DC voltage source inverter, PWM controller.
Mechanical Model and MT Control Functions:
Based on Rowen and Hannet model, we examine the MT model. Dynamic equations of MTS in [15] are investigated.
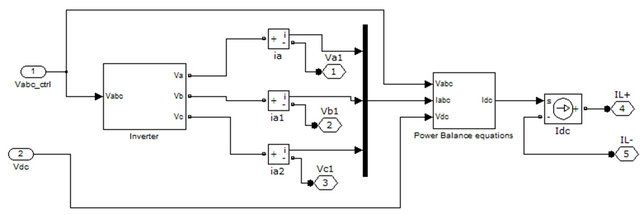
According to the principle of energy conversion and ignore the inverter losses, total of instantaneous powers in output of AC terminal must be equal to the instant powers in dc terminal like.
 (5)
(5)
Which  and
and  are dc link voltage and current.
VSI simplified model shows in Figure 6(a). The inverter which used in this essay is hysteresis model.
Diagram block of V&F controlling model presented in Figure 6(b). ![]() and
and  are reference amounts. In order to have unit power factor, the amount of
  is zero and
 ![]() is 1 p.u. Voltage and frequency (V&F) control has to regulate the voltage value at the Point of Common Coupling (PCC) and also the frequency of the whole grid.
is 1 p.u. Voltage and frequency (V&F) control has to regulate the voltage value at the Point of Common Coupling (PCC) and also the frequency of the whole grid.
Now MT model of distributed generation in gridconnected mode is shown in Figure 7. The produced frequency by inverter will have the equal amount of 50 Hz corresponding to the network.
LCL Filters in this paper is designed by the idea in [21,22].
 (a)
(a)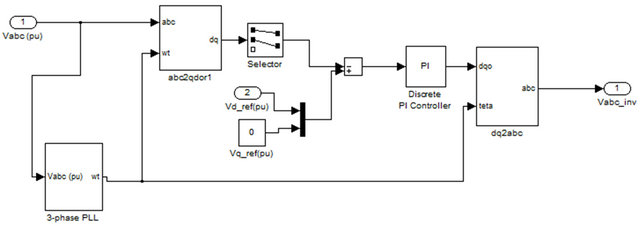 (b)
(b)
Figure 6. Bolck diagram of MTS components; (a) VSI simplified model; (b) Diagram block of V&F controlling model.
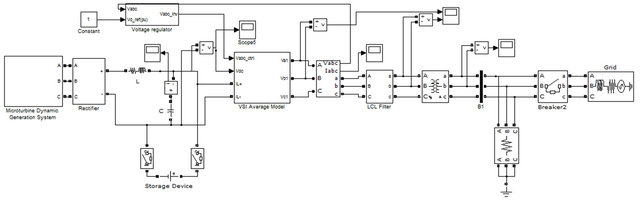
Figure 7. The general model of MTS in grid-connected mode.
Conceptual and technical solution of MG is presented in [23,24].
4. Structure and WECS Control Model
Electrical wind generators are the equipment who converts wind to electrical energy. Different types of generators are used in wind turbines. For example small sized wind turbines are equipped by DC generators with capacity up to 90 kw (from 10 to 90).
In wind turbines modern systems three phase AC generators are customs [25].
General kind of AC generators who are used in modern wind turbines are:
1) Squirrel Cage Induction Generator (SCIG)
2) Wired Rotor Induction Generator (WRIG)
3) DoubleFed Induction Generator (DFIG)
4) Synchronous Generators with output excitation (SG)
5) Permanent Magnet Synchronous Generator (PMSG)
Synchronous Generator is a kind of generators who are used in some researches [26,27]. These generators could connect to wind turbine without any gearbox. These benefits are attractive by consider of maintenance and limited shelf life. Synchronous generators could to excite by electric or with permanent magnet rotor. By considering the above reasons, used generator in this paper is kind of PMSG.
5. Simulation of WECS
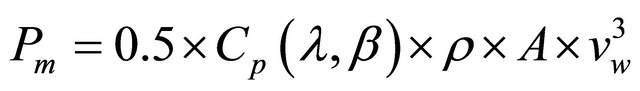
This system is modeled by equations of wind turbine as could be seen in Equations below. In this paper a variable speed wind turbine is used. Wind speed 12 m/sec is considered. The parameters value of PMSG is shown in Table A2. If the speed of wind was variable, WECS should be used the Buck/Boost converter. In this case the trigger signal should produce for two switches. This performance cause to system be complicated.
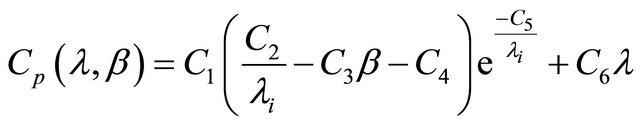
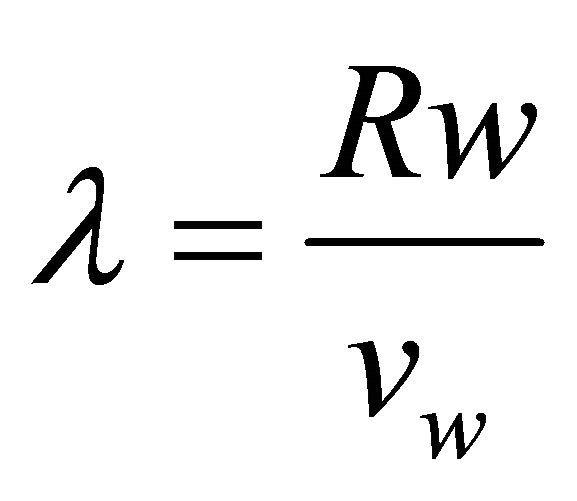
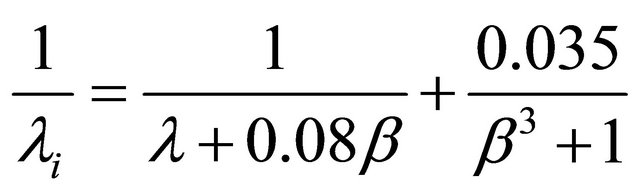
Equations for wind turbine are shown in below [28].
 (6)
(6)
 (7)
(7)
 (8)
(8)
 (9)
(9)
Output mechanical power in watt is shown in Equation (6). In this equation,  air density in (kg/m3), Cp, performance coefficient,
  wind speed in m/sec,
 ![]() , tip speed ratio,
, tip speed ratio,  , pitch angle,
  , turbine swept area.
In Equation (7), the coefficients  to
to  are:
are:  and
and  [28].
[28].
In Equation (8),  is rotor radius in meter; w, angular speed in rad/sec the output torque of wind turbine is input of used PMSG.
In order to acquiring the output maximum power in WECS, we use the MPPT algorithm Figure 8.
Inverter’s in each DG’s are modeled base on SANTERNO products [29].
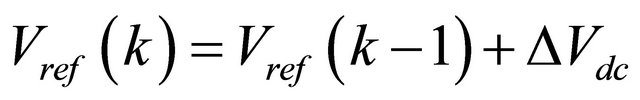
In this algorithm, the initial value adjusted for DC references voltage. Correspondingly, voltage and current will be measured. After the measurement, DC output power (Po) would be calculated. In next step, the reference voltage ought to be altered as much as dc variations . By this way:
 (10)
(10)
Then dc power will calculated with 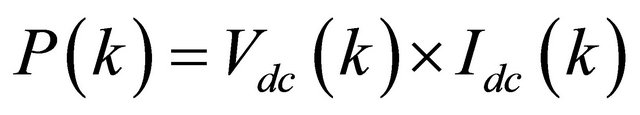 . If
. If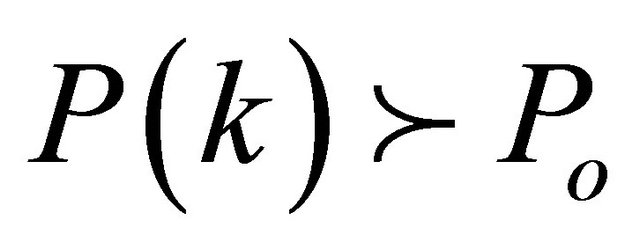 , the system output isn’t in maximum point, so accordingly the reference voltage have to rise a quantum of
 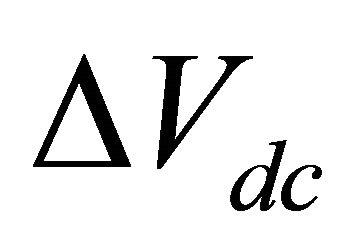 and power should compare with earlier amount
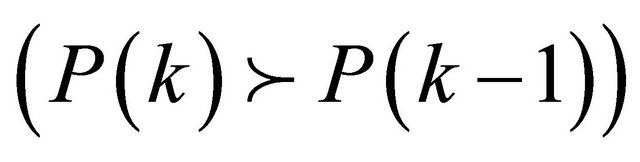 . This process continued till receiving to maximum point. Now if
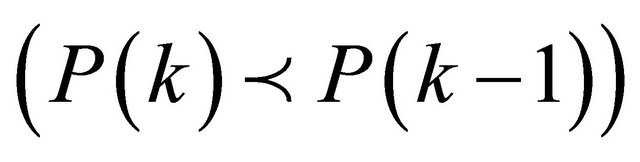 , the reference voltage should decrease.
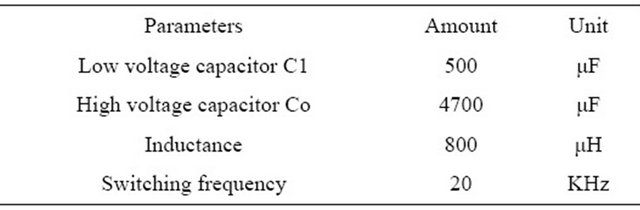
Value and parameters of boost model is shown in Table A3.
In Figure 9 MPPT block of WECS is shown. This block should produce the trigger signal of switches in DC link for tracking the maximum power.
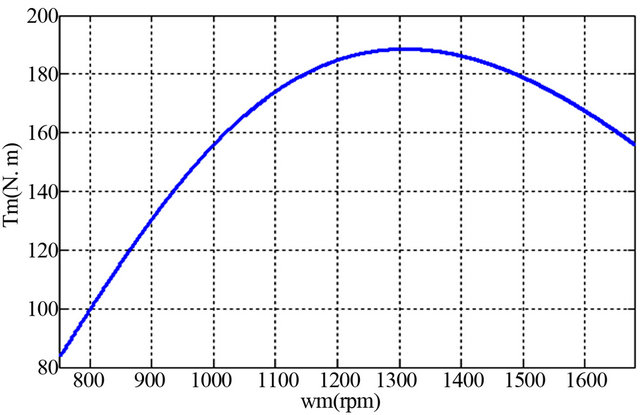
In Figure 10(a) Torque-Speed characteristics of WT is shown. Note that all of curves are in 12 m/sec wind speed.
As you see in Figure 10(b), maximum amount of power coefficient in used turbine is 0.41 and .
.
As we said, output power of WT is 7100 watt that is shown in Figure 10(d).
Produced torque of WT in system run time is 184 N.m.
DC link Voltage in battery bank terminal is shown in Figure 10(e). Voltage ripple is small. But it regulate in 243 volt. Battery bank capacity should be proportion to
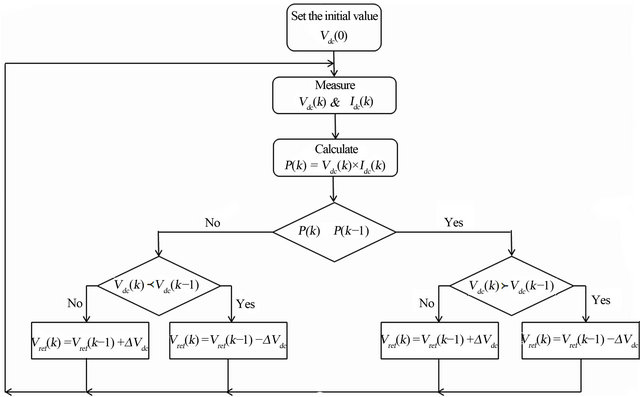
Figure 8. WECS MPPT flowchart.
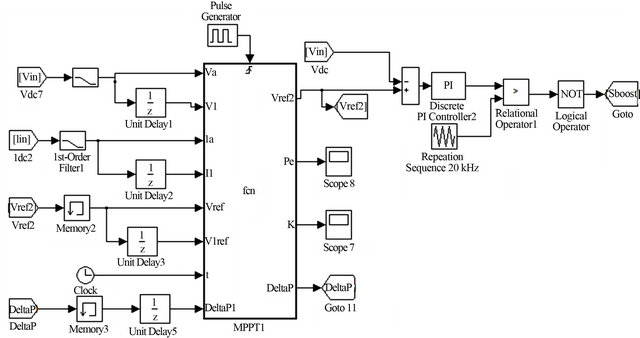
Figure 9. MPPT simulated block for WECS.
 (a)
(a)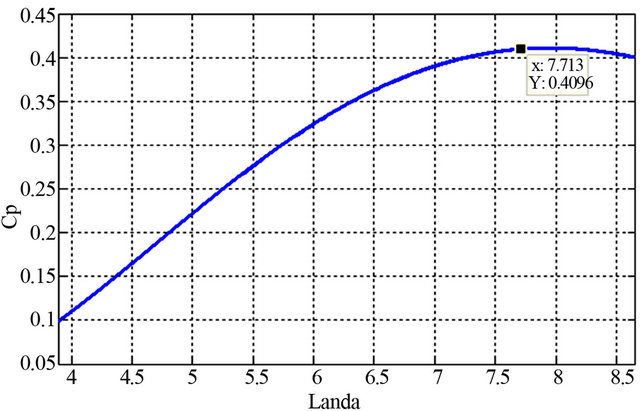 (b)
(b)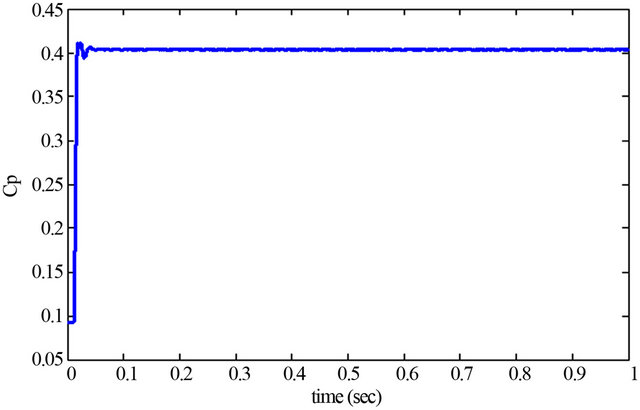 (c)
(c)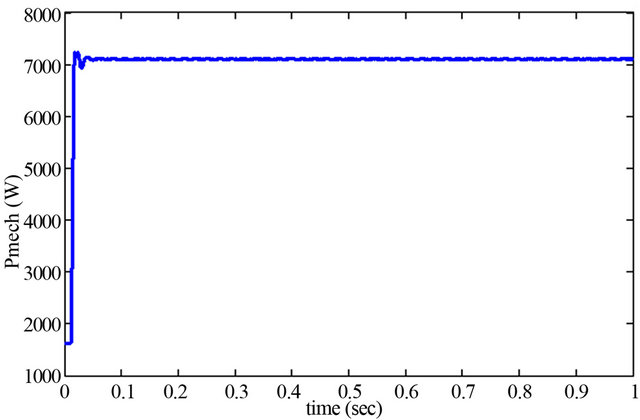 (d)
(d)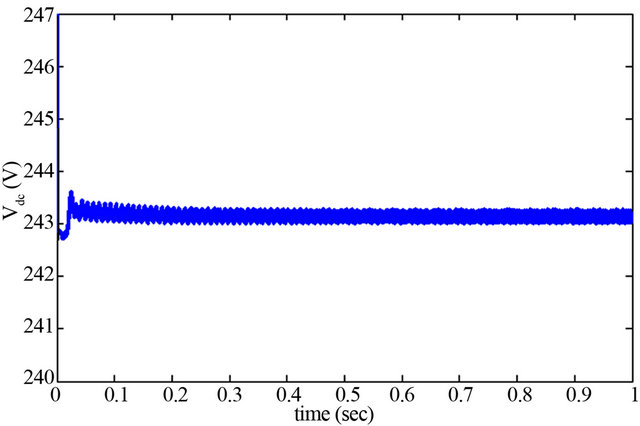 (e)
(e)
Figure 10. Output of WECS; (a) Torque-speed characteristics of WT; (b)  curve of WT; (c) Changing of power coefficient in time; (d) Produced mechanical power; (e) DC link Voltage in battery bank terminal.
produced power and connected load to the system. This signal is input of three phase inverter. In Figure 11 gridconnected WECS is simulated. In t = 0.25 sec three phase fault (phase-phase) applied and the system goes to islanding mode.
Figure 12 has shown the output voltages before/after LCL filter.
6. Simulation
As you see in Figure 13, each DG sources protect local (three-phase and balance) load, the considered load for MTS is 375 KVA, WECS is 7100 W and SCS load, 110 W. Each DG sources is equipped with an energy storage device. Because if in specifics circumstances the producers cut, storage resources can continue to support the loads. To review the islanding mode and fault management in this networks, 3 phase fault (phase-phase) applied to system and breaker (Point of Common Coupling) in moments will stop applying the fault and load and DG sources goes to islanding mode. Output shown in this case shows that in this moment DG resources are responsive to load. When the network fault disappears, part of autonomous again can be connected to the utility grid. Some of the values required in the above system are given in Appendix.
Simulation process is for three cases: 1) the case that load capacity and produced power are equal. Here the system doesn’t have any transfer of power between MG and utility grid. 2) The case that loads capacity is less than produced power. Here system has power transfer between grid and MG. 3) The case that MTS load capacity is less than its local load, SCS and WECS local loads are bigger than its produced capacity. Here the system
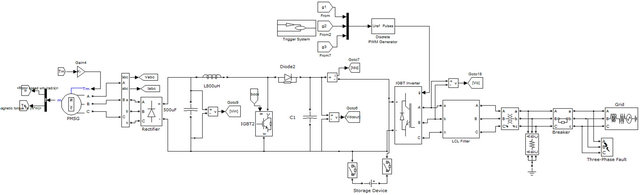
Figure 11. WECS in grid-connected mode.
 (a)
(a)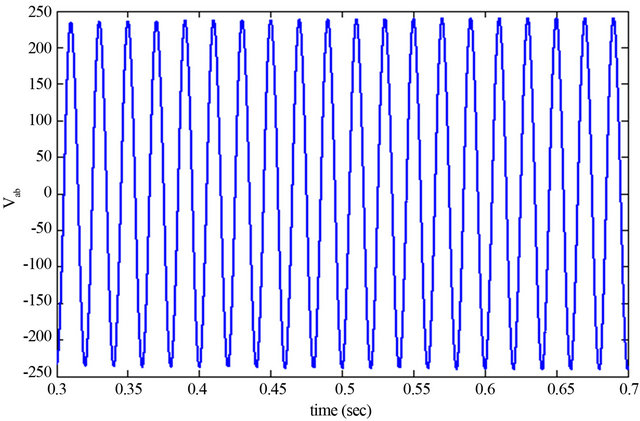 (b)
(b)
Figure 12. Output voltage of WECS (a) Before; (b) After LCL filter.
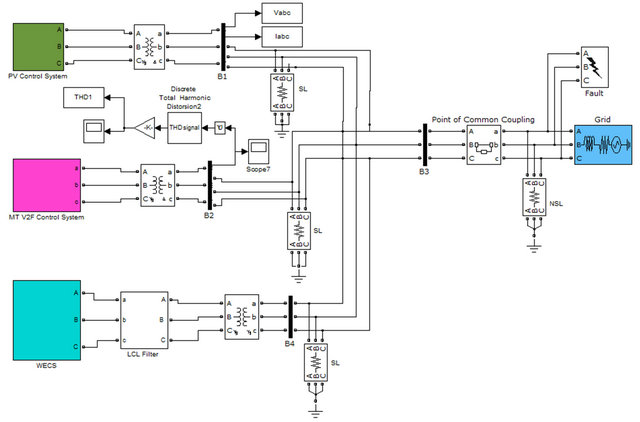
Figure 13. Case study system.
has power transfer between MG and grid. Also transfer power between DG resources is considerable.
Output curve of used PV system is shown in Figure 3. The points Corresponds to maximum power is shown in the figure.
7. Simulation Result
In this part simulated migrogrids result are displayed and investigates. First case: amount of produced power by each resources are equal with the loads toward each DG: in this case SL’s respond’s by each micro sources and we don’t have any power transfer between MG and grid. At t = 0.25 sec three phase fault applied to the system and breaker in PCC guide the system to islanding mode operation. In below curves the time before 0.25 sec is for grid-connected operation and after 0.25 sec is for islanding mode. In first case NSL isn’t connected to grid or it can support by utility grid. Load capacities are equal to produce capacity. Waveforms of the system in this case are shown in figures below.
In simulated system, SL’s are sensitive loads and NSL is non-sensitive load of system.
By using simulation, produced power waveform of PV is as follows (Figure 14(a)).
Three phase voltage of SCS is 32 v (Figure 14(b)). it means that MPPT process is done by the applied controller.
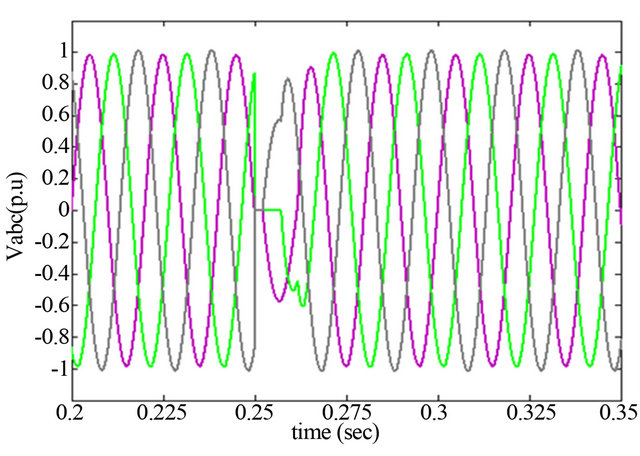
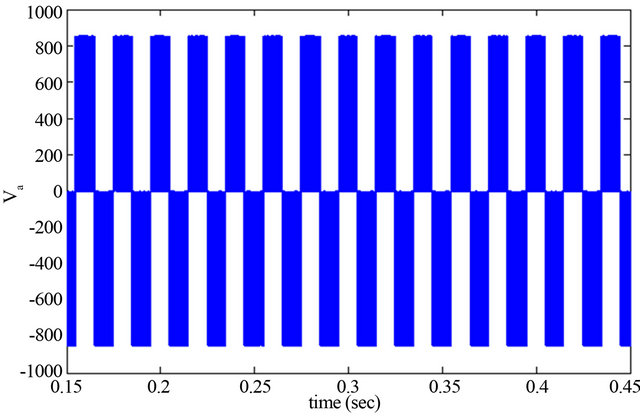
In Figure 15 the voltage and current curves shows. In this case, the system can continue to stable operation and in islanding mode the loads could responds by DG sources.
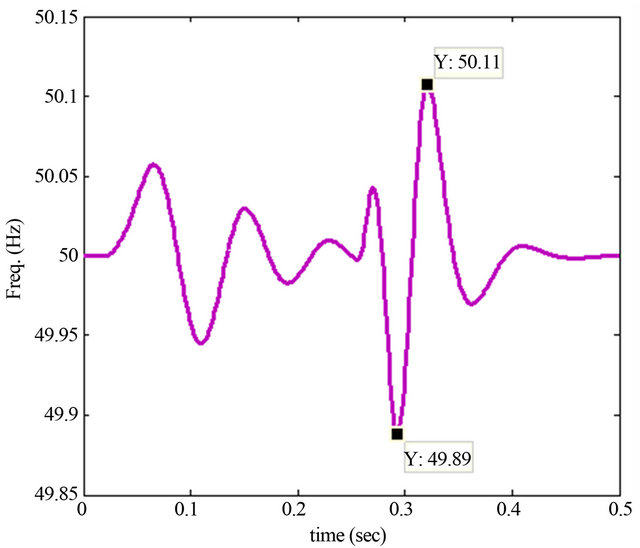
In Figure 16(b) total harmonic distortion in system output is shown. In the moment of t = 0.25 sec three phase fault applied. THD rise up to 2.035 percent (in fault time).
It can be seen in Figure 17, the network can respond to loads and we don’t have any transferred power between grid and MG.
 (a)
(a)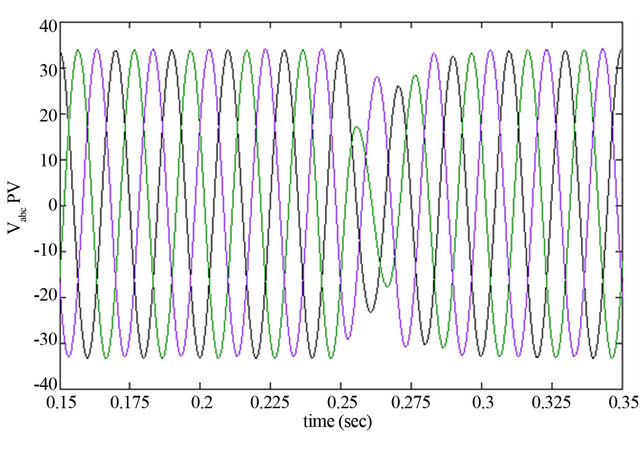 (b)
(b)
Figure 14. Output of SCS; (a) Pulled output power from the PV in DC link; (b) Three phase voltages of SCS.
 (a)
(a)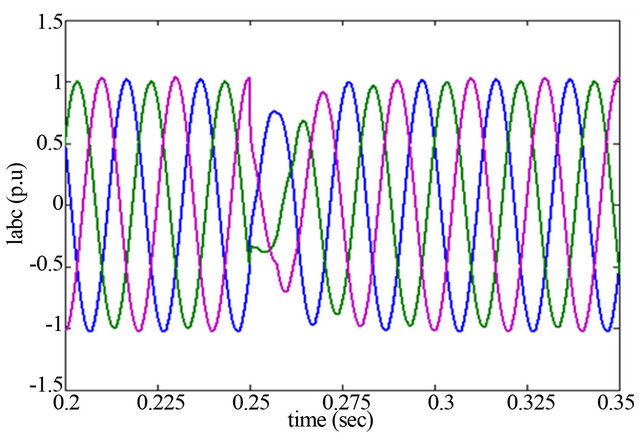 (b)
(b)
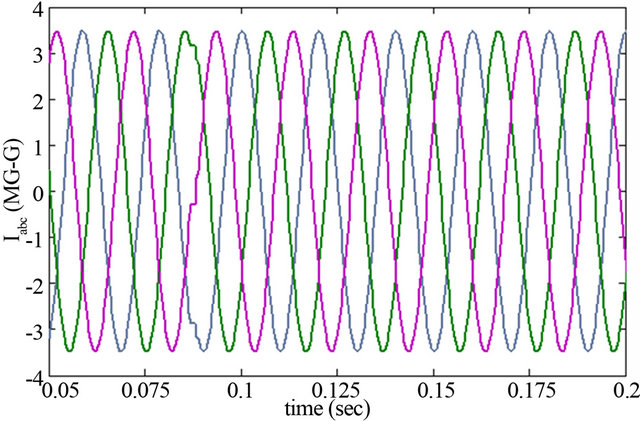
Figure 15. Voltage and current of line and loads (in p.u.); (a) Three phase voltage of line (in p.u.); (b) Line and loads three phase current (in p.u.)
 (a)
(a)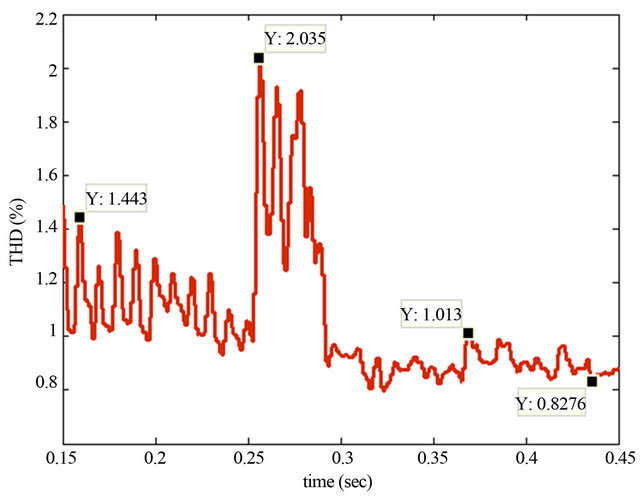 (b)
(b)
Figure 16. Frequency and THD of system; (a) System frequency changing curve; (b) Total harmonic distortion in line voltage.
 (a)
(a)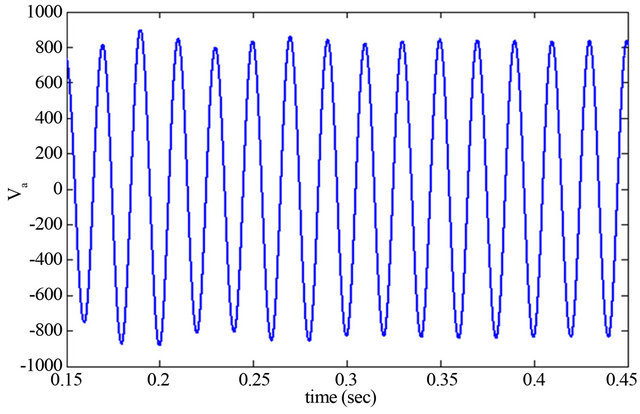 (b)
(b)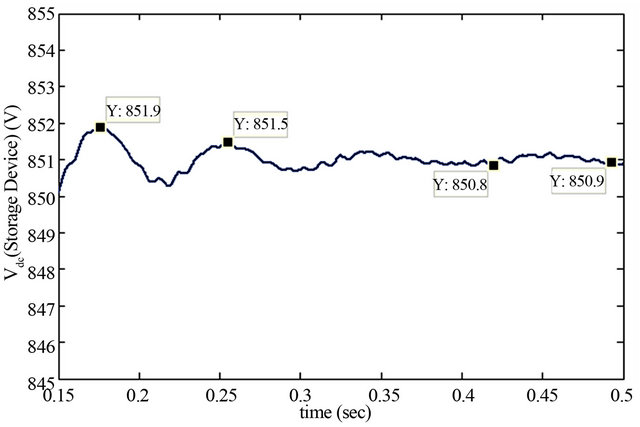 (c)
(c)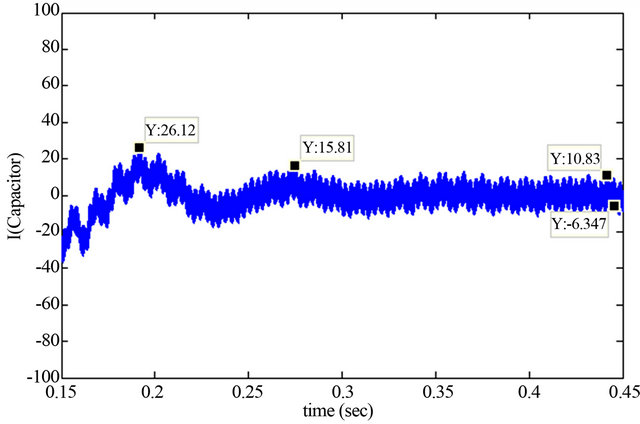 (d)
(d)
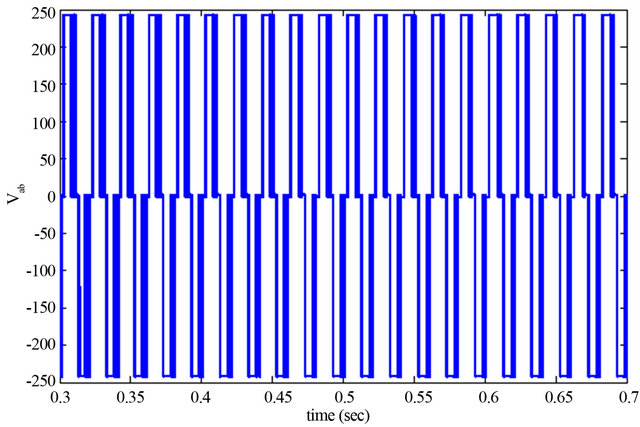
Figure 17. Terminal voltage and current toward the MT; (a) Output voltage of MT system before LCL filter; (b) Output MT system after LCL filter; (c) Terminal voltage in the battery bank; (d) Current of shunt capacitor in DC link.
Second case: non-sensitive load with 7130 watt capacity is connected to utility system. And sensitive loads are decrease by size 1130 w (SCS load 30 w, MTS load 1 kw, WECS load 100 w are decreases). We want to see and investigate the effect of these changes in the system. The outputs are like these:
In Figure 18, level of energy storage will increase after operation of breaker in PCC and fault occurrence time.
Injected current to network by each DG’s are showed in Figure 19. In third case, the PV load rise up to 130 w (30 w more than its nominal load) and WECS load rise up to 7200 w (100 w more than its nominal load and MTSs load decrease in amount of 1130 w. in this case NSL rise up to 7 kw (1 kw more than its first case). it showed that additional part of loads in the network supplies by MTS. Output of this case is showed in Figure 20.
8. Conclusion
In this paper a microgrid with three DG resources equipped by energy storage devices and grid side controllers has simulated. Control principles and modeling of the system has investigated. Output of the system displayed for three load arrangement. By means of showing load management and support of loads in developed systems, Fault management and control vision has showed. And energy storage operation in the moment of load respond and when loads have the changes has displayed. We use different controllers such as: MPPT controller (for SCS
 (a)
(a)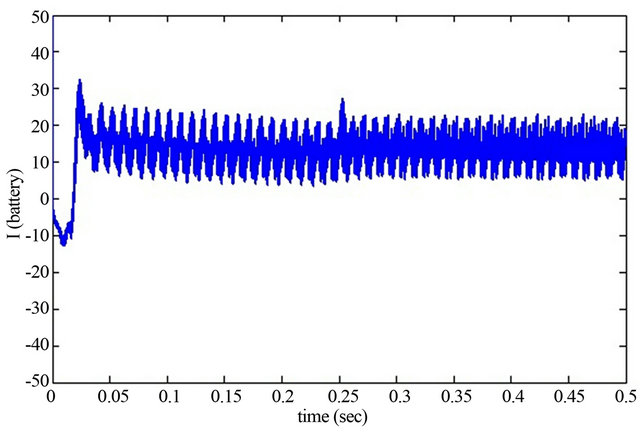 (b)
(b)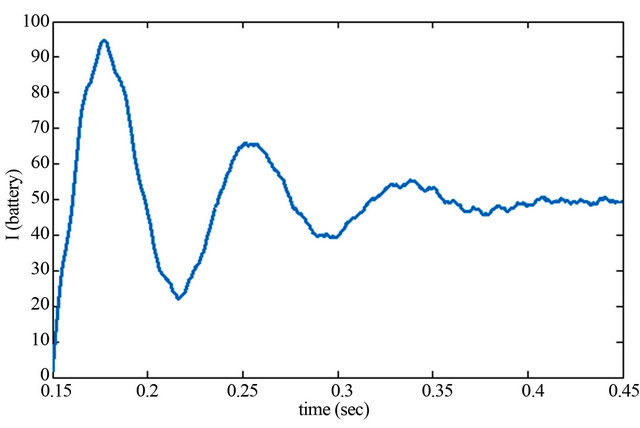 (c)
(c)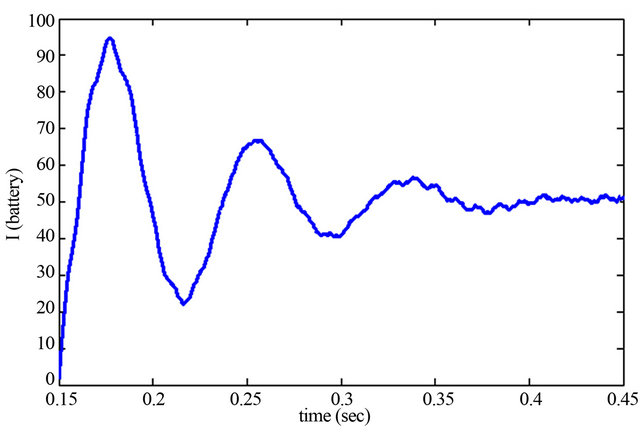 (d)
(d)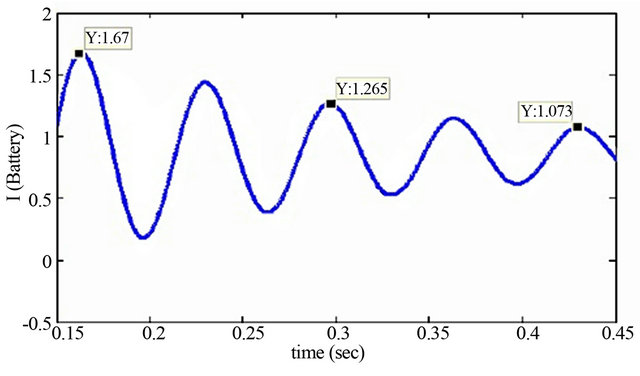 (e)
(e)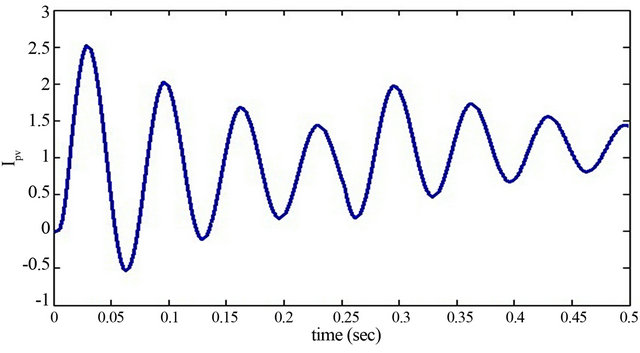 (f)
(f)
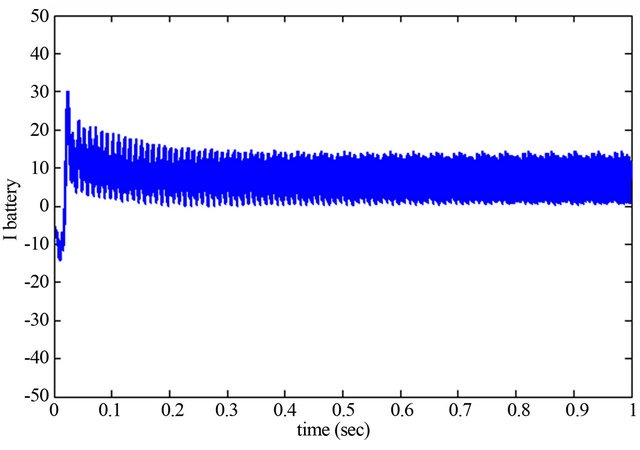
Figure 18. Storage operation in load changing condition; (a) Battery bank current of WECS in first case; (b) Battery bank current of WECS in second case; (c) Battery bank current of MTS in first case; (d) Battery bank current of MTS in second case; (e) Battery bank current of SCS in first case; (f) Battery bank current of SCS in second case.
 (a)
(a)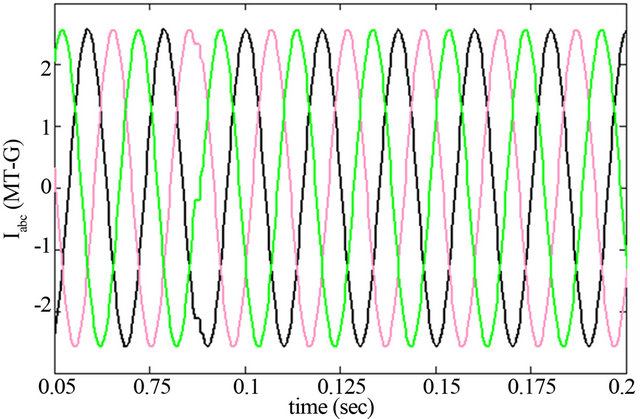 (b)
(b)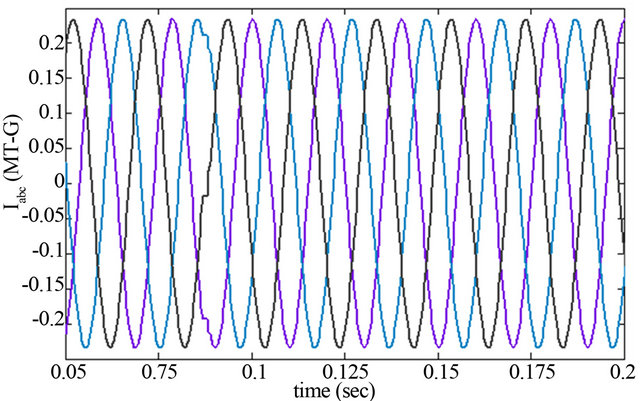 (c)
(c)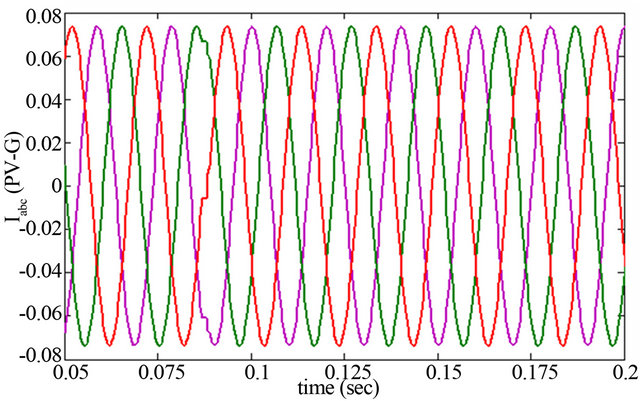 (d)
(d)
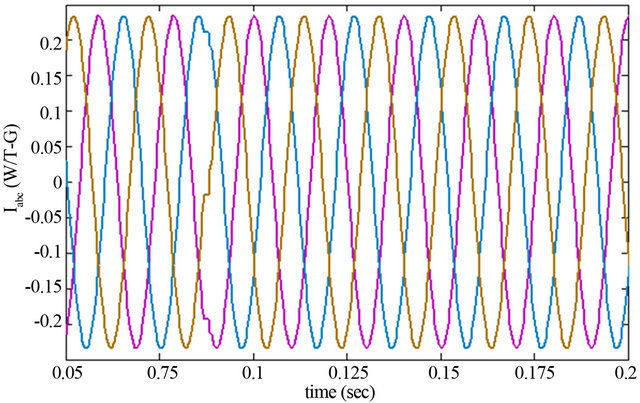
Figure 19. Second case injected current of DG’s for the grid-connected operation; (a) Transferred current between MG and grid in grid connected mode; (b) Injected current from MTS to grid; (c) Injected current from WECS to grid; (d) Injected current from SCS to grid.
 (a)
(a)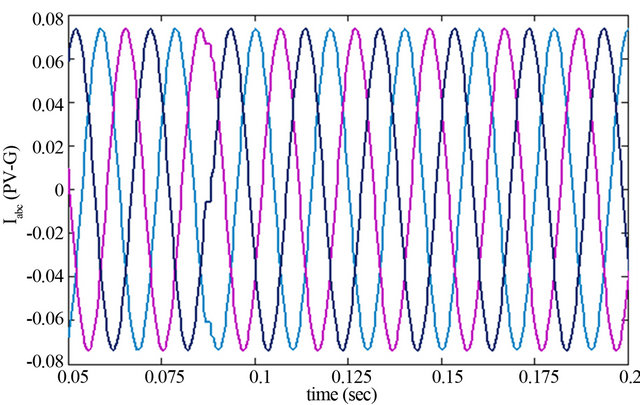 (b)
(b)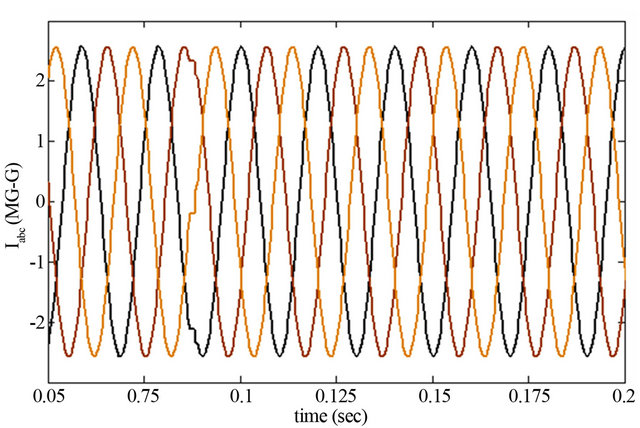 (c)
(c)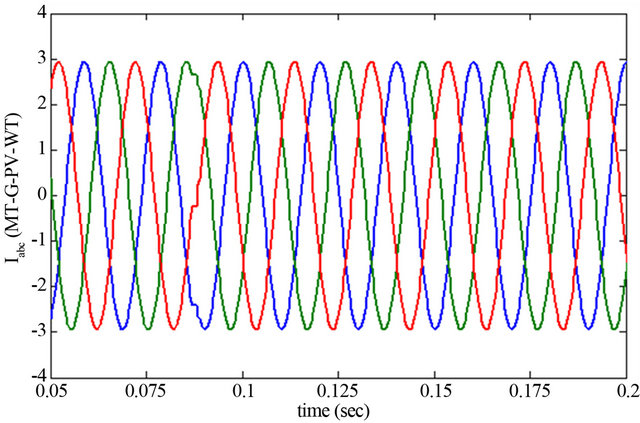 (d)
(d)
Figure 20. Third case injected current of DG’s for the grid-connected operation; (a) Injected current from MTS to WECS; (b) Injected current from MTS to SCS; (c) Injected current from MTS to grid; (d) Injected current from MTS to WECS, SCS and grid.
and WECS) and V&F controller (for MTS) in order to research about decentralize control operation and showing the effect of this kind of control. In Grid-connected and islanding mode, additional product of DG resources have stored in battery banks. Of course it could be seen that in all conditions the system can continue to stable operation and loads are in good respond condition.
REFERENCES
- B. Lasseter, “Microgrids (Distributed Power Generation),” Proceedings of the IEEE PES Winter Meeting, Vol. 1, 2001, pp. 146-149.
- N. Hatziargyriou, H. Asano, R. Iravani and C. Marnay, “Microgrids: An Overview of Ongoing Research, Development, and Demonstration Projects,” IEEE Power Energy Magazine, Vol. 5, No. 4, 2007, pp. 78-94. doi:10.1109/MPAE.2007.376583
- M. Pipattanasomporn, H. Feroze and S. Rahman, “MultiAgent Systems in a Distributed Smart Grid: Design and Implementation,” Power Systems Conference and Exposition, Seattle, 15-18 March 2009, pp. 1-8.
- Public Power Corporation, “Microgrids—Large Scale Integration of Micro-Generation to Low Voltage Grids,” Technical Annex, 2002.
- P. Piagi and R. H. Lasseter, “Autonomous Control of Microgrids,” IEEE PES Meeting, Montreal, June 2006.
- C. L. Moreira, F. O. Resende and J. A. P. Lopes, “Using Low Voltage MicroGrids for Service Restoration,” IEEE Transactions on Power Systems, Vol. 22, No. 1, 2007, pp. 395-403.
- R. Zamora and A. K. Srivastava, “Controls for Microgrids with Storage: Review, Challenges, and Research Needs,” Elsevier, Vol. 14, No. 7, 2010, pp. 2009-2018.
- F. Katiraei, M. R. Iravani and P. W. Lehn, “Microgrid Autonomous Operation during and Subsequent to Islanding Process,” IEEE Transactions on Power Delivery, Vol. 20, No. 1, 2005, pp. 248-257.
- D. Georgakis, S. Papathanassiou, N. Hatziargyriou, A. Engler and C. Hardt, “Operation of a Prototype Microgrid System Based on Micro-Sources Equipped with Fast-Acting Power Electronics Interfaces,” Proceedings of IEEE 35th PESC, Aachen, Vol. 4, 2004, pp. 2521-2526.
- F. Blaabjerg, R. Teodorescu, M. Liserre and A. V. Timbus, “Overview of Control and Grid Synchronization for Distributed Power Generation Systems,” IEEE Transactions on Industrial Electronics, Vol. 53, No. 5, 2006, pp. 1398-1409.
- M. Uzunoglu, O. C. Onar and M. S. Alam, “Modeling, Control and Simulation of a PV/FC/UC Based Hybrid Power Generation System for Stand-Alone Applications,” Renewable Energy, Vol. 34, No. 3, 2009, pp. 509-520. doi:10.1016/j.renene.2008.06.009
- Z. M. Salameh, B. S. Borowy and A. R. A. Amin, “Photovoltaic Module-Site Matching Based on the Capacity Factors,” IEEE Transactions on Energy Conversion, Vol. 10, No. 2, 1995, pp. 326-332. doi:10.1109/60.391899
- http://www.solarserver.com/yellow-pages/companies/company-search/optical-fiber-solar-cell-fabrication-company.html
- M. A. Masoum, H. Dehbonei and E. F. Fuchs, “Theoretical and Experimental Analyses of Photovoltaic Systems with Voltageand Current-Based Maximum Power-Point Tracking,” IEEE Transactions on Energy Conversion, Vol. 22, No. 8, 2002, p. 62.
- W. I. Rowen, “Simplified Mathematical Representations of Heavy Duty Gas Turbines,” Journal of Engineering for Power, Vol. 105, No. 4, 1983, pp. 865-869. doi:10.1115/1.3227494
- L. N. Hannet and A. Khan, “Combustion Turbine Dynamic Model Validation from Tests,” IEEE Transactions on Power Systems, Vol. 8, No. 1, 1993, pp. 152-158.
- A. K. Saha, S. Chowdhury, S. P. Chowdhury and P. A. Crossley, “Modeling and Performance Analysis of a Microturbine as a Distributed Energy Resource,” IEEE Transactions on Energy Conversion, Vol. 24, No. 2, 2009, pp. 529-538.
- Working Group on Prime Mover and Energy Supply Models for System Dynamic Performance Studies, “Dynamic Models for Combined Cycle Plants in Power System Studies,” IEEE Transactions on Power Systems, Vol. 9, No. 3, 1994, pp. 1698-1708. doi:10.1109/59.336085
- I. Zamora, J. S. Martin, A. Mazon, J. S. Martin and V. Aperribay, “Emergent Technologies in Electrical MicroGeneration,” International Journal of Emerging Electric Power Systems, Vol. 3, No. 2, 2005, pp. 1553-1779.
- C.-M. Ong, “Dynamic Simulation of Electric Machinery Using Matlab/Simulink,” Prentice Hall, Upper Saddle River, 1998.
- M. Malinowski, S. Stynski, W. Kolomyjski and M. P. Kazmierkowski, “Control of Tree-Level PWM Converter Applied to Variable Speed-Type Turbine,” IEEE Transactions on Industrial Electronics, Vol. 56, No. 1, 2009, pp. 69-77.
- M. Liserre, F. Blaabjerg and S. Hansen, “Design and Control of an LCL Filter-Based Three-Phase Active Rectifier,” IEEE Transactions on Industry Applications, Vol. 4, No. 5, 2005, pp. 1281-1291.
- J. A. P. Lopes, C. L. Moreira and A. G. Madureira, “Defining Control Strategies for MicroGrids Islanded Operation,” IEEE Transactions on Power Systems, Vol. 21, No. 2, 2006, pp. 916-924.
- R. H. Lasseter and P. Piagi, “Microgrid: A Conceptual Solution,” PESC’04, Aachen, 20-25 June 2004.
- T. Ackermann, “Wind Power in Power Systems,” John Wiley & Sons, Chichester, 2005. doi:10.1002/0470012684
- A. J. G. Westlake, J. R. Bumby and E. Spooner, “Damping the Power-Angle Oscillations of a Permanent-Magnet Synchronous Generator with Particular Reference to Wind Turbine Applications,” IEE Proceedings of Electric Power Applications, Vol. 143, No. 3, 1996, pp. 269-280.
- L. Dambrosio and B. Fortunato, “One Step Ahead Adaptive Control Technique for a Wind Turbine-Synchronous Generator System,” Proceedings of the 32nd Intersociety Energy Conversion Engineering Conference, Honolulu, 27 July-1 August 1997, pp. 1970-1975.
- A. H. M. A. Rahim, M. A. Alam and M. F. Kandlawala, “Dynamic Performance Improvement of an Isolated Wind Turbine Induction Generator,” Computers and Electrical Engineering, Vol. 35, No. 4, 2009, pp. 594-607. doi:10.1016/j.compeleceng.2008.08.008
- Carraro Group. www.santerno.com/company/company-profile/
Appendix
Carrier frequency in VMPPT PWM generator, 3000 Hz and in grid-side controller, 5000 Hz, boost converter parameters: ,
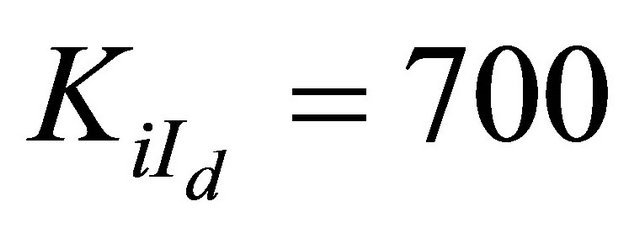
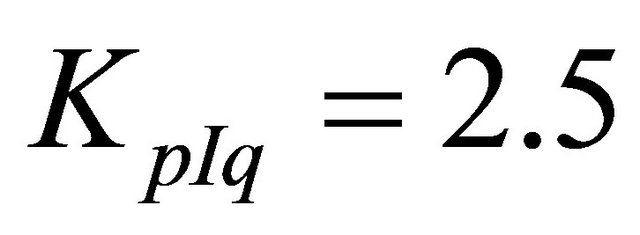
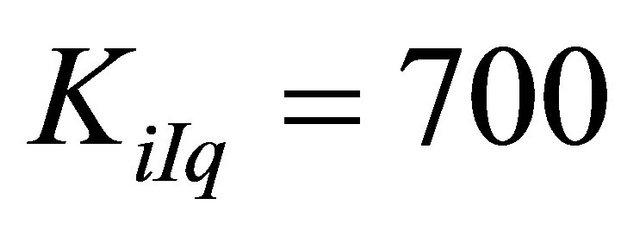
,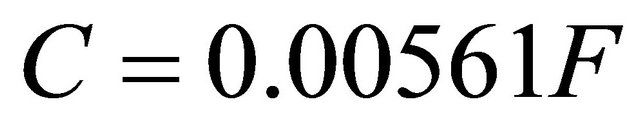 . PI coefficients in grid-side controller:
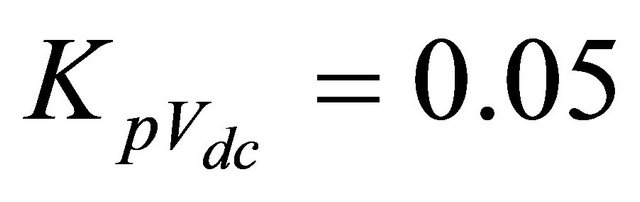 ,
, 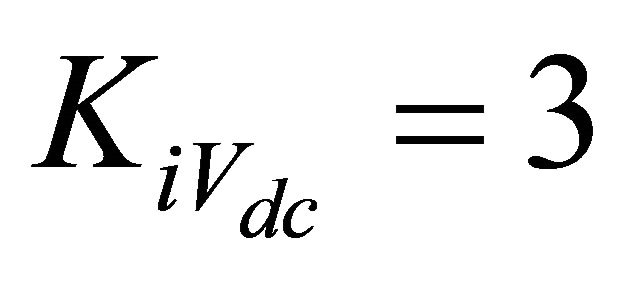 ,
,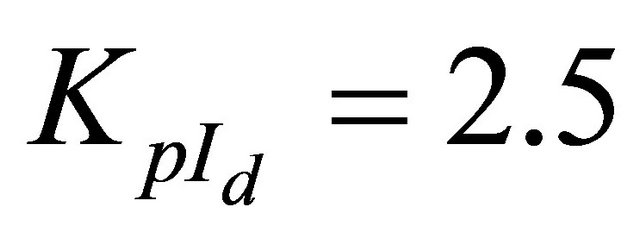 ,
, ,
,  ,
,  .
.
Table A1. Values and coefficients used in pv cell.
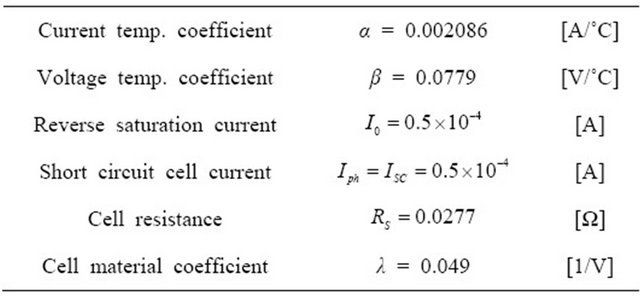
Table A2. Synchronous generator parameters amounts.
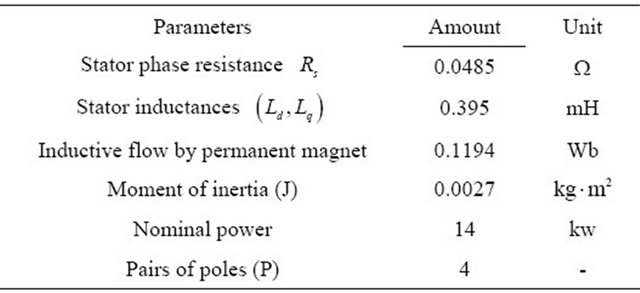
Table A3. Boost converter coefficient values.