Smart Grid and Renewable Energy
Vol.2 No.2(2011), Article ID:4965,7 pages DOI:10.4236/sgre.2011.22020
Analysis of Electrical Characteristics of Photovoltaic Single Crystal Silicon Solar Cells at Outdoor Measurements
![]()
Physics Department, Faculty of Science, Tanta University, Tanta, Egypt.
Email: ali_02us@yahoo.com
Received April 28th, 2011; revised May 13th, 2011; acceped May 16th, 2011.
Keywords: Silicon Solar Cells, I-V Characteristics, Performance Analyses, Outdoor Parameters, Mirror Boosting
ABSTRACT
The electrical performance of a photovoltaic (PV) silicon solar cell is described by its current–voltage (I–V) characteristic curve, which is in turn determined by device and material properties. In this study, an investigation of the performance and device parameters of photovoltaic single crystalline silicon (Si) solar cell of the construction n+pp++ PESC (Passivatted Emitter Solar Cell) at different conditions of solar irradiance, title angle and mirror boosting effects had been studied. Also the paper reports on the performance data of the Si cell, using standard I–V characteristic curves to obtain output parameters and to show that there are possible performance degrading defects presents.
1. Introduction
Many photovoltaic (PV) devices exhibit a poor performance in the field (i.e., mainly in actual use conditions). A significant part of the loss in their performance is due to a variation in sunlight, Nominal Operating Cell Temperatures (NOCT), reflectivity at the device surface and other localized climatic conditions. The Standard Test Conditions (STC) combines the irradiation of a clear summer day, the cell/module temperature of a clear winter day and the solar spectrum of a clear spring day. These measurement conditions obviously do not represent real operating conditions of PV devices at the site of installation. For the optimum design of PV power systems, it is desirable to measure their long term performances at the site of installation. The causes of seasonal variations on the performance of an amorphous silicon solar module were clearly separated using long-term outdoors I(V)- measurements. We normalized the data to a standard temperature, by using measured temperature coefficients of the characteristic parameters of the I(V)-curve, rather then extrapolating the curve itself.
A solar cell can be considered as a two-terminal device that conducts like a diode in the dark and generates a photo voltage when illuminated. The current–voltage (I–V) characteristic of the solar cell describes its electrical performance. These I–V characteristics are determined by parameters such as diode saturation current, diode ideality photo generated current and the presence of parasitic resistances (series and shunt resistance). These parameters depend, in turn, on the solar cell structure, material properties and operating conditions. Photovoltaic (PV) modules, which generally consist of a set of series-connected solar cells, are rated at the maximum power output under standard test conditions (STC): 25˚C, 1 kW/m², AM 1.5 global spectrum. The analysis of I–V characteristics at STC allows the determination of additional electrical performance parameters and also gives an indication of the presence of parasitic resistances [1]. The dark I–V characteristics enable the extraction of the device parameters and parasitic resistances. The presence of shunt paths in the solar cells of a PV module leads to excessive power loss at low irradiance levels. The performance of PV modules/cells can be fully characterized using a suite of electrical, optical and mechanical evaluation tools [2] to detect any degradation and possible failure, or by using the effect of outdoor conditions, such as, dust and shadow on the performance [3]. Or by installing the solar cell/module in a tilted position at the optimum tilt angle of the location of study [4], in the outdoor. Sometimes, the reliability measurements could be done by laser irradiation of the cell [5].
This paper, however, focuses on the electrical charaterizations at outdoor conditions of PV single silicon solar cell of the construction n+pp++ PESC prepared on a heavy silicon wafer Boron doped at Tanta latitude (30˚ 41') and longitude (30˚99') /Egypt climate. The performance characteristics for a silicon solar cell with title angle and mirror boosting effects will be studied.
2. Current-Voltage Characteristics
In most cases, the I–V characteristics of a PV device can be represented by a one or a two-diode model. These models use both one or two-diode exponential terms and a term representing parasitic resistances. In the two-diode model the solar cell circuit is represented by a current source in parallel with two diodes—one with an ideality factor of 1 and the other with ideality n >1. The parasitic series (Rs) and shunt (Rsh) resistances are incorporated as illustrated in Figure 1. The general characteristic equation for a PV device using the two-diode model is then given by:
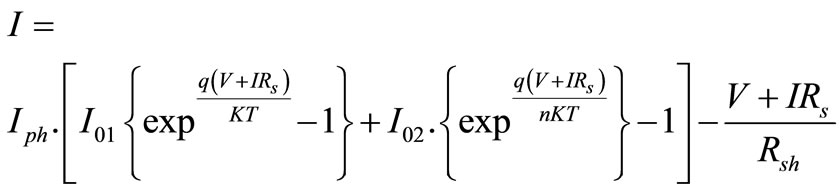
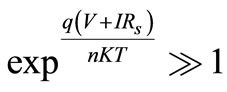
where Iph is the photo-generated current, I01 is the saturation current due to recombination in the quasi-neutral regions, I02 is the saturation current due to recombination in the depletion region, q is the elementary electron charge, K is the Boltzmann constant = 1.38 × 10⁻²³ J/K, and T is the absolute temperature. Rs arise from the resistance of the metallic contacts and ohmic resistance of the material. Rsh derives from the leakage of the current across the p–n junction or at the cell edges. The sources and effects of parasitic resistances are discussed in detail elsewhere [1]. In most practical applications the I–V characteristics of a PV generator are approximated by employing a model based on a single exponential term, assuming [6] that:
1) the effects of parasitic resistances are neglected;
2) Iph ≈ short-circuit current (Isc);
3) all the solar cells are the same and operate under identical conditions; and
Such assumptions are usually appropriate when de-
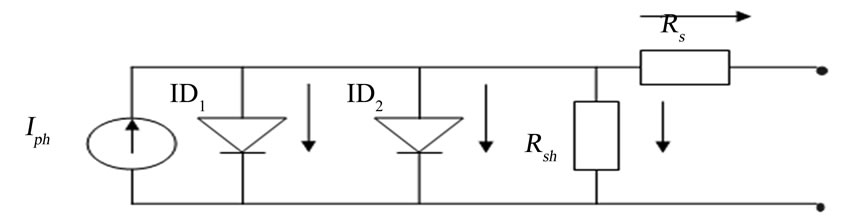
Figure 1. Two-diode equivalent circuit model of a solar cell. signing and sizing a PV system. Detailed analyses of PV device and system performance, degradation and failure, however, require knowledge of device and output parameters as described by Equation (1). In this paper we use I–V characteristics to extract useful output performance, as well as the important device parameters discussed above.
3. Experimental Set up
I–V characteristics of a single-crystal Si cell was measured and analysed. The I–V curves measured at STC were used to obtain device performance parameters and to identify possible problems such as the presence of parasitic resistances. The I–V curves were measured in a solar simulator with an estimated uncertainty of 5% in the measurement. I–V curves measured at different irradiance levels (<1000 W/m2) were used to obtain efficiency (η) as a function of irradiance with a maximum uncertainty of 2%. This yielded information on the level of shunting in cells within a cell/module. In this study, the block diagram of the experimental set up is shown in Figure 2. The mirror boosting effect is adjusted manually to obtain the optimum tilt angle of the mirror on the in front to the solar cell. All measurements were obtained on the roof of the faculty of Science/Physics department/ Tanta University/Tanta latitude, Egypt.
4. Discussion of Results
The outdoor exposure tests were started on April, 2006. A single crystal silicon solar cell was mounted horizontally and at tilted angle of 30˚ from horizontal on a stand and placed under the sun on the roof of the faculty of science at the Tanta University/Egypt.
A block diagram for the measuring technique is shown in Figure 2 that is a slightly simplified test to study the rating of solar cells under the sun. Initially, the variable load resistance was set at its minimum value. The current and the voltage of the solar cell were measured using digital fluke 87 and fluke 73III multimeter respectively. The load resistance was increased (from minimum value to maximum) in nearly 100 steps and the corresponding voltage and current were measured and then tabulated. These data were used to calculate the power at each step. The plots of power versus voltage/current were used to estimate the peak power and peak current of the solar cell under investigation respectively. The experiments were performed near the solar noon. At the same time, the effect of solar irradiance, tilt angle and the mirror boosting on the solar cell performance were measured.
The current through the cell was monitored with a shunt resistor (0.01 ohms) and measured by a fluke digital (87 IV True RMS) multimeter. The measurement of Pmax was performed manually by monitoring the product of the
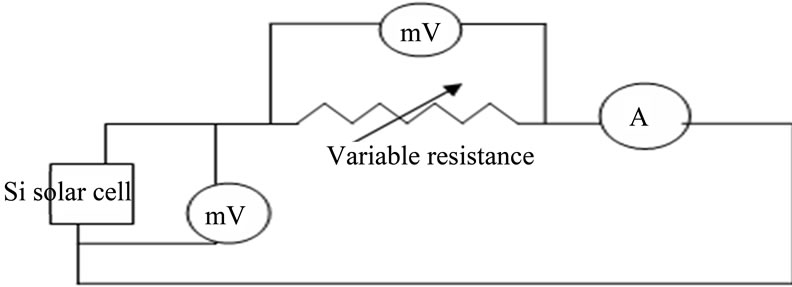
Figure 2. Schematic diagram of a solar cell/module measurement system.
voltage and current. The voltage across the solar cell was measured using a fluke digital (73 III) multimeter.
I–V characteristics of a silicon (Si) solar cell used in this study, representing a standard technology type, is shown in Figure 3 The performance parameters obtained from these characteristics measured at STC are listed in Table 1 together with the specified maximum power output. The output parameters listed are: the short-circuit current (Isc), open-circuit voltage (Voc), and maximum out-put power (Pmax). In addition, two derived performance parameters are the fill factor (FF) and the aperture area efficiency (η). FF is defined as the ratio of Pmax to the product of Isc and Voc, and η is the ratio of Pout to Pin, where Pout is Pmax and Pin is based on the area of exposed front glass cover. In addition to the output parameters, the shape of the I–V curves also yielded useful information about possible manufacturing or device defects in the module. The high efficiency of the Si cell (module) was expected. The regular square shape of the cells, resulting in the optimum use of available module aperture area together with the high efficiency of the cells, led to high module aperture area efficiency. The measured values for Isc and Voc are identical for Si cells with that from data sheet. The slope of an I–V curve at Voc gives an indication of the presence of series resistance, and the slope at Isc indicates the possible presence of shunt paths in some of the cells [7,8]. The Si I–V curve shows that the series resistance was low, but that there was a possibility that the cell had low shunt resistance. This is also reflected in a slightly lower than normal fill factor. The possibility of shunts was investigated further and is discussed below.
From the I–V curve it observed that the efficiency and fill factor were lower for the Si cell at outdoor conditions than that at STCs. Since there were decreases in the Isc and Voc because of recombination processes and increasing of cell temperature respectively. The shape of the I–V curve, FF and slope at Voc indicate a higher series resistance than for the Si cell at STC conditions. The working temperature of the solar cell (Tc) depends exclusively on the irradiance, H and on the ambient temperature (Ta) according to the relation:
 (1)
(1)
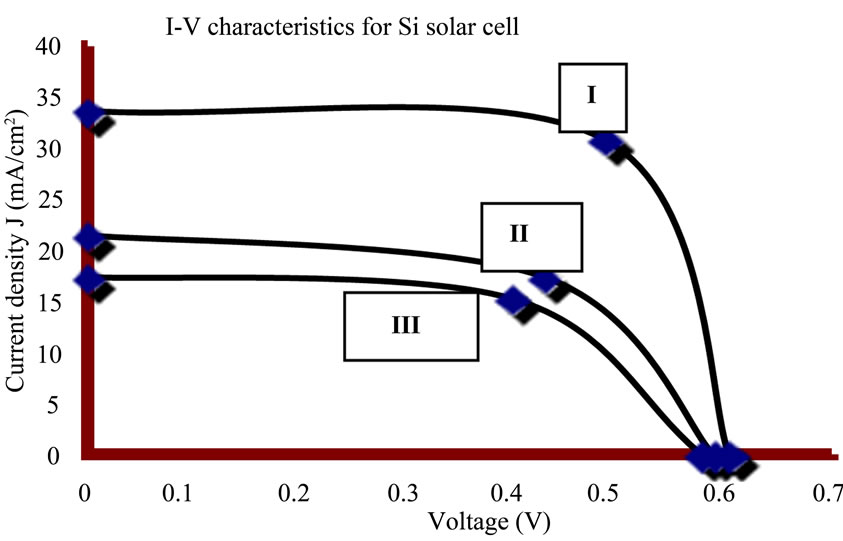
Figure 3. The I–V characteristics of an illuminated single crystal silicon solar cell under investigation with respect to standard test conditions at different values of solar radiation 100 mW/cm2 [I], 60 mW/cm2[II] and 40 mW/cm2 [III] respectively.
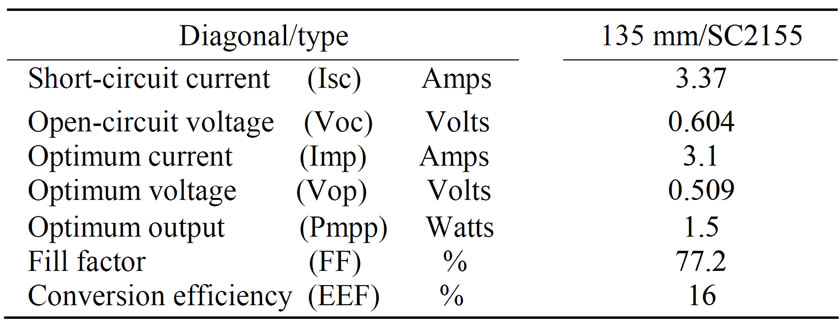
Table 1. The electrical parameters for a Si solar cell (single-crystal PESC) of size 102.5 × 102.5 ± 1 mm, thickness 340 ± 50 μm and weight 8.5 ± 1.2 g. Under STC conditions pf solar irradiance of 1000 W/m2, spectrum AM 1.5 Global and cell temperature of 25˚C [9].
where C1 has the value:
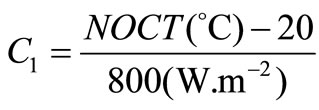 (2)
(2)
NOCT denotes Nominal Operating Cell Temperature. The value of C1 is taken to be 0.03 (˚C /W·m2) [9,10].
The power—voltage/current curves estimated from Figure 4 are shown in Figures 5 and 6 where the efficiency of the single crystal Si solar cell decreases approximately 0.06 in absolute value per ˚C [11]. It is also well documented that the output power of the solar cell is reduced as irradiance is reduced but at a rate different from the reduction of irradiance. The maximum conversion efficiency of 11.04% was recorded for April 22. The sky was cloudy, solar irradiance and cell temperature were 480 - 680 W·m-2 and 45˚C respectively. The amount of solar radiation falling on the solar cell was almost 31% less than that of 1000 W·m-2, and the rise in the cell temperature was 21˚C compared with that at which the solar cell was tested at STC. The recorded efficiency of the cell was 10.7% less than the efficiency measured at
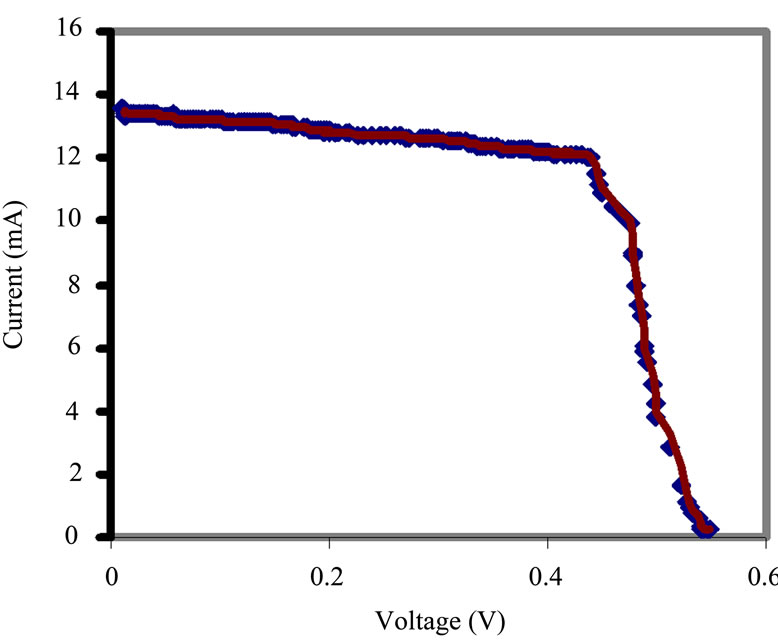
Figure 4. The outdoor I–V characteristics of a single crystal silicon solar cell under investigation of size 0.45 cm2 on a typical day of April with Have. = 600 W/m2.
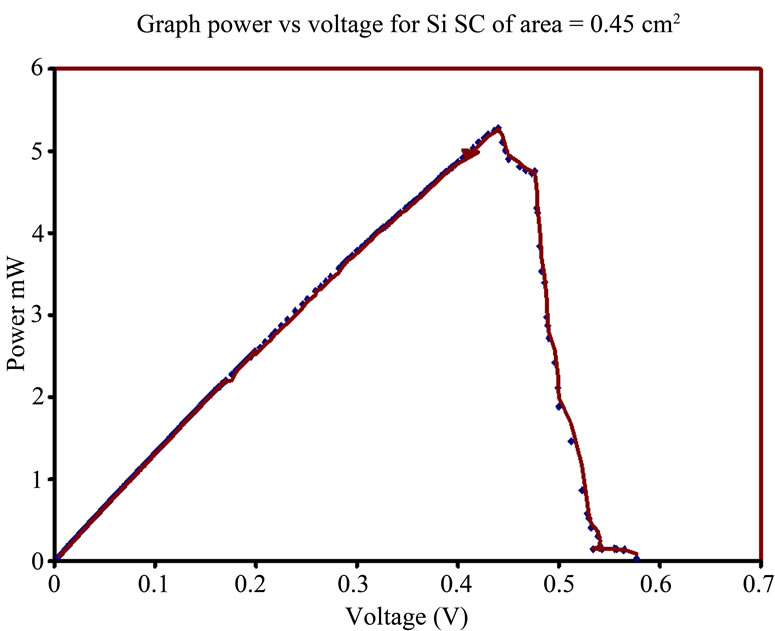
Figure 5. Outdoor P-V characteristic of a single crystal silicon solar cell under investigation installed horizontally under the sun on the roof of the Faculty of Science Tanta University/Tanta of latitude (30˚41')/Egypt during April 2006.
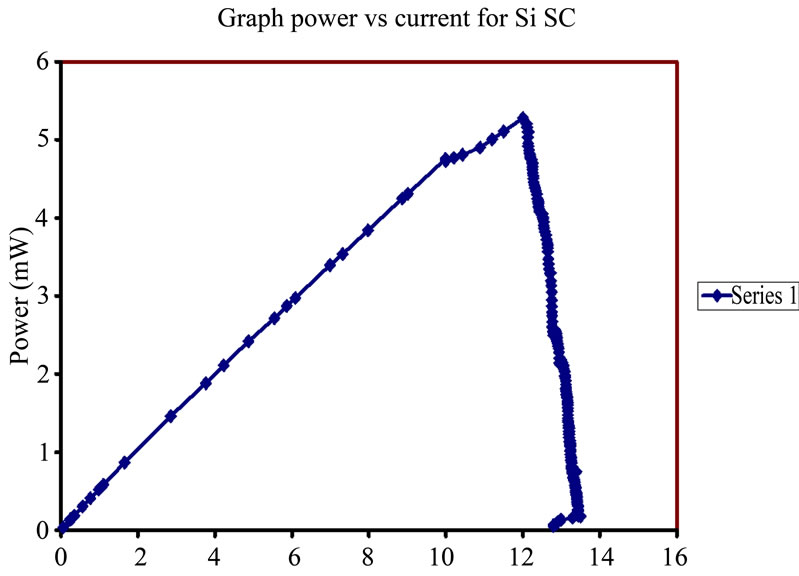
Figure 6. Power vs current characteristics for the Si sola cell under investigation on a typical day of April 2006.
STC. This reduction in efficiency is due to a big variation in the amount of sunlight and an increase in the operating temperature of the solar cell in its operating environment.
This reduction may also be a function of other parameters such as humidity, horizontal and vertical visibilities, and atmospheric turbidity, whose effects have not been included in this project. The overall efficiency of the solar cell for the month of April was only 11.3%. It is due to the un-controlled sudden variation in the amount of solar radiation and an increase in operating temperature of the solar cell.
Many tests have been conducted in the months from April to September 2006; the results of one are shown in Figure 5. The efficiency of the solar cell lies in the range of 10.08% - 12.54%. The values of these efficiencies are 3% - 4.54% less than those supplied by the manufacturer and were measured at STC. It is notable that the amount of solar radiation falling on the cell was nearly as 1000 W.m-2 throughout these months (at the time of test) and the cell was operated at a monthly-averaged temperature of 51˚C (almost double the Celsius temperature compared with that at STC).
A reduction in the cell efficiency at low insulation level may be caused due to recombination currents, parallel resistance, and other effects. It is reported in the literature that low insulation of level of 200 W·m–2 can cause the efficiency to drop by 30% of its value at STC [6].
Preliminary results demonstrate that the operating temperature of the cell is one of the most important parameters affecting the solar cell power output and its efficiency to convert sunlight into electricity. The output of the solar cell and module decreases with increase of the cell temperature. It is a function of the incident radiation as well as of ambient temperature, thermal properties of cell encapsulation and the thermal effects of the mounting structure. In order to reduce the cell temperature to get near the rated value for maximum efficiency, a cost effective solution would need research for encapsulation material and cost analysis.
The efficiency of a solar cell/module depends on its operating conditions. Major effects altering cell efficiency are cell temperature [9], solar radiation intensity (see Figures 7 and 8) which explains the relation between the irradiance and the cell parameters, i.e., Voc, Isc and η, spectral effects and reflectivity. The effect of some of these parameters (such as temperature as shown in Figure 9, reflectivity, and low light level) can be enhanced or reduced by ways of installation (where e.g. the cell/ module orientation relates to incidence angle the mounting structure determines part of the thermal load). Results presented in Figure 9 demonstrate that a rise in the solar radiation intensity is swapped over by an increase in temperature. This project has been undertaken during a rainy and cloudy season, which was longer than com-
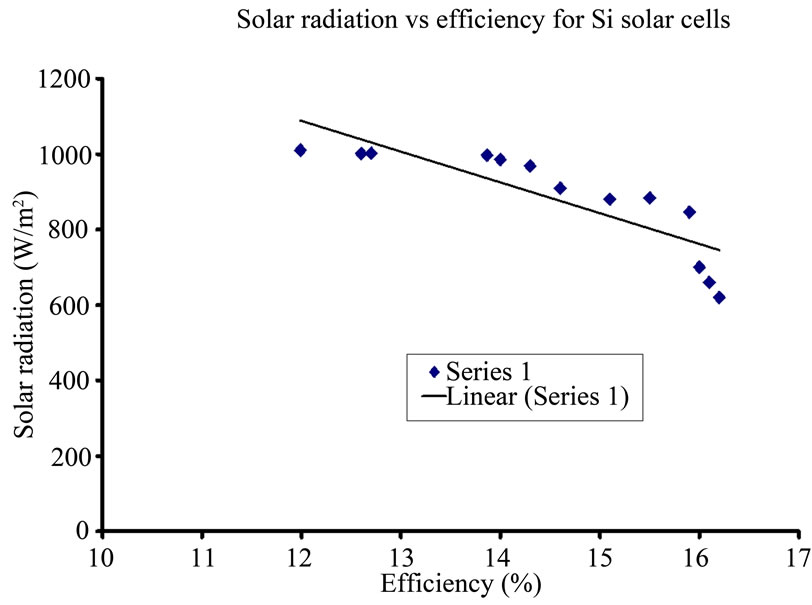
Figure 7. The effect of solar radiation intensity on the efficiency of a single crystal silicon solar cell under test.
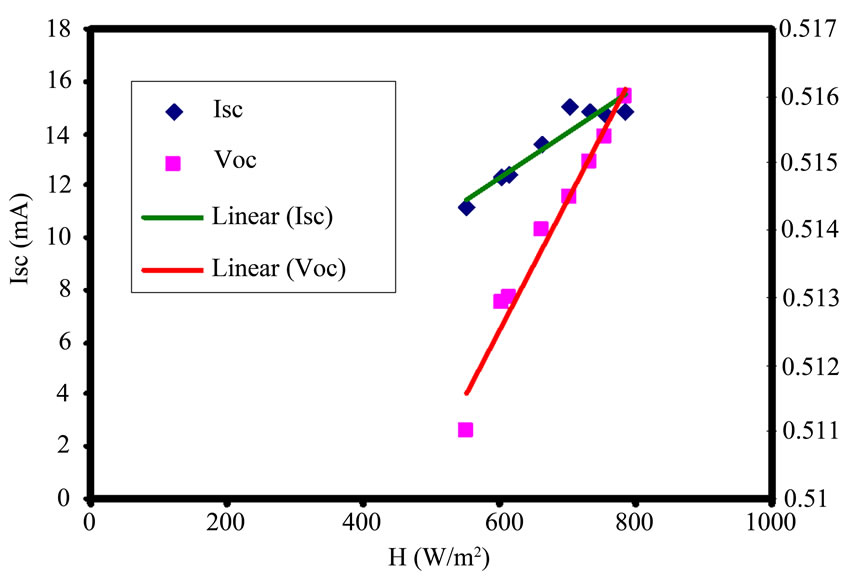
Figure 8. The effect of solar radiation intensity on the Isc and Voc of a single crystal silicon solar cell under test.

Figure 9. The effect of temperature on the efficiency of a single crystal silicon solar cell.
pared with earlier years. There was hardly a clear and cloudless sky on the day of even a single test. The dependence of efficiency of solar cells on seasons has been reported by many researchers [4-8]. As the present studies were conducted during an extended rainy season and only for a period of six months, it is too early to comment on the rating of the solar cell for different seasons.
On the other hand, the effect of the tilt angle of the cell/module from horizontal during installation can be represented as a significant tool to enhance the cell/module electrical parameters. The performance of a solar cell is related with its angle of tilt with the horizontal. This is due to the fact that the variation of tilt angle changes the top loss coefficient and the amount of solar radiation reaching the cell effective area. Also, concentrating solar photovoltaic systems must be oriented to track the sun so that beam radiation will be directed onto the absorbing surface. The optimum tilt angle of installation is given by [13]:
 in winter
and 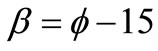 in summer
 is the latitude angle of the setting position (for Tanta/Egypt 30˚41').
According to these two equations as the tilt angle increase the Isc, Voc and η are increased as in Figures 10 and 11. The tilt angle influences the amount of energy collected by a photovoltaic module. However, representations of these effects on the energy yield and the performance of the PV system are commonly based on the theoretical calculations [14], whereas there is a lack of experimental investigations. The optimum angle is calculated by searching for the values for which the total radiation on the collector surface is a maximum for a particular day or a specific period. At the same time, the boosting (mirror) effect on the performance of the Si solar cell is shown to increase the electrical parameters as in Figure 12 and Figure 13.
Using optical devices such as mirrors, Fresnel lenses, diachronic films, and light guides, it is possible to collect solar light and concentrate its energy on a single small area solar cell. This reduces the total cell area an amount equal to the concentration ratio and thus decreases the cost of the PV system, as a relatively inexpensive optical
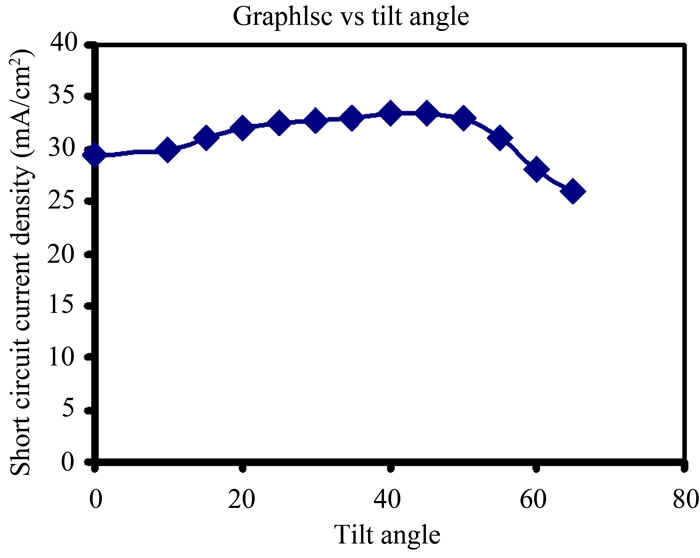
Figure 10. The effect of tilt angle on the Isc of a single crystal silicon solar cell.
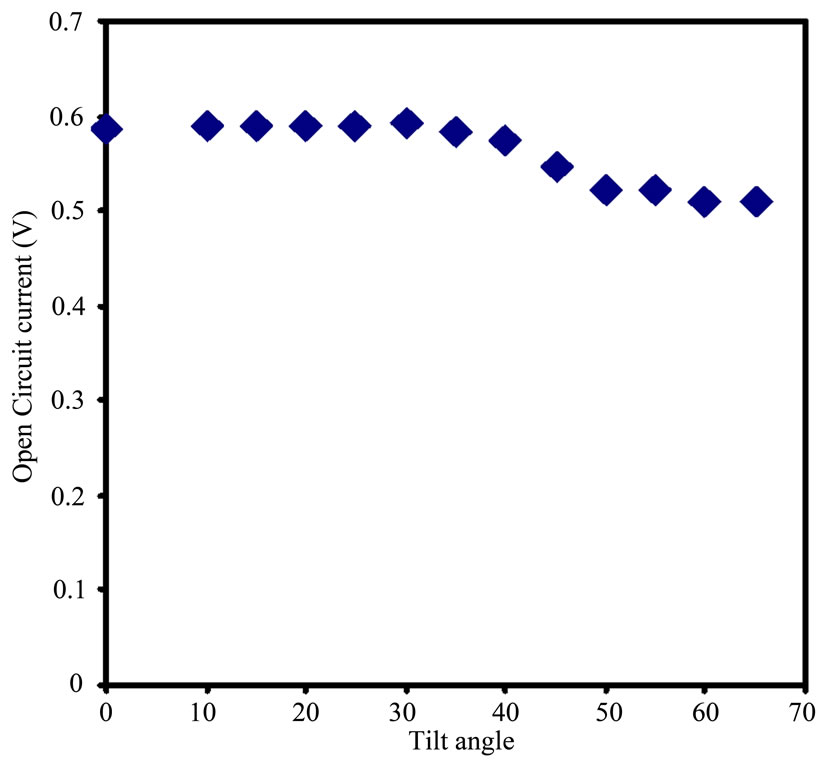
Figure 11. The effect of tilt angle on the Voc of a single crystal silicon solar cell.
concentrator replaces the expensive semiconductor material. Moreover, using light concentration boosts the cell conversion efficiency.
The use of solar energy in technical applications (solar cells/modules) is often constrained due to its low energy density relative to the conventional sources of energy. Optical concentration is one option to increase the energy density of the solar radiation resulting in the possibility to use PV cells with small surfaces and this process can be achieved by using a mirrors boosting. Higher temperatures can be achieved under concentrated conditions, because heat losses are proportional to the absorber surface of the cell. Figure 12 and Figure 13 have shown the ability to increase the electrical parameters of the PV cell/ module, i.e., Isc, Voc. It is clear from results that Isc, Voc are increased by 25% - 30% and 6% - 10% by using booting mirror respectively. This is because Isc is more correlated with irradiance intensity than Voc.
5. Conclusions
The paper summarizes the following:
1) Cold temperatures produce more efficient photo conversion for single-crystal solar cells. The efficiency for single-crystal solar cell decreases as the operating temperature of cells increases. It is reported in the literature that the decrease in the efficiency is approximately 0.06 in absolute value per ˚C increase [8].
2) For the same irradiance level, the output power, and therefore the efficiency, decreases with the increasing cell temperature.
3) The output rating of a solar cell decreases with increase of the cell temperature. In order to reduce the cell
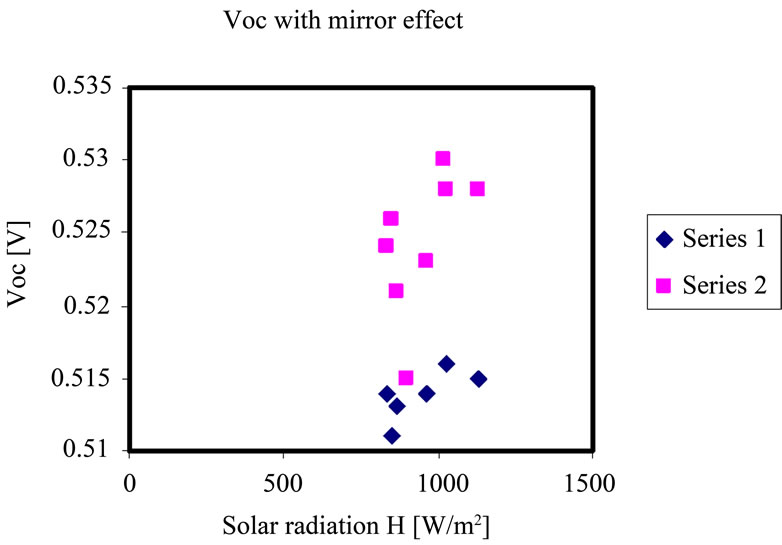
Figure 12. The effect of mirror boosting on the Voc of a single crystal silicon solar cell (series 1) without mirror and (series 2) with mirror.
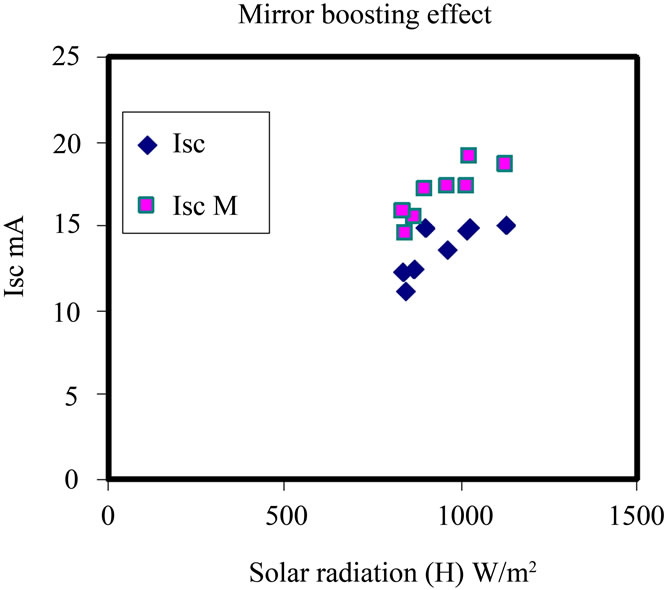
Figure 13. The effect of mirror booting on the Isc of a single crystal silicon solar cell.
temperature to get near the rated value for maximum efficiency, a cost effective solution would need research for encapsulation material and cost analysis.
4) Both Voc and Isc are affected by using a mirror boosting, where Voc has been enhanced by nearly 1% to 3.1%, while Isc has been improved by nearly 15 to 33.33%.
5) Isc is more affected to use mirror boost.
6) The tilting angle of the solar cell is correlated with the location latitude angle and the season of field exposure of the solar cell.
7) The electrical parameters of the solar cell have been affected by the tilt angle.
8) The output power of a single-crystal solar cell is reduced as irradiance is reduced but at a different rate from the reduction of irradiance.
9) The averaged conversion efficiency of the solar cell recorded for a period of six month is approximately 5.4%. It is 54% less than the efficiency of the same cell measured at STC.
10) As is to be expected, solar cell output varies in open environments (i.e. at the place of installation) from the output rating quoted by the manufacturer (which is measured in the laboratory at STC). It is important that the field data i.e. rating of solar cells at the place of installation is used when designing PV power systems.
REFERENCES
- E. E. Van Dyk and E. L. Meyer, “Analysis of the Effect of Parasitic Resistances on the Performance of Photvotaic Modules,” Renewable Energy, Vol. 29, No. 3, 2004, pp. 333-344. doi:10.1016/S0960-1481(03)00250-7
- E. L Meyer, “Assessing the Reliability and Degradation of Photovoltaic Module Performance Parameters,” IEEE Transactions on Reliability, Vol. 53, No. 1, 2004, pp. 83-92. doi:10.1109/TR.2004.824831
- A. Ibrahim, “Effect of Shadow and Dust on the Performance of Silicon Solar Cell,” Journal of Basic and Applied Sciences Research, ISSN 2090-424X, Vol. 1, No. 3, 2011, pp. 222-230.
- H. K. Elminir, A. E. Ghitas, F. El-Hussainy, R. Hamid, M. M. Beheary and K. M. Abdel-Moneim, “Optimum Solar Flat-plate Collector Slope: Case Study for Helwan, Egypt,” Energy Conversion & Management, Vol. 47, No. 5, 2006, pp. 624-637.
- A. Ibrahim, “LBIC Measurements Scan as a Diagnostic Tool for Silicon Solar Cell,” Journal of Applied Sciences Research, ISSN 2090-424X, Vol. 1, No. 3, 2011, pp. 215-221.
- E. Lorenzo, “Solar Electricity: Engineering of Photovol-taic Systems,” Chap. 3, Progensa, Earthscan Publications Ltd., Spain, 1994.
- S. R. Rummel and T. J. McMahon, “Effect of Cell Shunt Resistance on Module Performance at Reduced Light Levels,” Proceedings of the 13th NREL Photovoltaics, Program Review, Lakewood, May 1995, pp. 581-586.
- J. C. Joshi, “Thermal Evaluation of Different Types of Solar Cell Modules in Sunlight,” Renewable Energy, Vol. 5, No. 3, 1994, pp. 1761-1763.
- A. Q. Malik and S. J. B. H. Damit, “Outdoor Testing of Single Crystal Silicon Solar Cells,” Renewable Energy, Vol. 28, No. 9, 2003, pp. 1433-1445.
- A. A. M. Sayigh, “Generating Electricity from the Sun,” Renewable Energy Series, Pergamon Press, Oxford, 1991.
- M. C. Gonzalez and J. J.Carrol, “Solar Cells Efficiency Variations with Varying Atmospheric Conditions,” Solar Energy, Vol. 53, No. 5, 1994, pp. 395-402. doi:10.1016/0038-092X(94)90054-X
- Catalogue Data Sheet of SOLAR-TEC Company for Solar Cells Fabrication, Czech Republic, 2002.
- J. A. Duffie and W. A. Beckman. “Solar Engineering of Thermal Processes,” 2nd Editon, John Wiley & Sons, Hoboken, 1991.
- E. Asl-Soleimani, S. Farhangi and S. Zabihim “The Effect of Tilt Angle, Air Pollution on Performance of Photovoltaic Systems in Tehran,” Renewable Energy, Vol. 24, No. 3-4, 2001, pp. 459-468.