Atmospheric and Climate Sciences
Vol.3 No.3(2013), Article ID:34086,12 pages DOI:10.4236/acs.2013.33040
What Rainfall Return Frequency?
1United States Military Academy, West Point, USA
2California State University, Fullerton, USA
3Hromadka and Associates, Rancho Santa Margarita, USA
Email: ted@phdphdphd.com
Copyright © 2013 T. V. Hromadka II et al. This is an open access article distributed under the Creative Commons Attribution License, which permits unrestricted use, distribution, and reproduction in any medium, provided the original work is properly cited.
Received February 28, 2013; revised April 1, 2013; accepted April 10, 2013
Keywords: Rainfall Return Frequency; Comparison of Return Frequency Estimates; Rainfall; Rainfall Atlas
ABSTRACT
In this paper, a comparison is made of available rainfall data in a localized study area of Los Angeles County, California. This particular area has also been studied by the State of California Department of Water Resources (DWR), the National Weather Service (NWS) National Oceanographic and Atmospheric Administration (NOAA), and the Los Angeles County (LAC) Department of Public Works. All three of these cited governmental agencies independently analyzed the rainfall data to identify rainfall trends for the study area, and then prepared statistical analyses in order to develop estimates of return frequencies for various peak durations of rainfall, among other items of interest to hydrologists. Additionally, these three agencies have available two different analyses of the available data, resulting in updates to their respective published works. Consequently, six different statistical analyses are available for comparison and assessment. In this paper, an examination is made of these six statistical studies and some of the differences between the various analyses are identified and explained.
1. Introduction
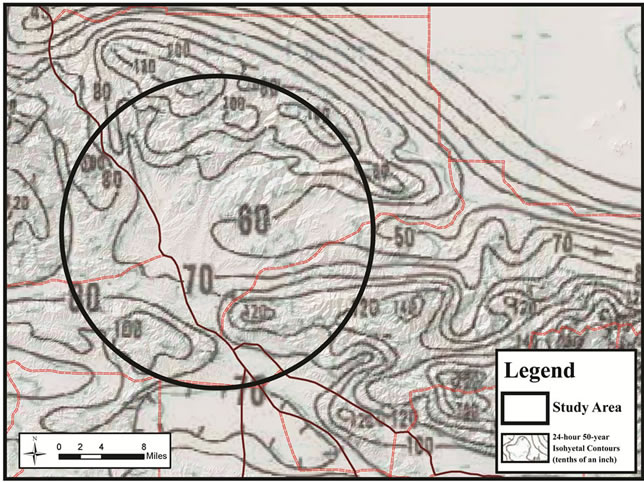
Of interest are the hydrometeorological characteristics of rainfall and their statistical trends in a particular localized study area of Los Angeles County, California. This study area is shown in Figure 1. The study area is part of a regional extent shown in Figure 2.
Rainfall producing wind directions tend to move inwards from the Pacific Ocean towards the mountainous region that extends throughout the region, separating the valley area of Los Angeles from an arid region shown in the upper right portion of Figure 2. An analysis of the topography shows that the mountainous extent blocks inwards flowing moisture, causing orographic uplift, except for two topographic depressions, shown in Figure 3.
The easterly topographic depression is characterized by significantly lower rainfalls then the surrounding area (rainfall trough), a trend that is shown in both the National Weather Service (NWS) National Oceanographic and Atmospheric Administration (NOAA) and the Los Angeles County (LAC) publications; namely, the NOAA Atlas 2 (1973) and the LAC Hydrology Manual (2006) (see Figures 4(a) and (b), respectively). A third readily available statistical analysis of rainfall is provided by the State of California Department of Water Resources (DWR). Because of the rainfall trough, statistical estimates of return frequencies of rainfall in the study area are complex, and consequently, the various considered three agency estimations of rainfall trends differ in the study area. In this paper, these various analyses are compared and difference is assessed, and possible explanations are suggested as to the underpinnings of these differences in statistical estimates of rainfall.
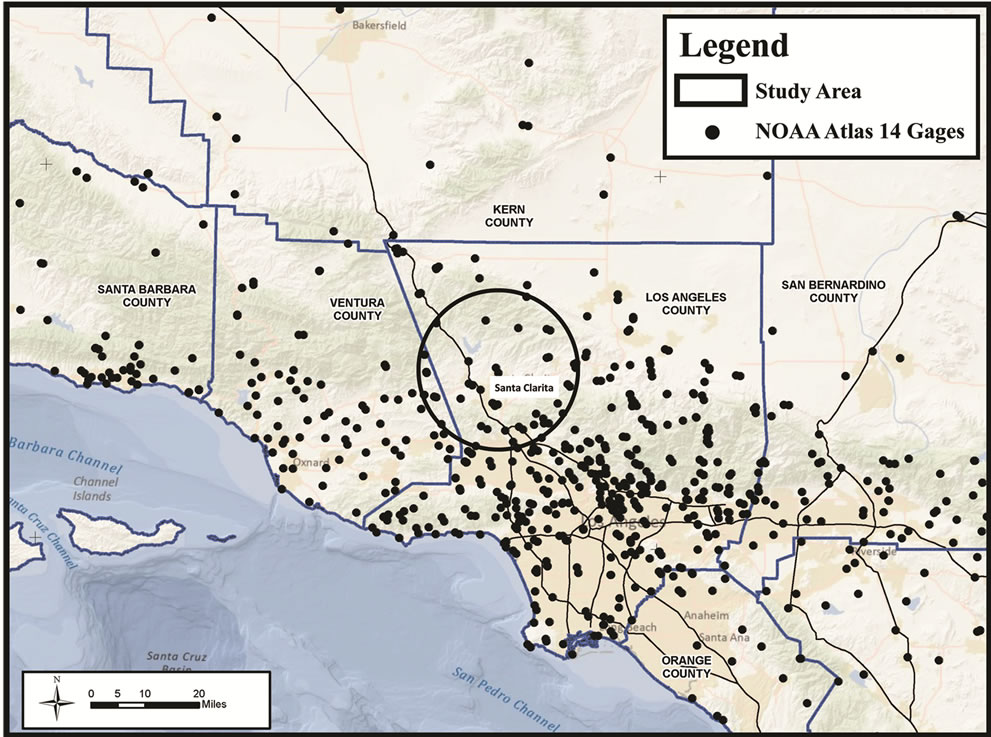
All three sources of rainfall return frequency estimates developed their respective results using the pool of rain gage information sets for the rain gages located within or in the vicinity of the study area. A summary of the rain gage characteristics available for the study area is provided in Table 1. Figure 5 provides a display of the assembled rain gages relevant to the study area regardless of source or operating agency.
2. NOAA Publications
For the study region, two NOAA Atlas publications are available, dated 1973 [1] and 2011 [2]. These publications provide rainfall return frequency estimates for various peak durations throughout large regions of the southwest United States, including the study area. The NOAA statistical analysis is based upon the Generalized
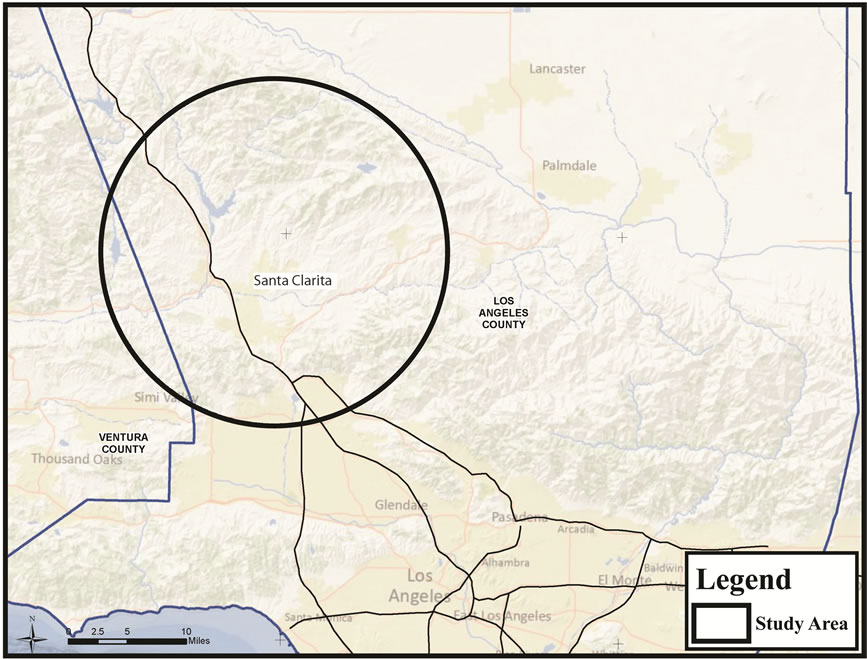
Figure 1. Study area (encircled).
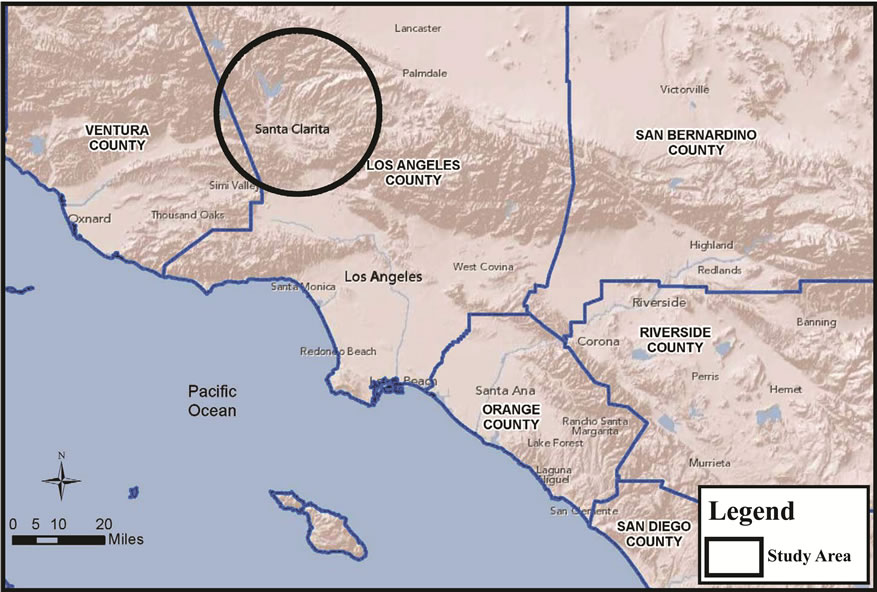
Figure 2. Topographic relief map of study area and immediate vicinity.
Extreme Value (GEV) distribution, where statistical parameters are estimated regionally using rainfall gages located within the region shown in Figure 5. Figures 6(a) and (b) display the rainfall gages which were used in the most recent NOAA publication and are relevant to the study area. Table 2 indicates which rain gages considered in this paper were also considered in the NOAA 2011 publication.
3. DWR Publications
The DWR rainfall statistical analysis is based upon the Pearson Type III distribution. Like the NOAA analysis, some of the statistical parameters are estimated on a regional basis by use of all rain gages located within a selected region. Figures 7(a) and (b) display the gages considered in the DWR analysis and the study area for
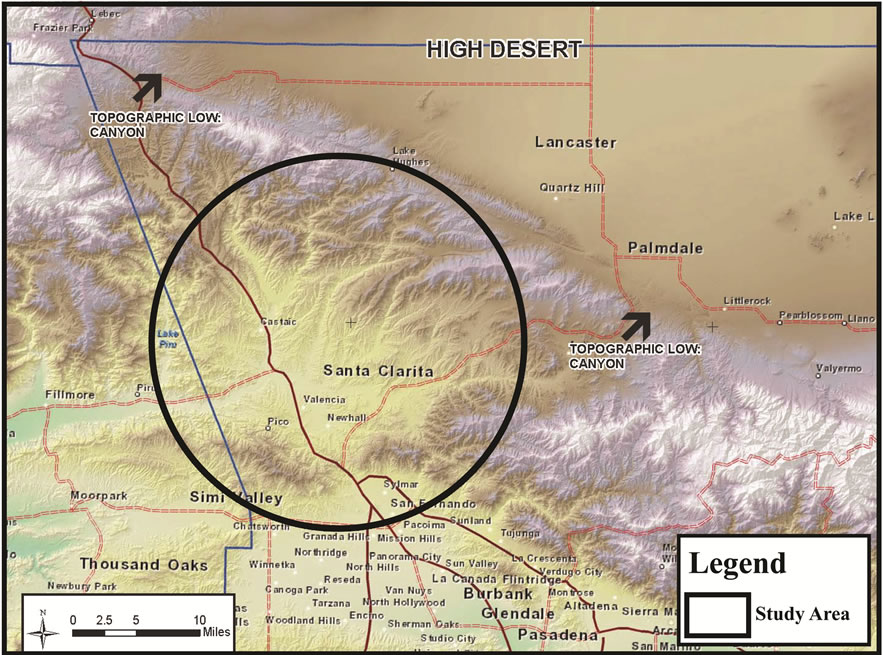
Figure 3. Topographic high regions and canyon relief locations.
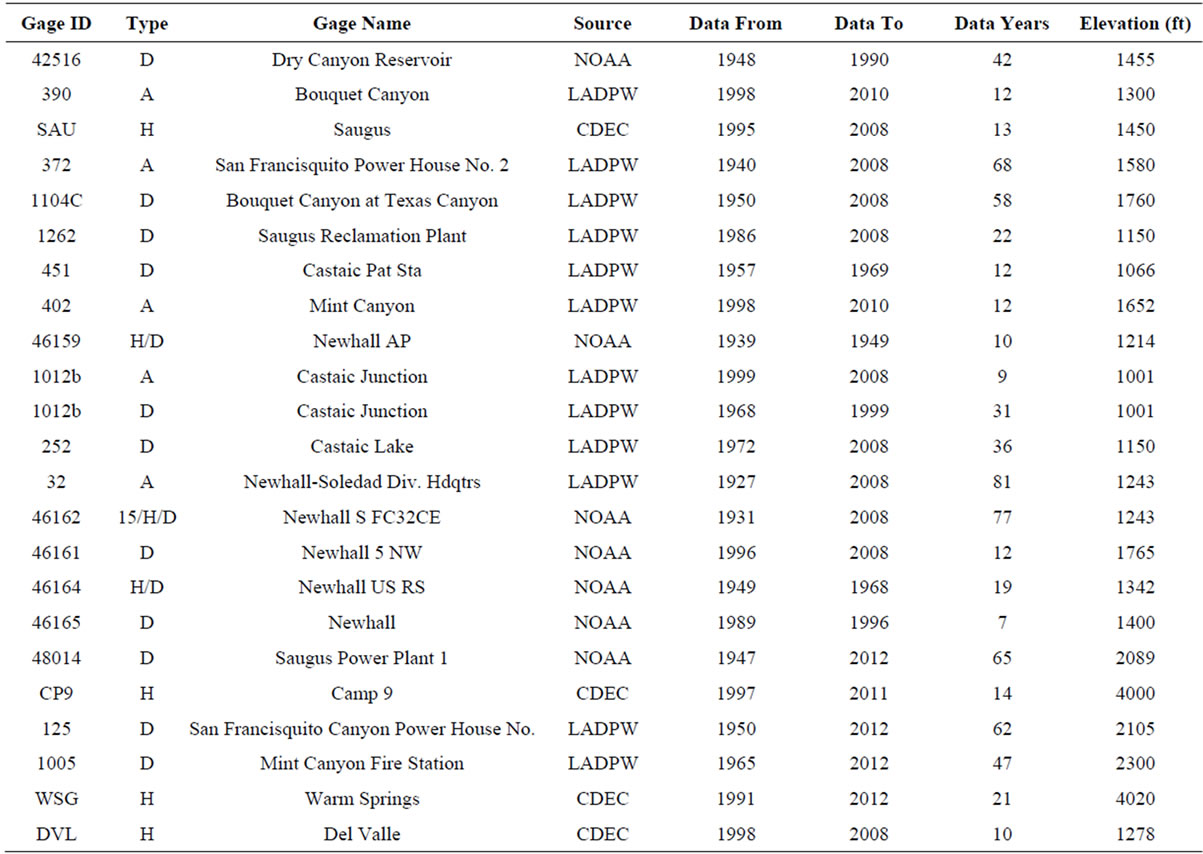

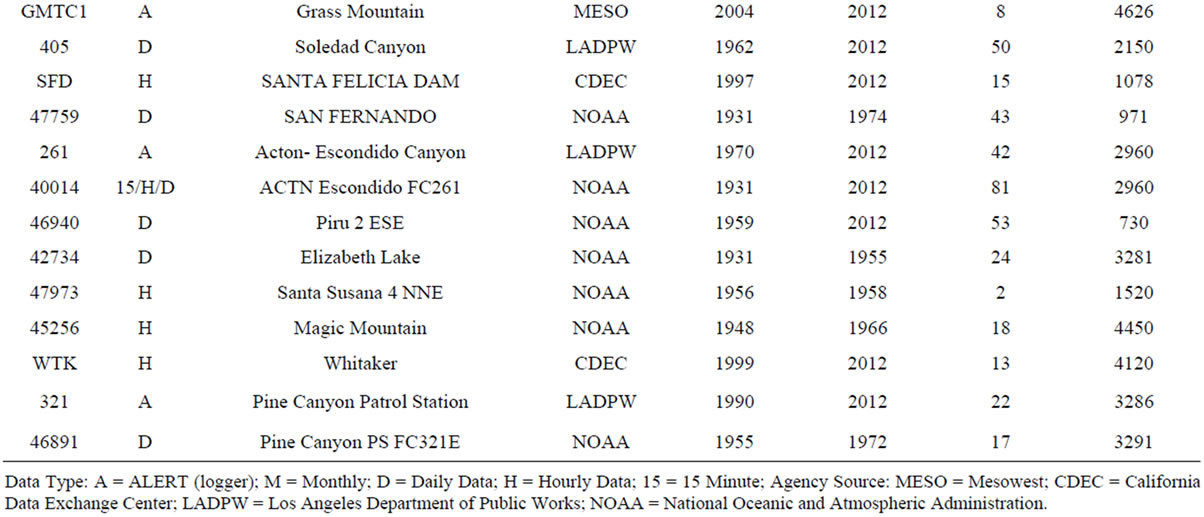
Table 1. Rain gauge characteristics within the study area.
this paper. The DWR analysis results can be accessed at the web site http://www.water.ca.gov/floodmgmt/hafoo/ csc/climate_data [3]. (DWR return frequencies are given for 1-day intervals whereas the other agencies considered herein use 24-hour intervals. For consistency, all data were compared as 24-hour values.) Table 2 indicates which rain gages considered in this paper were also considered in the DWR rainfall analysis. The DWR updates their analysis frequently, with their most current information through 2010 available upon request [4].
4. LAC Hydrology Manual
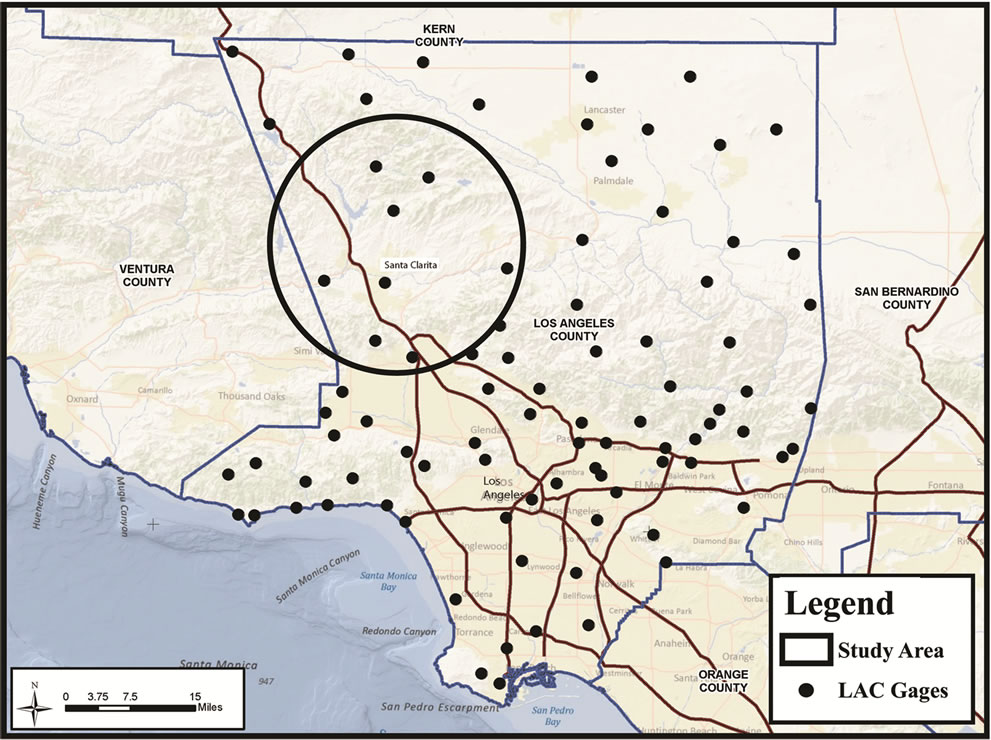
The County of Los Angeles (LAC), California provides rainfall statistical estimates (in isohyetal map form) for the 50-year 24-hour peak duration throughout the 4083 square mile area of the County. The LAC also operates a network of rain gages and these gages are shown in the vicinity of this paper’s study area in Figures 8(a) and (b). Two versions of the Hydrology Manual are considered herein; namely, 1991 [5] and 2006 [6]. The County also published a report in 1997 [7], titled Rainfall Frequency Analysis Report, which gives additional estimates of return frequencies at selected gages, chosen by the County, rather than generalized isohyetals such as shown in the hydrology manuals. Six of the County’s selected gages are located within the target study area.
 (a)
(a)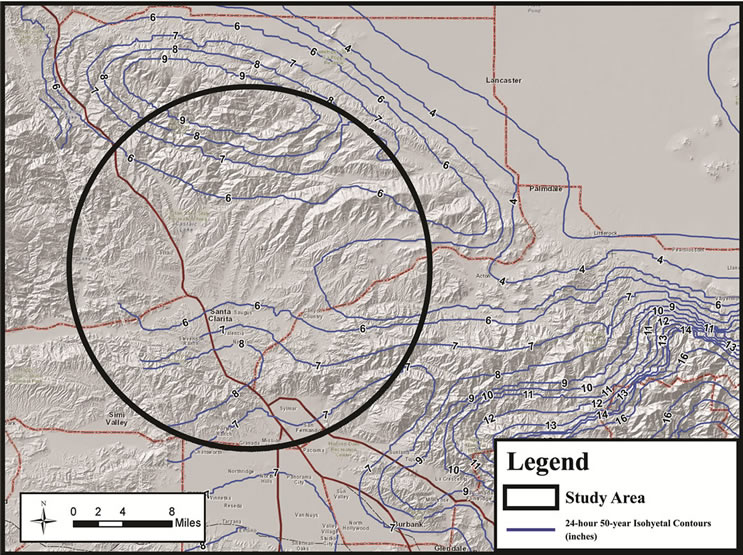 (b)
(b)
Figure 4. (a) NOAA Atlas 2 isohyetals corresponding to 50-year 24-hour peak duration; (b) LAC hydrology manual isohyetals corresponding to 50-year 24-hour peak duration.

Figure 5. Rain gages within study area (all sources).
5. Comparison of Return Frequency Rainfalls for Various Peak Durations
Because the LAC Hydrology Manual only provides procedures for estimation of the peak 24-hour duration, and for the 50-year return frequency rainfall (the LAC Design Storm), this statistical estimate can be compared with the other publications considered. The LAC Hydrology Manual also provides an estimate for a four day 50-year return frequency rainfall as a fixed proportion of the peak 24-hour duration 50-year return frequency rainfall. Table 2 shows which gages within the study area were used by each agency in their analysis. A comparison between procedures, different dates of publication, and different data sources, all for the same study area, is provided in Tables 3 and 4, including the LAC 1997 [7] publication titled Rainfall Frequency Analysis Report.
From Tables 3 and 4, several observations are made:
1) The NOAA Atlas estimates for the considered peak durations and return frequencies are generally similar, for the study area, even though there are approximately 38 years between rainfall data analysis;
2) The DWR estimates also indicate a close similarity between the two dates of available analysis, with approximately 7 years between analyses;
3) The LAC Hydrology Manual estimates show a considerable change in rainfall estimates with approximately 15 years between analyses.
4) The change observed in the LAC Hydrology Manual for the study area indicates a significant reduction in rainfall return frequency estimates. Such a change is not observed in either of the DWR or NOAA publications.
6. Discussion of Results
In this paper, a comparison is made of seven sources of information prepared during the last several decades that deals with the important topic of estimating rainfall quantities for various return frequencies. The study area under examination is the vicinity surrounding the City of Santa Clarita which is located near Los Angeles, California. The study area is exposed to coastal winds and moisture from the Pacific Ocean from the westerly and southwesterly directions, and is bordered to the north and northeast by a mountainous region that surrounds the entire northeasterly extent of the region, except for two canyon locations that are topographically low and connect the study region to the desert area located past the mountainous region. As a result of the topography, significant orographic effects are evident in the available
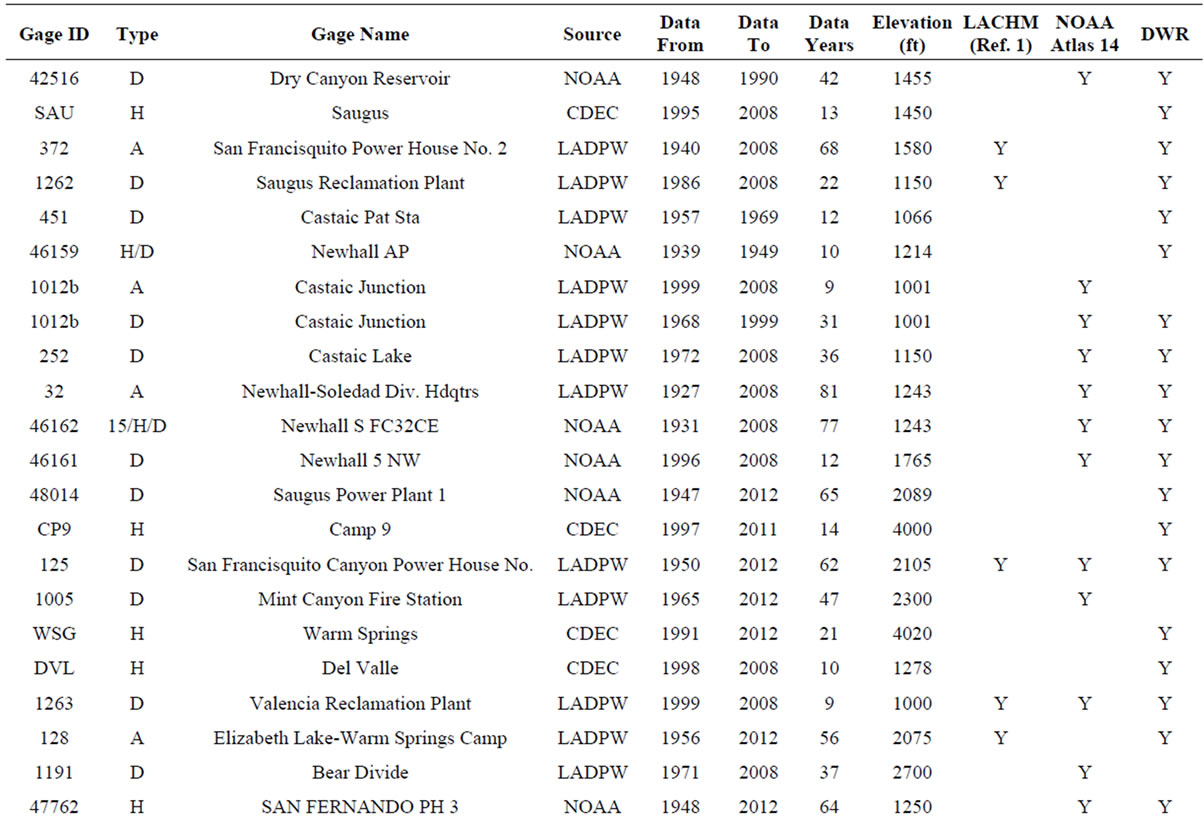

Table 2. Comparison of rain gages used in various agency studies.
 (a)
(a)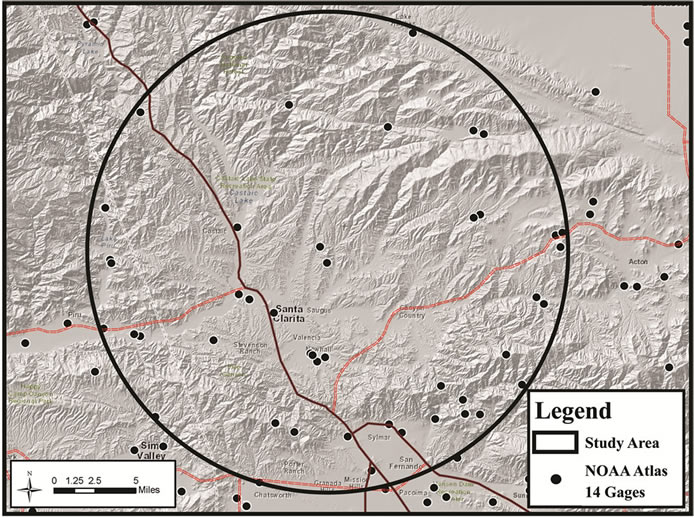 (b)
(b)
Figure 6. (a) Rain gages used in NOAA Atlas 14 (interior and exterior of study area); (b) NOAA Atlas rain gages within study area.
 (a)
(a)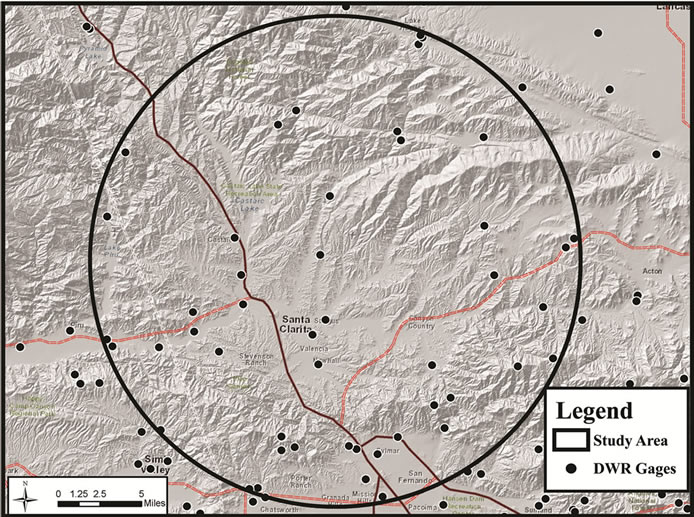 (b)
(b)
Figure 7. (a) Rain gages used by State of California Department of Water Resources (interior and exterior of study area); (b) State of California Department of Water Resources rain gages within study area.
 (a)
(a) (b)
(b)
Figure 8. (a) Rain gages used by Los Angeles County (interior and exterior of study area); (b) Los Angeles County rain gauges within study area.
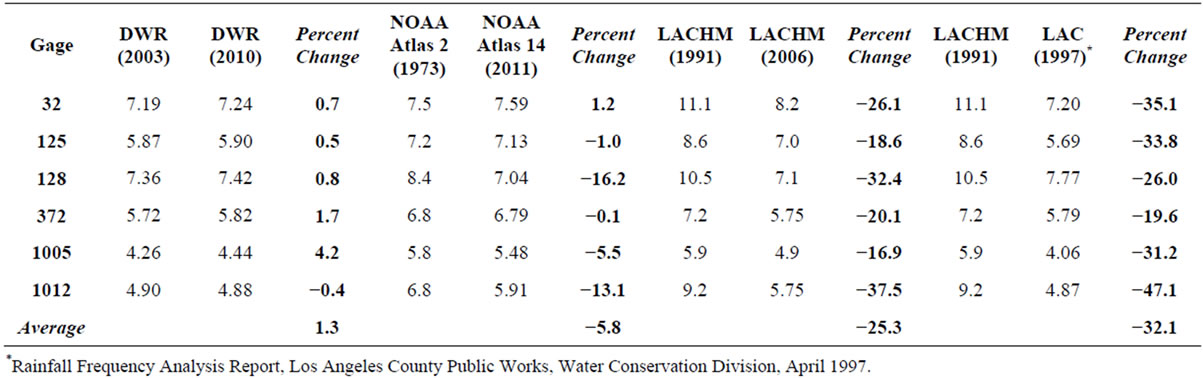
Table 3. Comparison of 50-year 24-hour rainfalls for rain gages located within the study area (and common to all sources of return frequency estimates).
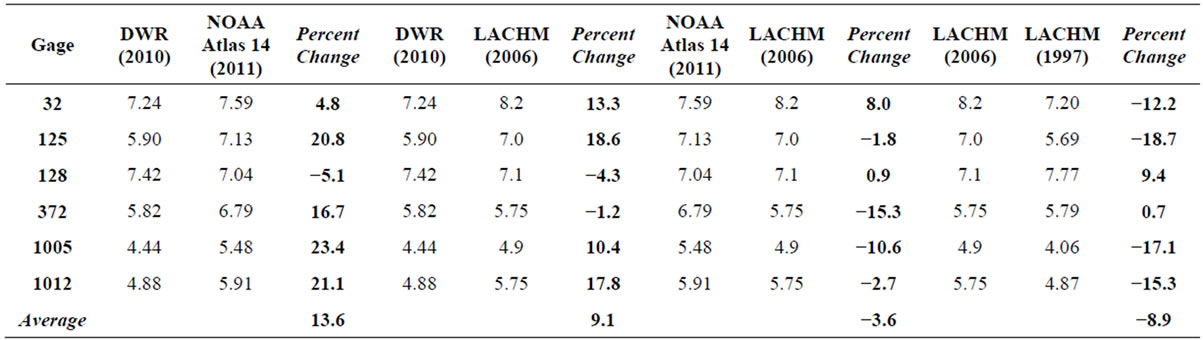
Table 4. Comparison of 50-year 24-hour rainfalls for between NOAA, LAC, and DWR.
rain gage data. However, within the local vicinity of the two topographic lows, rainfall data demonstrate significantly less orographic effects than observed in the other rain gages within the study area. Because of the significant orographic effects and variations in topography within the study area, significant variations in rainfall quantities are observed, resulting in a challenging situation in the analysis and estimation of peak duration rainfall quantities and their respective return frequency estimates. Comparison of the said seven sources of estimates for rainfall return frequency, developed by three climatology agencies (NOAA, State of California DWR, LAC), show significant differences between agency estimates and also differences in updated reports by the individual agencies. Particularly, information from the NOAA 1973 and more recent 2011 Rainfall Atlases show minor variation in return frequency rainfall estimates, as also is the case with the State of California DWR estimates, but significant decrease in rainfall estimates is seen in the LAC publications. Furthermore, similarity is observed between the NOAA and DWR publication results, but significant difference is seen between the LAC and the said other two agencies. Finally, significant difference is seen between the LAC rainfall isohyetal mapping and the associated LAC report for the same region under study.
In the tabulations of Tables 3 and 4, and in the rain gage location plots of rain gages located within the Study Area (seen in Figures 6(b), 7(b) and 8(b)), it is seen that the LAC analysis utilizes far fewer rain gages within the Study Area than either the DWR or NOAA analysis. Similarly, on a regional scale, the LAC analysis uses far fewer rain gages throughout the region than do the DWR or NOAA analyses. Within the Study Area, there are located only eight gages common to all sources of statistical estimates (the eight gages being the subset of available gages used by the LACHMs). In the LAC 1997 publication, six gages within the Study Area give site specific return frequencies. At each of these six gage locations, values were read from the various isohyetal maps and are compared in Tables 3 and 4. Consequently, the DWR and NOAA analyses are based upon much larger populations of data than is the LAC analysis. As a result, not only is the LAC analysis based upon a much smaller sample size than the DWR or NOAA analyses, but the detail provided in estimating rainfall return frequency values is less spatially defined by the smaller data set used in the LAC analysis. Consequently, there may be good reason to consider all three analyses when assessing rainfall quantities and associated return frequencies throughout not only the Study Area focused upon in this paper, but also throughout the LAC region.
7. Conclusion
An analysis of available rainfall data in a localized study area of Los Angeles, California, is presented. This particular study area is also studied by the State of California Department of Water Resources (DWR), the National Weather Service NOAA, and also the Los Angeles County (LAC) Department of Public Works. All three of these governmental agencies independently analyzed rainfall data and prepared statistical analyses to develop estimates of return frequencies for various peak durations of rainfall. Additionally, these three agencies have prior statistical analyses of the available rainfall data, resulting in updates to their respective published works. Consequently, six different statistical analyses are available for comparison and assessment. In this paper, an examination is made of these six statistical studies and some of the differences between the various analyses are identified. Possible explanations as to the underpinnings of the observed differences between these rainfall statistical results are suggested.
8. Acknowledgements
The authors acknowledge the Department of Mathematical-Sciences at the United States Military Academy, New York, for supporting faculty research in inter-disciplinary topics, among other opportunities and support as well as the academic resources available through USMA. The authors also acknowledge the Department of Civil Engineering, California State University, Fullerton, for their continued faculty support towards research efforts and associated academic resources. Acknowledgment is paid to the reviewers of this paper, and the authors thank the reviewers for their comments and suggestions.
REFERENCES
- J. F. Miller, R. H. Frederick and R. J. Tracy, “NOAA Atlas 2 Volume 11 Precipitaion-Frequency Atlas of the Western United States, California,” National Weather Service, Silver Spring, 1973.
- S. Perica, et al., “NOAA Atlas 14 Precipitation-Frequency Atlas of the United States, Volume 6 Version 2.0: California,” US Department of Commerce, National Oceanographic and Atmospheric Administration, National Weather Service, Silver Spring, 2011.
- California Department of Water Resources, “Daily Rainfall Depth-Duration-Frequency Data,” 2003. ftp://ftp.water.ca.gov/users/dfmhydro/Rainfall%20Dept-Duration-Frequency/Rain%20D%20DDF%20Daily/
- California Department of Water Resources, “Daily Rainfall Depth-Duration-Frequency Data,” 2011.
- T. A. Tidemanson, “Los Angeles County Department of Public Works Hydrology Manual,” Hydraulic/Water Conservation Division, Alhambra, 1991.
- D. L. Wolfe, “Los Angeles County Department of Public Works Hydrology Manual,” Water Resources Division, Alhambra, 2006.
- B. Kwan, et al., “Rainfall Frequency Analysis Report,” Los Angeles County Public Works, Water Conservation Division, 1997.