Atmospheric and Climate Sciences
Vol. 2 No. 1 (2012) , Article ID: 17133 , 19 pages DOI:10.4236/acs.2012.21013
Change in Precipitation and Temperature Amounts over Three Decades in Central Anatolia, Turkey
Department of Primary School Teaching, Faculty of Education, Niğde University, Niğde, Turkey
Email: turkanaltin@yahoo.com
Received August 5, 2011; revised October 12, 2011; accepted November 19, 2011
Keywords: Central Anatolia; Climate Vulnerability; Climatic Change; Semi Arid Climate; Aridity Index
ABSTRACT
The study presents the change in precipitation and temperature of the Central Anatolia region which a semi-arid climate prevails. The climatic data consists of the monthly rainfall totals and temperatures from 33 stations in region for the period of 1975-2007. The spatial distribution, the inter-seasonal and the inter-annual amounts of rainfall were studied, along with the vulnerability of Central Anatolia to desertification processes and the place of this semiarid region. Annual temperature frequency has been calculated and shows significant increase in temperature of approximately 2.6% corresponding to 0.4˚C. The change in climate was determined according to Erinç’s aridity index. Semi-arid and semi-humid climate types prevailed in Ürgüp, Kirikkale, Develi, Kirşehir and Akşehir between 1975 and 1990. However, arid and semi-arid conditions prevailed in these stations after 1990. The decrease of the mean rainfall intensity (MRI) has varied between 0.3% and 21% annually since 1990. Decreases in seasonal rainfall intensity (SRI) and annual rainfall totals are found generally in the south, east and southeast of the region. Increases in SRI and annual rainfall totals are observed in the north and northwest of the region however, these increasing percentages are not as great as the decreasing percentages. Rainfall series have been analyzed for long-term trend according Mann-Kendall test. Results of this test indicate that a decreasing trend of winter and spring rainfall intensity is evident, whereas a generally increasing trend is observed for summer and autumn rainfall intensity. These changes began in the late 1970s and early 1980s across most of Central Anatolia.
1. Introduction
According to the Intergovernmental Panel on Climate Change [1], global mean surface temperatures have increased by 0.74˚C since the late nineteenth century. This means changing in present climate. Similar variety appeared also in the years of 1990 and 1991, which has been accepted as the two warmest years of the global record, and even in those years some regions indicated cooling [2]. Global temperature anomalies were smaller in 1992 and 1993 than the peak value reached in 1990 [3]. Some of this modest cooling has occurred due to the effects of the Mount Pinatubo eruption in 1991 [4,5]. Significant cold anomalies occurred also in 1992 over the most of Turkey [6,7].
Climatic changes usually have strong effects on people and their behavior as well as on agricultural resources and the availability of water, and especially is important in regions which its economic activity is depend on agriculture and cattle-dealing such as Central Anatolia region. At present, in the regions where water resources are scarce, conflicts regarding the allocation of water resources are widespread, especially in the Middle East [8].
There was a 22% decrease in cumulative precipitation between 1 October, 2006, and 15 April, 2007, compared to the average of the previous year [9]. This situation, which affects the entire precipitation regime of the country, also affects the recharging of the Tigris and Euphrates Rivers, which mainly occurs in Turkey [8]. According to a study on the impact of climatic change on agricultural production in arid areas [10,11], the amount of rainfall will considerably decrease between 2070 and 2100, and the amount of snow will decrease; as a result of this, it is evident that the time and the location of the sowing and planting of fundamental agricultural crops such as wheat and corn must change. In this paper, we have analyzed annual and rainfall in order to changing in climate and trends in Central Anatolia.
Various studies on temperature and rainfall in Turkey and other regions have shown that rainfall and temperature values of summer months increased and that those values were low during winter months [7,12-24]. The number of summer days has increased by about six days per decade since 1971 and most of the trends are statistically significant at the 5% level [25]. The period of 1970-1993 demonstrated the occurrence of severe and widespread dry conditions, especially in 1973, 1977, 1984, 1989 and 1990 [15]. Spring precipitation data from many stations generally indicated an upward trend from the early 1940s to the late 1960s or to the 1980s, and this period was generally followed by a downward trend [19]. According to this study, longer periods of dry anomalies dominated the summer months. Area-averaged annual rainfall series decreased slightly over the entirety of Turkey and apparently also over the Black Sea and Mediterranean rainfall regions [7]. According to this study, dry conditions in the rainfall regions and the rest of Turkey occurred generally during the early 1930s, late 1950s, and early 1970s as well as late the 1980s and early 1990s. Wet conditions prevailed generally during the period from 1935-1945 and late the 1960s and late 1970s. The beginning of the change to drier-than-normal conditions occurred in the early 1970s and early 1980s in most of the country [15]. Statistically significant negative relationships between precipitation anomalies and 500-Pa geopotential height anomalies in winter and autumn showed an apparent spatial coherence over most of Turkey [17].
Semi-arid and dry sub-humid or semi-humid climate types prevail in the study area according to variable climatic indices. Semi-arid and dry sub-humid climatic conditions are dominant over the continental interiors (Central Anatolia) and the continental Mediterranean region of Turkey [19]. Semi-arid regions are well known to be especially sensitive to climate variations [26]. According to [27], Cappadocia district, which is located in the southern part of the study area, is vulnerable to desertification. Steppe and dry forests are the dominant vegetation in this location.
A scientific discovery, which is important to understanding the features of the atmosphere circulation controlling the climate of Turkey and its variability, is the North Sea-Caspian Pattern (NCP), which was defined by [28]. The NCP is a high atmospheric level teleconnection with two parts, part of which is located in the Caspian Sea and the other part is in the North Sea [27]. [29] determined the effects of this connection on temperature and rainfall regimes and their variability in the Balkans, Anatolia and the Middle East. Several studies have established that the largest effect of the NCP on mean temperatures from October to April occurs in Central Anatolia [27,29,30]. In addition, according to [27], the Cappadocia district of Central Anatolia is quite vulnerable to effects of the North Atlantic Oscillation (NAO). The NAO is one of the major factors that affect weather conditions in the Northern Hemisphere [31]. According to [32] the relationship between the variability of the annual and seasonal rainfall in Turkey and the variability of NAO indices (NAOIs) is negative. The effects of the positive and negative phases of the NAO are less precipitation and more precipitation, respectively, in southwest Anatolia [31]. The negative correlation coefficient (CC) is strong in the western and inner areas, especially Cappadocia, during winter and partly during autumn [27]. According to [32], the effects of autumn and winter rainfalls on the negative (or positive) NAOI stage are explained by meaningful amounts of rainfall (or arid conditions) in the western and inner regions of Turkey.
Persistent dry conditions have been evident for the past three decades over a considerable part of Turkey. There was a general trend of humid conditions around the 1960s toward dry sub-humid climatic conditions in the aridity index values of many stations and of Turkey in general [33]. With regard to climatic factors, southeastern Anatolia and the continental interiors of Turkey appear to be arid and prone to desertification. When other natural and anthropogenic factors, such as high volcanic topography, poor land-use and sparse dry-forest [34], are also taken into account, the Central Anatolia region could become more vulnerable to desertification in the future. Decreases in the amounts of precipitation in the winter and autumn seasons that were determined for four stations (Aksaray, Konya, Karaman and Karapınar) varied between 30% and 80% [24].
The purpose of this study is to show changes in the spatial distribution and interannual variations of rainfall and temperature and the effects on the climate of Central Anatolia by examining descriptive statistical features of annual rainfall totals and intensity. The informations related to Central Anatolia region are limited, not detailed, and comprise it’s a part in the studies above mentioned. However, in our study, essential information on rainfall and temperature climatology of this region are given by examining descriptive statistical features of annual rainfall totals, trend in seasonal rainfall, decreasing and increasing in these climatic parameters, and most importantly changing in climate.
2. Location and Present Climate of Central Anatolia
Central Anatolia is one of the seven geographical regions in Turkey. This region is located in the middle part of Turkey (Figure 1). As a result of this location, Middle Anatolia has been also named. Area of this region is 151.000 km2 and covers 21% of Turkey’s area. Taurus Mountains having above 3000 m summits are found in the south and North Anatolian Mountains having above 2500 m summits are found in the north of Central Anatolia. It’s above mean sea level changes between 1000 m-1200 m. Marinal-humid mild weather could not penetrate because of surrounded by mountains. So, climate being hot and dry in summer, and cold and rainy in winter is dominant in this region. Continentality increases toward east depending on increasing elevation. The mean annual temperature ranges between 12˚C and 8˚C. The
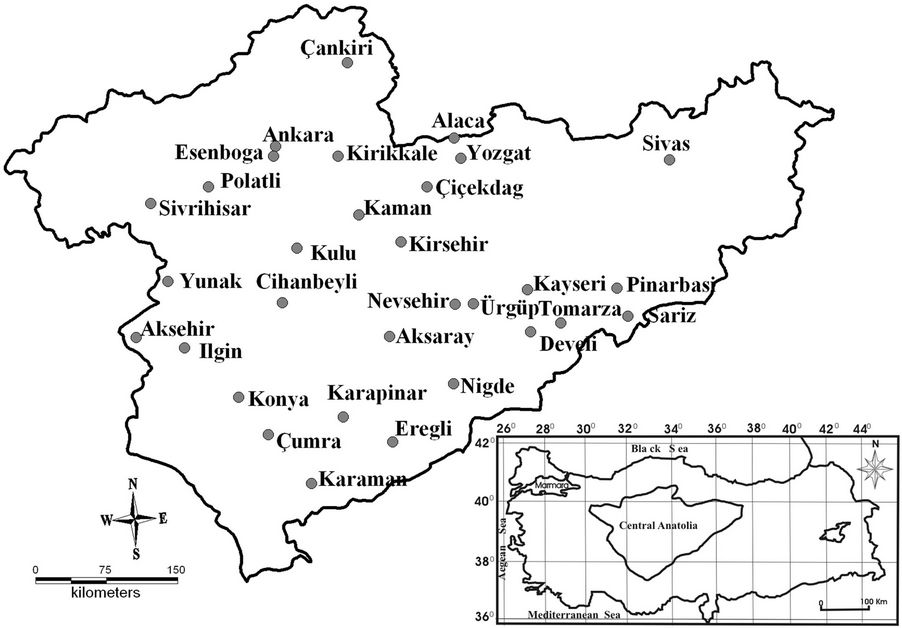
Figure 1. Location of the study area and its provinces (stations).
mean January temperature is 0˚C and the mean July temperature is above 20˚C. Temperature difference in day is excessive, and temperature being above 30˚C in day falls to 15˚C in night. The mean annual rainfall amount is below 400 mm. Three or four months of the year are dominant drought. The rainiest season is spring in the east and winter in the west of this region. This situation is related to frontal activity [35]. Rain type is convectional and frontal. Semi arid climate condition is dominant in Central Anatolia depending on temperature and rainfall amounts. Feature of vegetation reflects its climate condition and the common vegetation formations are dry forests and anthropogenic steppes.
3. Materials and Methods
This paper is based on a postgraduate thesis [36]. In this study, we used a GIS system to calculate climate indices for about 33 meteorological stations in Central Anatolia for the period of 1975-2007. The climate of Central Anatolia was determined using Erinç’s aridity index (precipitation efficiency) (Im) (Equation (1)) which [37] is based on the precipitation and the maximum temperature that causes the water deficiency by evaporation. Im is defined as follows
 (1)
(1)
where, P and Tmax equal the long-term average of the annual precipitation total (mm) and of annual maximum temperature (˚C) respectively. Analyses of Erinç’s aridity index showed that concurrences of dry conditions occurred generally during the early 1990s; consequently, the period (1975-2007) was divided into two periods: 1975-1990 (first period) and 1991-2006 (second period). These periods were compared to each other using maps (Figures 2 and 3). [37] discussed the spatial distribution of vegetation type (Table 1) using the results of the index and divided the index into six main categories.
We included data on annual rainfall and temperature provided by Turkish State Meteorological Service to calculate aridity value trends, annual rainfall total, rainfall intensity and seasonal rainfall intensity, and then tested these using the Mann-Kendall rank correlation coefficient test [38]. The critical significance level of the test is at least of 0.05.
According Erol [39], rainfall intensity at the stations was calculated as the ratio between total amount of rain water and duration of the rainfall. The basic equation of Ri is defined as follows
 (2)
(2)
where, Ri (cm/day) is rainfall intensity, Ar is total amount of rain water (cm) and, Rd is duration of the rain-
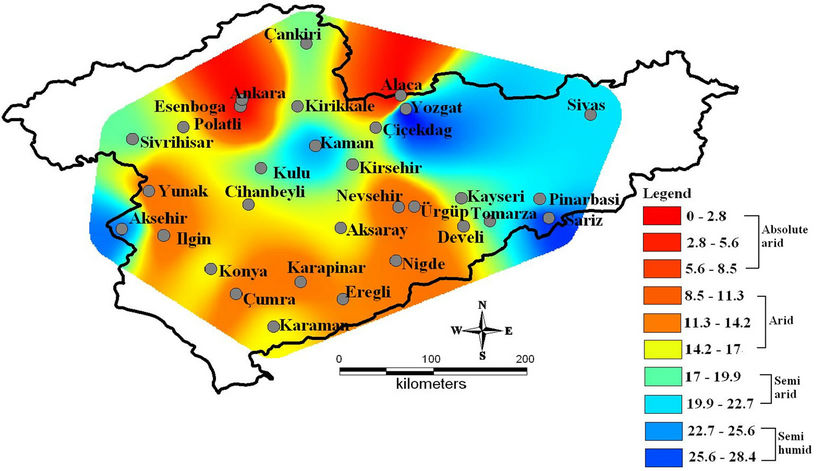
Figure 2. The mean aridity value from 1975-1990.

Figure 3. The mean aridity value from 1991-2007.
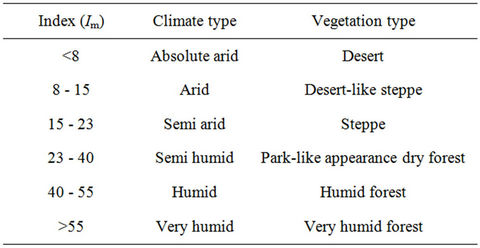
Table 1. Erinç’s climate types corresponding to the aridity index (Im) and vegetation types (Erinç, 1965).
fall as day. Monthly totals of the daily rainfall data existing for 21 stations of the Turkish State Meteorological Service have been used for analysis of the rainfall intensity.
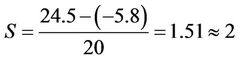
The frequency of the mean temperature and rainfall at fourteen stations was determined (Table 2). First, a value classification range (S) (Equations (3)-(5)) was determined according to [40]. This term comprise data among specific values. Frequency consists of three concepts: absolute frequency, relative frequency and cumulative relative frequency. The absolute frequency (Af) is how many times temperature values belonging to specific value classification were repeated during the observation period. The relative frequency (Rf) is percent value of Af. When comparing the first and second periods, lower values indicating important changes in relative frequency are determined as reference temperatures. To calculate decreasing ratios and increasing ratios, the relative frequencies of the values classified as being below the reference temperature were summed to find the temperature percentage. Additionally, it would be very helpful to provide an example of a calculation done with real data. For example temperature frequency of Niğde was calculated (Table 3)
 (3)
(3)
 (for 1st period) (4)
 (for 2nd period) (5)
4. Results and Discussion
4.1. Frequency of Temperature
The relative frequency of the annual mean temperature (1975-2007) and reference temperature and increasing ratio in temperature of the selected provinces are shown in Table 4. These values are calculated to like Table 3.
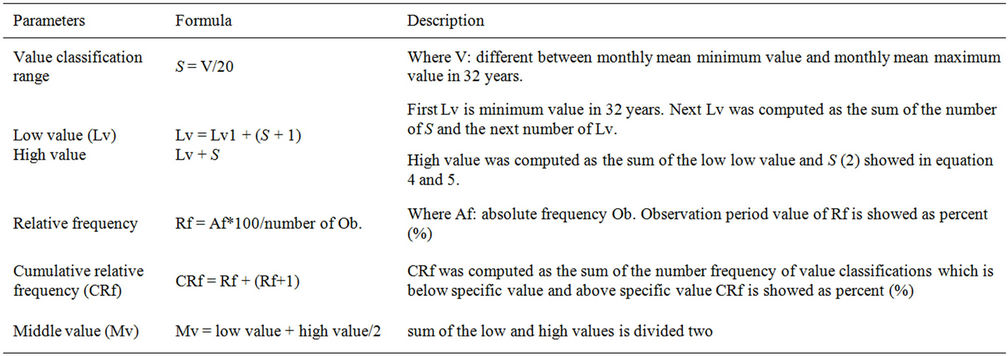
Table 2. The climatic parameters and their mathematical expressions according to Erinç (1994).
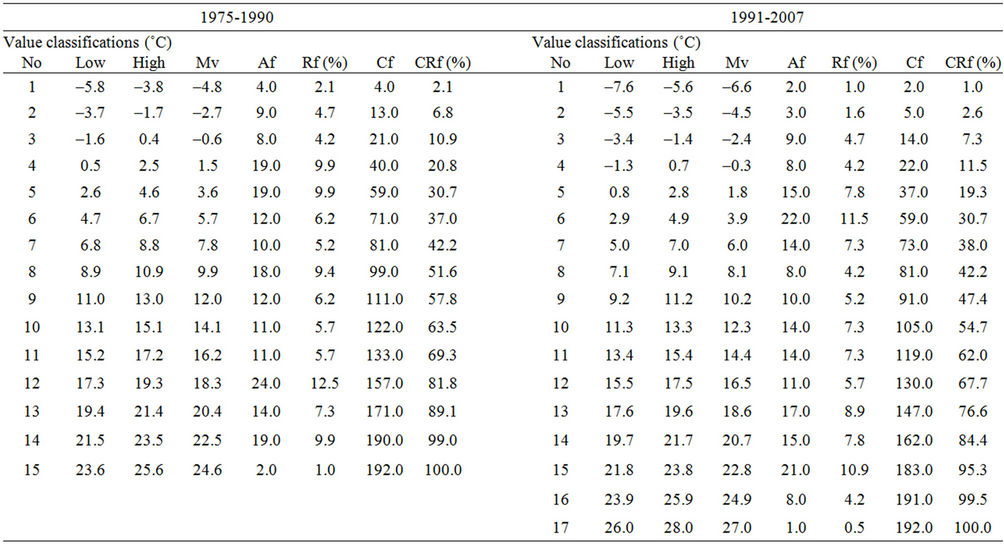
Table 3. The value classification and frequency of Nigde in a example table.
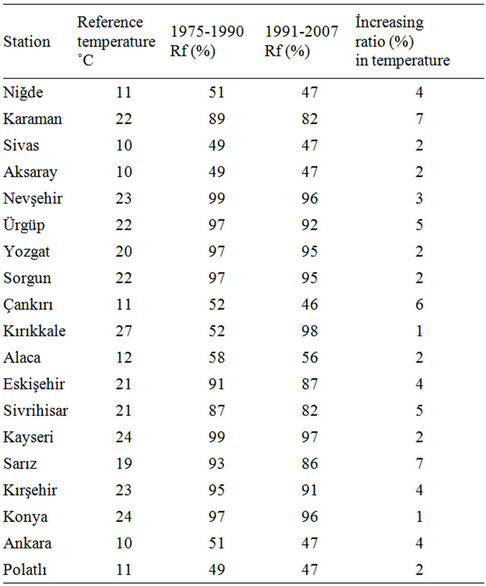
Table 4. Reference temperature, temperature ratio and increase in temperature in the stations during the first and second periods.
According to Tables 4, the relative frequency (Rf) of temperatures below 11˚C was 51% between 1975 and 1990 (first period) in Niğde. This frequency was 47% between 1991 and 2007 (second period). Therefore, the temperature ratio increased by 4% in Niğde.
The Rf of temperatures below 22˚C was 89% during the first period in Karaman. This frequency was 82% during the second period. In this location, the temperature ratio increased by 7%.
The Rf of temperatures below 10˚C was 49% during the first period in Sivas and Aksaray. This frequency was 47% during the second period. Therefore, the temperature ratio increased by 2% at these stations.
The Rf of temperatures below 23˚C, 24˚C and 22˚C was 99%, 99% and 97% during the first period in Nevşehir, Kayseri and Ürgüp, respectively. This frequency was 96%, 97% and 92% during the second period; therefore, the temperature ratio increased by 3%, 2% and 5% in Nevşehir, Kayseri and Ürgüp, respectively.
The Rf of temperatures below 20˚C and 22˚C was 97% and 95% during the first and second periods, respectively, in Yozgat and Sorgun. Therefore, the temperature ratio increased by 2% in these stations.
The Rf of temperatures below 11˚C was 52% and 96% during the first and second periods, respectively, in Çankırı. In Çankırı, the temperature ratio increase was 6%.
The Rf of temperatures below 27˚C was 99% and 98% during the first and second periods, respectively, in Kırıkkale, and the temperature ratio increased by 1% in this station as well.
The Rf of temperatures below 12˚C was 58% and 56% during the first and second periods, respectively, in Alaca, and the temperature ratio increased by 2% in this station.
The Rf of temperatures below 21˚C was 91% and 87% during the first period in Eskişehir and Sivrihisar, respectively. It was 87% and 82% during the second period, and the temperature ratio increased by 4% and 5% in Eskişehir and Sivrihisar, respectively.
The Rf of temperatures below 24˚C and 19˚C was 99% and 93% during the first period in Kayseri and Sarız, respectively. This frequency was 97% and 86% during the second period, and the temperature ratio increased by 2% and 7% in Kayseri and Sarız, respectively.
The Rf of temperatures below 23˚C and 24˚C was 95% and 97% during the first period in Kırşehir and Konya, respectively. This frequency was 91% and 96% during the second period. The temperature ratio increased by 4% and 1% in Kırşehir and Konya, respectively.
The Rf of temperatures below 11˚C was 49% and 47% during the first and periods, respectively, in Polatlı, and the temperature ratio increased by 2% at this station.
4.2. Climate Type and Trend in the Mean Aridity Value
The climate and vegetation types of the stations in the study area (Figures 2 and 3) were determined using Erinç’s aridity index (Table 5). According to this index, arid conditions and desert-like steppe vegetation prevail in Niğde, Karaman, Aksaray, Konya, Karapınar, Ereğli, Çumra, Cihanbeyli, Kulu and Polatlı. Semi-arid conditions and steppe vegetation prevail in Sivas, Nevşehir, Yozgat, Çankırı, Çorum, Sivrihisar, Kayseri, Pınarbaşı, Tomarza, Kaman, Çiçekdağ, Ilgın, Yunak and Esenboğa. Semi-humid conditions and park-like dry forest vegetation are dominant only in two of the stations, Sarız and Yozgat. According to Figure 4, increasing rainfall trends were observed in Karaman, Niğde, Çankırı, Kırıkkale, Sivrihisar, Pınarbaşı, Develi, Çiçekdağ, Konya, Krapınar, Ereğli, Çumra, Akşehir, Yunak, Esenboğa and Polatlı. Decreasing trends were observed in Sivas, Aksaray, Nevşehir, Ürgüp, Yozgat, Kayseri, Tomarza, Sarız, Kırşehir, Kaman, Cihanbeyli, Kulu and Ilgın. Kaman has the highest decreasing rainfall trend, and Nevşehir, Yozgat and Ürgüp follow in descending order. Other high values are found in Nevşehir, Ereğli, Konya, Akşehir and Sarız. The lowest decreasing rainfall trend was found in Karaman, Pınarbaşı, Sivrihisar, Çumra, Akşehir and Esenboğa. Increasing trends were not evident in other stations.
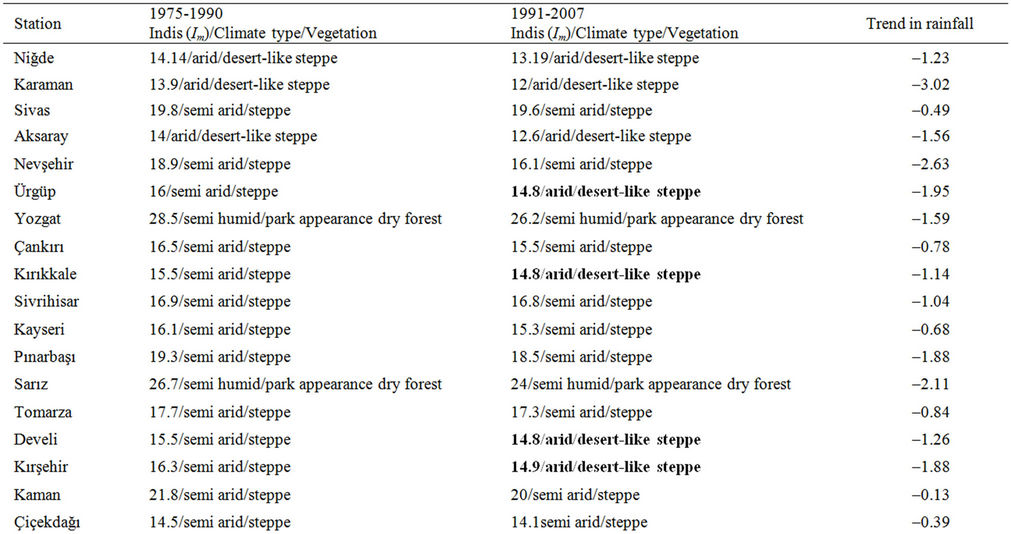
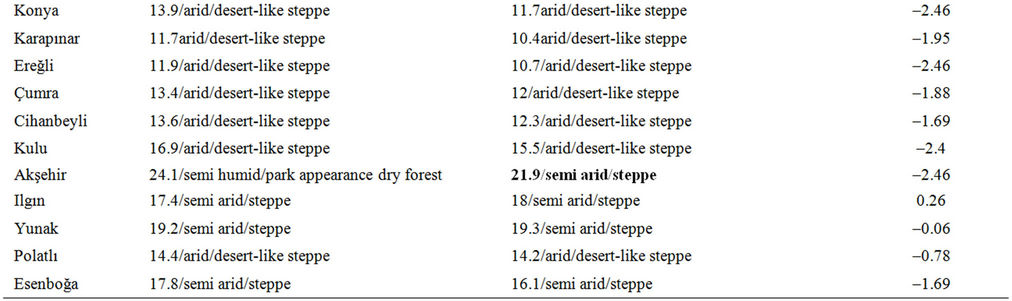
Table 5. Climate and vegetation types, according to Erinç’s aridity index, of the provinces located in Central Anatolia for the periods 1975-1990 and 1991-2007. Bold rows show areas where the Erinç’s climate and vegetation category has changed.
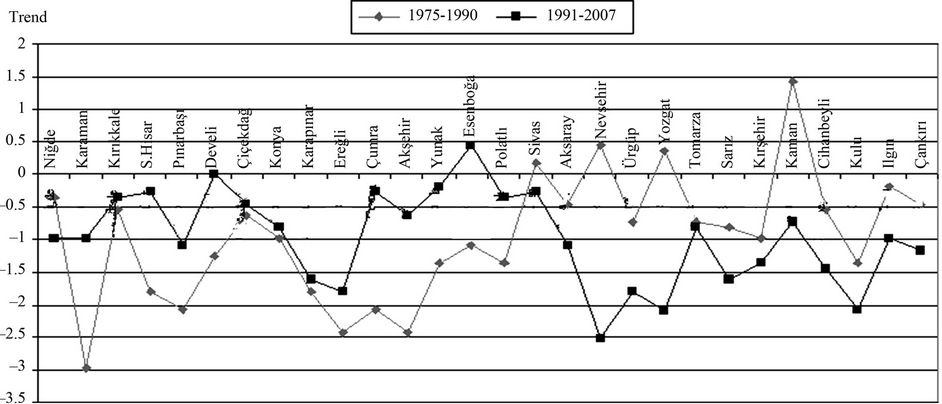
Figure 4. Trend in the aridity index of the stations from 1975-2007.
4.3. The Mean Rainfall Intensity (MRI)
As shown in Table 6, decreases and increases in MRI are established in the study area. Decreases in MRI were established for twelve stations. The percentage decrease ranged between 0.3% and 21% for Karaman, Aksaray, Kayseri, Pınarbaşı, Sarız, Tomarza, Kırşehir, Konya, Ereğli, Akşehir and Polatlı. Although a decrease in MRI is not significant in some stations, such as Kayseri, Ereğli, Karaman, Polatlı and Akşehir, this decrease is significant in Tomarza, Pınarbaşı, Sarız, Konya and Kırşehir. Increases in MRI were observed in ten stations located in the north of Central Anatolia except for Cihanbeyli and Kulu. These stations are Çankırı, Kırıkkale, Sivrihisar, Develi, Kaman, Çiçekdağ, Cihanbeyli, Kulu, Ankara and Esenboğa. The percentage increase ranges between 0.8% and 11.4%. The stations with significant increases are Cihanbeyli, Çankırı, Kırıkkale and Kulu.
4.4. Seasonal Rainfall Intensity of the Stations
According to Table 7, decreases in seasonal rainfall intensity (SRI) were found in Karaman, Aksaray, Çankırı, Pınarbaşı, Sarız, Tomarza, Kırşehir, Çiçekdağ, Akşehir, Ankara, Konya and Ereğli during winter. The decrease ranged between 4% and 25.2%. No changes were found in Esenboğa during this season. The greatest decrease was 25.2% in Pınarbaşı. The other large decreases belonged to Tomarza, Sarız, Konya, Aksaray, Çankırı, Akşehir and Karaman. As seen in Figure 5, the winter rainfall at some stations, which are above 3.4 cm/day of the mean intensity of winter rainfall during the first period, decreased below 3 cm/day during the second period. Generally, the stations located in the south, east and southeast of Central Anatolia had low rainfall values during the second period (Figure 6).
An increase of winter SRI was found in Cihanbeyli, Kayseri, Develi, Sivrihisar, Kulu, Kırıkkale, and Kaman during the second period. The highest increase was 8.8% in Cihanbeyli. The increases ranged between 2.3% and 8.8%. The increasing ratios were not as strong as the decreasing ratios. Generally, this increase was observed in the north and northwest of Central Anatolia (Figure 6).
Decreases of spring SRI were found in eight stations. The SRI values were 4 cm/day, 4.4 cm/day and 4.8 cm/day in Konya, Karaman and Pınarbaşı, respectively, during the first period (Figure 7). These values were 3.2 cm/day, 3.8 cm/day and 3.7 cm/day, respectively, during the second period. The decreases in spring SRI ranged between 0.5% and 20% during the second period. The highest decreasing of the spring SRI was 20% in Konya. Other high ratios were found in Karaman, Pınarbaşı, Ereğli, Aksaray, Sarız, Tomarza and Akşehir. An increase in the spring SRI was observed in thirteen stations; these were Çankırı, Kırıkkale, Sivrihisar, Kayseri, Develi, Kırşehir, Kaman, Çiçekdağ, Cihanbeyli, Kulu, Ankara, Polatlı and Esenboğa. The increases ranged between 2.5% and 19.4%. The smallest increase was found in Esenboğa and Çankırı and was 2.5%. According to Figure 8, a generally decreasing in the spring SRI was found in the south and southeast, and an increase was found in the north and northwest of Central Anatolia.
A decrease of summer SRI was found in eleven stations and an increase of summer SRI was found in nine stations. No change was found in Kaman. The greatest decrease was 35.3% in Tomarza. Other high ratios were found in Kayseri, Pınarbaşı, Akşehir, Sivrihisar, Esenboğa, Polatlı, Develi, Konya, Ankara and Sarız. The summer SRI values were 5.1, 4.4 and 4.1 in Tomarza, Kayseri and Pınarbaşı, respectively, during the first period (Figure 9). These values were 3.3, 3.7 and 3.6, respectively, during the second period (Figure 10). The decreases ranged between 2.4% and 35% during the second period. The highest increase of summer SRI was found in Çiçekdağ at 23.5%. Other high increases were found in Kırıkkale, Cihanbeyli, Ereğli, Karaman, Kulu, Aksaray, Kırşehir and Çankırı. These increases ranged between 2.5% and 23.5%. As shown in Figure 10, generally decreasing values were seen in the south, east and northwest; increases were found in the northern and middle part of Central Anatolia.
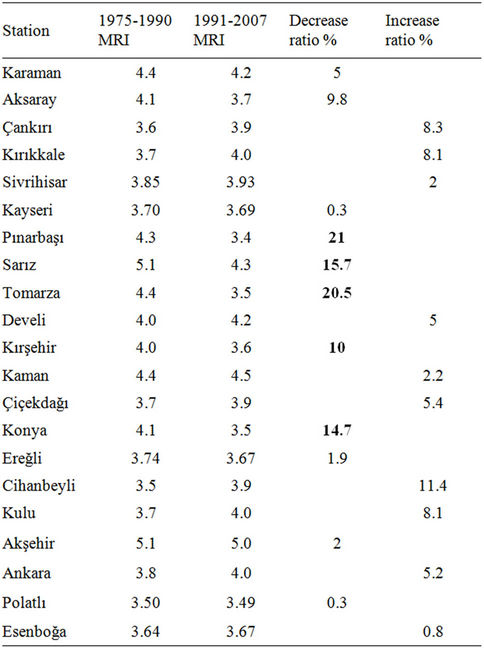
Table 6. The mean rainfall intensity (MRI) of the stations. Bold rows show areas where have greatly decreasing in rainfall intensity.
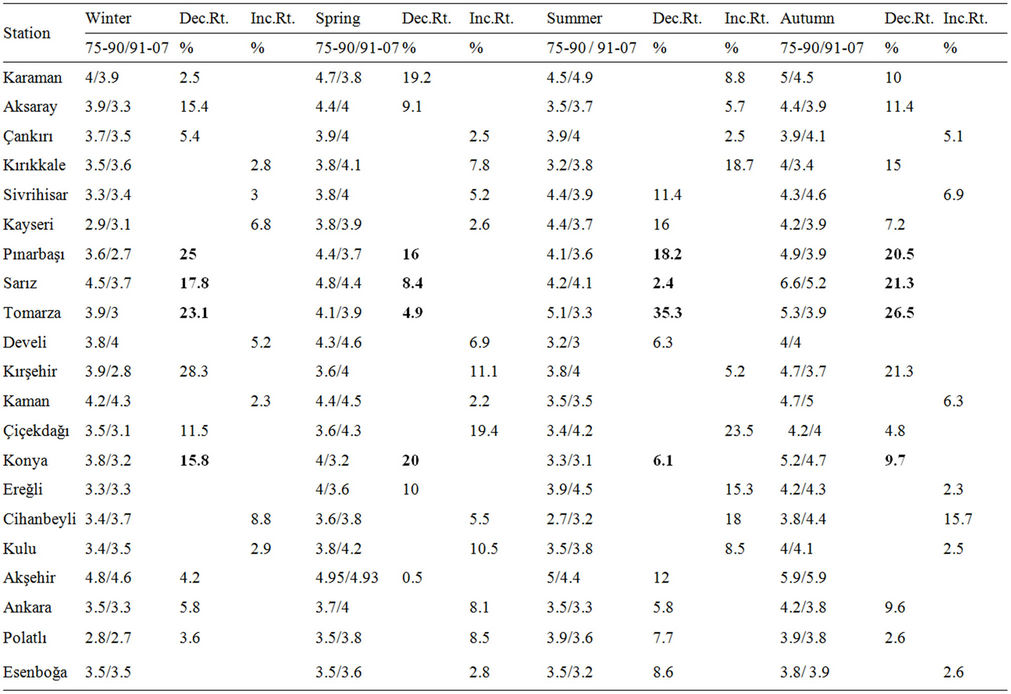
Table 7. Seasonal rainfall intensity of the stations (Dec.Rt.:decreasing ratio, Inc.Rt.:increasing ratio). Bold rows show areas show areas where have greatly decreasing during all seasons.
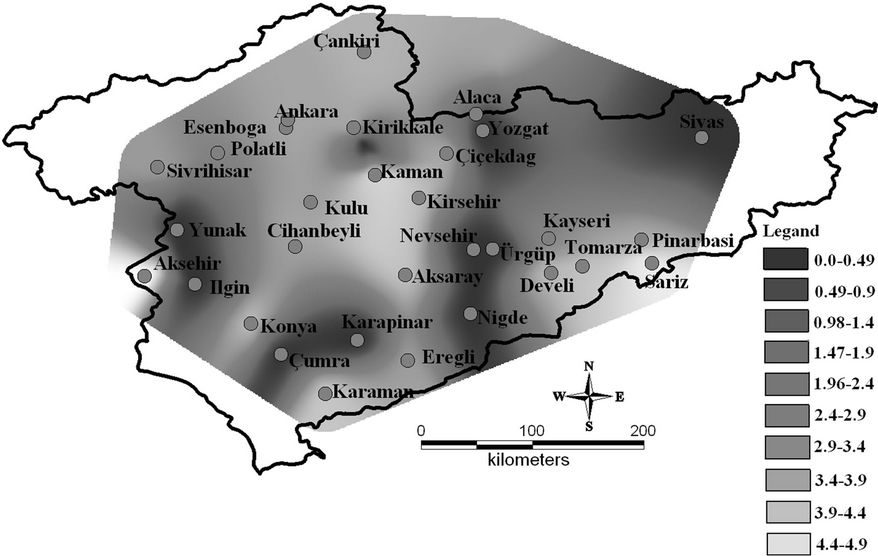
Figure 5. 1975-1990 winter rainfall intensity amount at the selected stations.
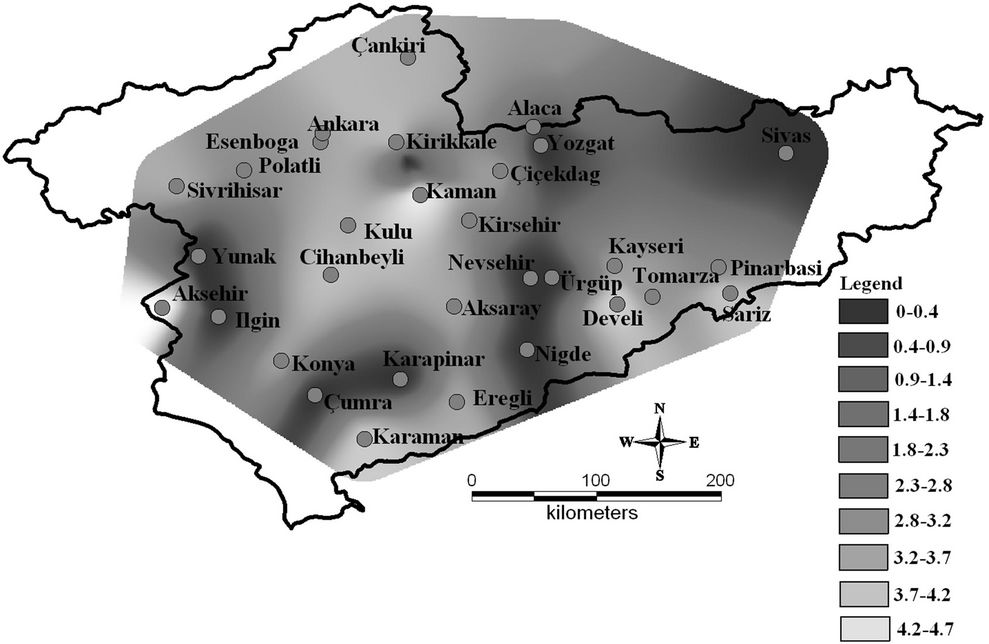
Figure 6. 1991-2007 winter rainfall intensity amount at the selected stations.
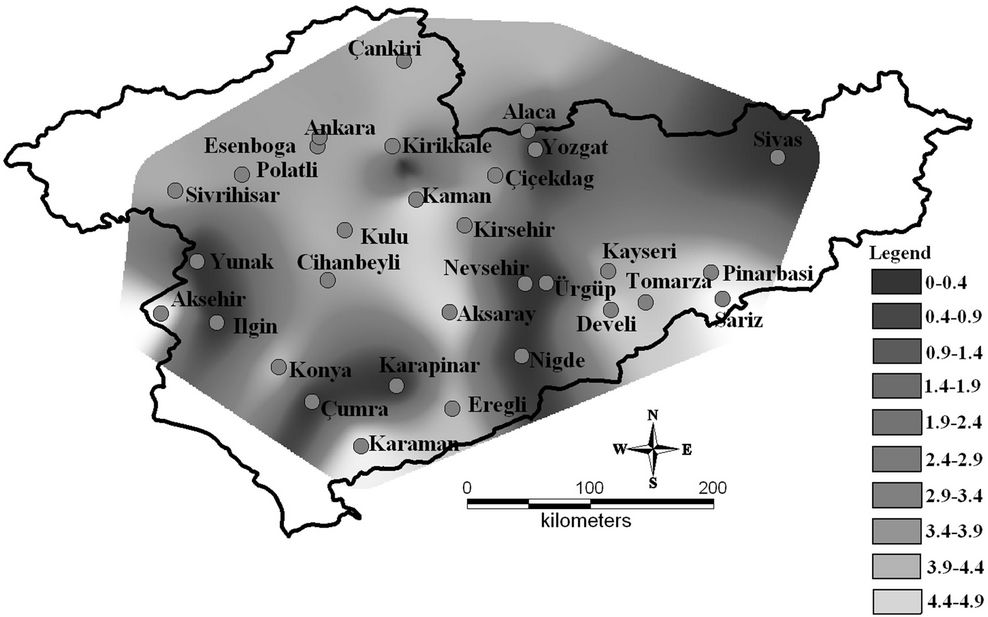
Figure 7. 1975-1990 spring rainfall intensity amount at the selected stations.
Figure 8. 1991-2007 spring rainfall intensity amount at the selected stations.
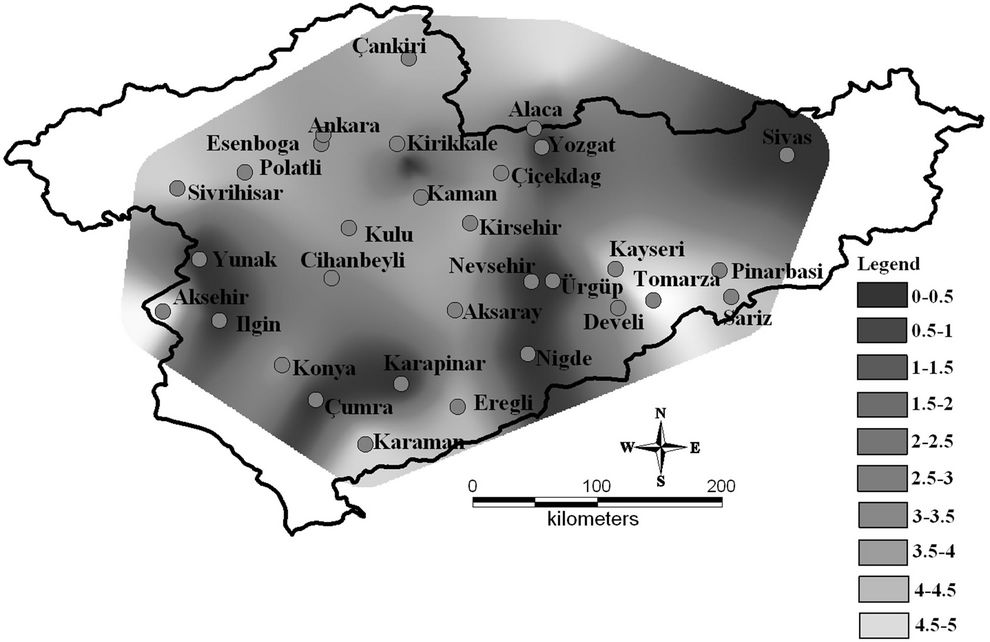
Figure 9. 1975-1990 summer rainfall intensity amount at the selected stations.
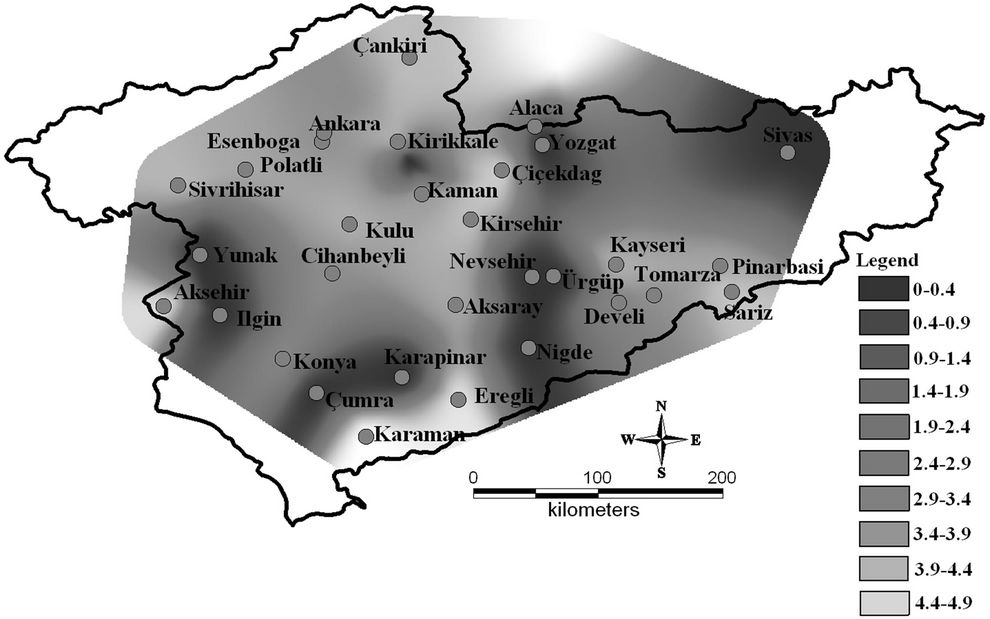
Figure 10. 1991-2007 summer rainfall intensity amount at the selected stations.
A decrease in the autumn SRI was found in twelve stations; an increase was found in seven stations and no change was found in two stations (Develi and Akşehir). The SRI values were 6.6 cm/day, 5.3 cm/day, 4.9 cm/day and 4.7 cm/day in Tomarza, Sarız, Kırşehir and Pınarbaşı, respectively, during the first period (Figure 11). These values were 3.9, 5.2, 3.7 and 3.9, respectively, during the second period. The decreases ranged between 2.6% and 26.5% during the second period. The largest decrease was 26.5% in Tomarza, followed by Sarız, Kırşehir, Pınarbaşı, Kırıkkale, Aksaray, Karaman, Konya, Ankara, Kayseri, Çiçekdağ and Polatlı. Increases of autumn SRI were observed in Cihanbeyli, Sivrihisar, Kaman, Çankırı, Esenboğa, Kulu and Ereğli. The smallest increase of SRI among the seasons occurred in autumn during the second period. The percentage increase ranged between 2.3% and 15.7%. The smallest increase was 2.3% in Ereğli. According to Figure 12, generally decreasing ratios were found in the south and east, and increases were seen in the northern part of Central Anatolia.
4.5. Trend of Total Annual Rainfall and Annual Rainfall Intensity
In the study area between 1975 and 2007, trends of total annual rainfall and the annual and seasonal rainfall intensity of 31 and 21 stations were analyzed by considering their spatial and temporal characteristics.
Decreasing trends of total annual rainfall were found in 25 stations, and increasing trends were found in six stations (Figure 13). The highest decreasing trend was observed in Karaman, Konya, Sarız, Kulu, Akşehir and Pınarbaşı. The lowest decreasing trend was observed in Develi, Çankırı, Polatlı, Yozgat, Ankara and Esenboğa. In addition, the same decreasing rainfall trends have been found around Kayseri and Sarız. Increasing trends were found in Ilgın, Yunak, Kaman, Çiçekdağ, Keskin and Sivas. According to this analysis, apparent decreasing trends of annual rainfall totals are stronger in the south and east of Central Anatolia. Increasing trends were seen clearly in the northern parts.
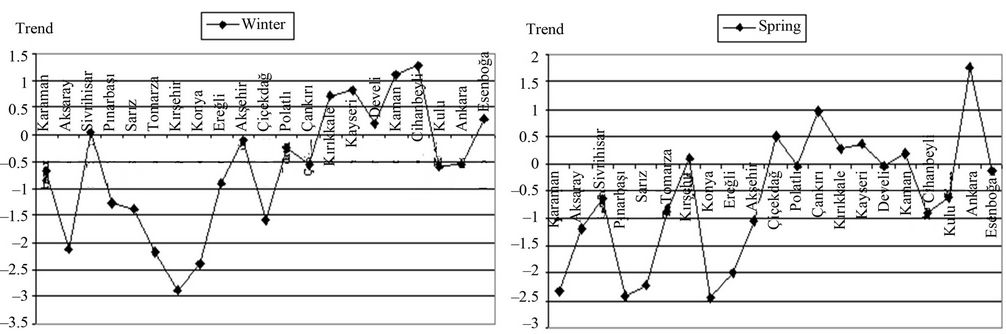
According to Figure 14, a decreasing trend of annual rainfall intensity was found in twelve stations, and an increasing trend was found in nine stations. The decreasing trend was considerably severe in Tomarza, Sarız, Pınarbaşı, Konya, Aksaray and Karaman. This trend was not evident in Sivrihisar and Polatlı. A significant increasing trend was observed in Cihanbeyli, Kayseri and Ankara. There was no statistically significant trend in the rainfall intensity in the other stations. A decreasing trend of winter rainfall intensity (Figure 15(a)) was found in fourteen stations, and an increasing trend was found in seven stations. A strongly decreasing trend was evident in Tomarza, Kırşehir, Konya, Aksaray, Pınarbaşı, Ereğli, Karaman and Çiçekdağ.
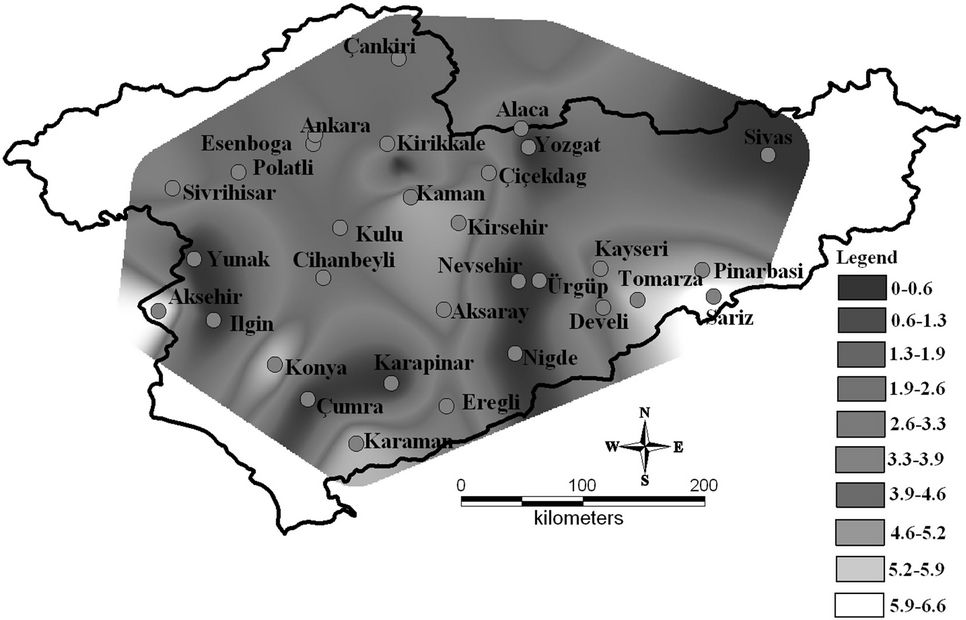
Figure 11. 1975-1990 autumn rainfall intensity amount at the selected stations.
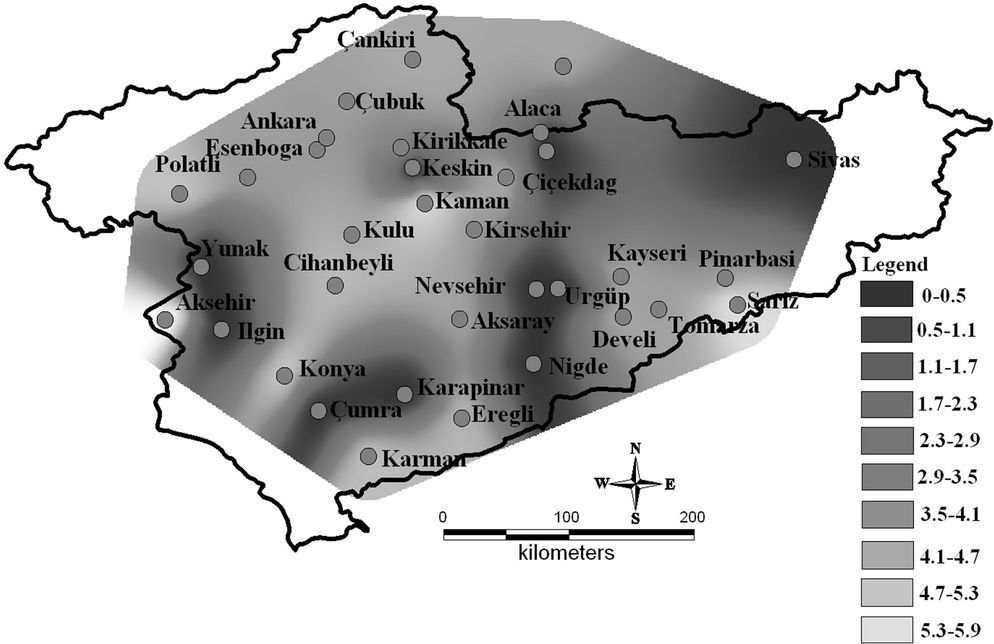
Figure 12. 1991-2007 autumn rainfall intensity amount at the selected stations.
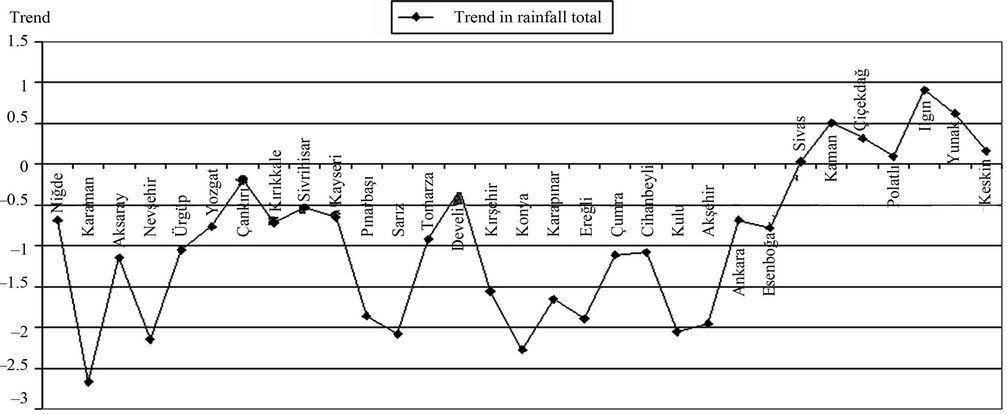
Figure 13. Trend in annual rainfall total of 31 stations.
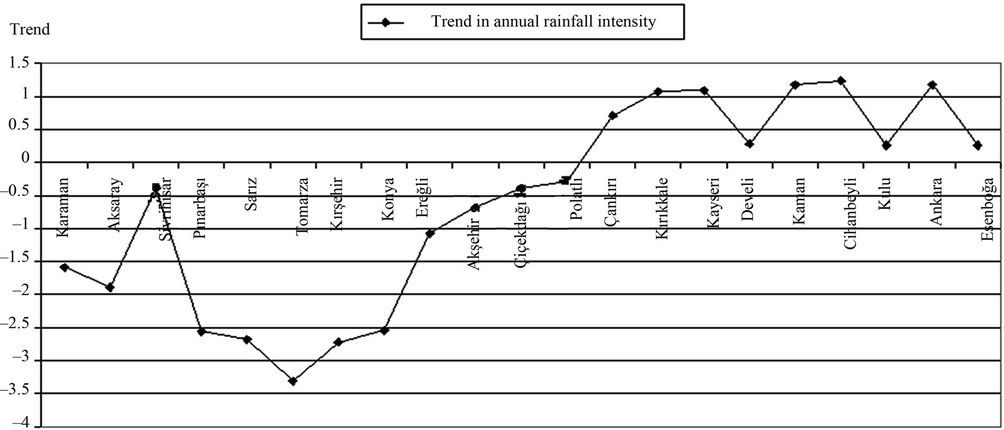
Figure 14. Trend in annual rainfall intensity of 21 stations.
 (a) (b)
Figure 15. Trend in winter (a) and spring (b) rainfall intensity of 21 stations.
The other stations with decreasing trends were Akşehir, Polatlı, Çankırı, Kulu and Ankara. Increasing winter rainfall trends were not strong in Sivrihisar, Kırıkkale, Kayseri, Develi, Kaman, Cihanbeyli, Esenboğa and Ankara. Spring conditions were not much different from winter conditions. A decreasing trend of spring rainfall intensity was found in fourteen stations, and an increasing trend was found in seven stations (Figure 15(b)). A strongly decreasing trend was evident in Konya, Ereğli, Karaman, Aksaray, Pınarbaşı, Sarız, Akşehir, Tomarza, Cihanbeyli and Kulu. No decreasing trend was evident in Kırşehir, Polatlı, Develi and Esenboğa. A significant increasing trend of spring rainfall intensity was observed only in Ankara.
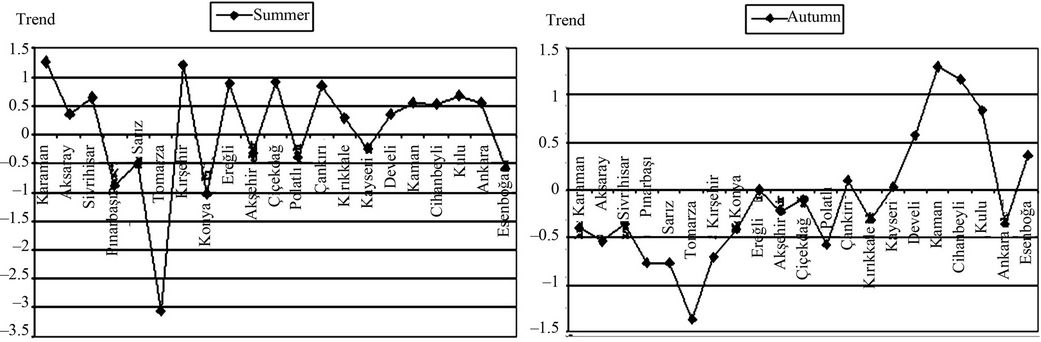
A decreasing trend of summer rainfall intensity (Figure 16(a)) was dominant in eight stations. These stations were Tomarza, Pınarbaşı, Sarız, Konya, Kayseri, Polatlı, Akşehir and Esenboğa. A small increase of this trend was observed in the other stations. A strongly decreasing trend was is found in Tomarza and the stations surrounding it. A decreasing trend of autumn rainfall intensity (Figure 16(b)) was found in thirteen stations, an increasing trend was found in seven stations, and there was no change in one station. The stations with decreasing trends were Tomarza, Sarız, Kırşehir, Pınarbaşı, Karaman, Aksaray, Sivrihisar, Konya, Akşehir, Çiçekdağ, Polatlı, Kırıkkale and Ankara. An increasing trend was dominant in Çankırı, Kayseri, Develi, Kaman, Cihanbeyli, Kulu, and Esenboğa. However, this trend was not strong. Decreasing trends during all seasons were notably found in Tomarza, Sarız, Polatlı, Akşehir, Konya, and Pınarbaşı. Increasing trends during all seasons were observed only in Kaman and were found only during summer in Karaman, Aksaray and Ereğli. Decreasing trends of winter and spring rainfall intensity were evident, whereas a generally increasing trend was observed for summer and autumn rainfall intensity.
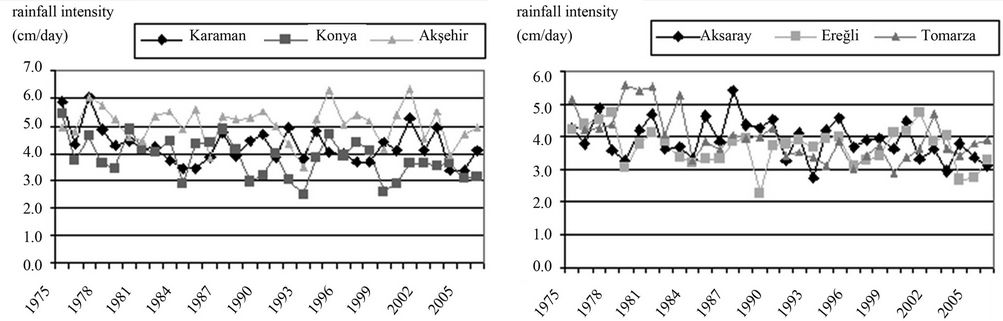
On an annual scale, the majority of rainfall amounts showed a long-term decreasing trend in rainfall intensity. The decreasing trend in rainfall intensity became stronger after 1989 and 1990. This situation was more evident in Akşehir, Konya, Karaman (Figure 17(a)), Ereğli, Aksaray
 (a) (b)
Figure 16. Trend in summer (a) and autumn (b) rainfall intensity of 21 stations.
 (a) (b)
Figure 17. Annual changes in rainfall intensity amount of the selected stations around Konya(a) and Tomarza (b).
and Tomarza (Figure 17(b)) but was not present in Cihanbeyli, Kayseri and Develi (Figure 18). There was a negligible increase in these stations. The increasing trend is due to an increase in summer, autumn and winter rainfall amounts. A strongly decreasing trend was observed in 1984 in Konya and Tomarza. The beginning of the drier-than-normal conditions occurred at the end of the 1970s and early 1980s in southern and eastern Central Anatolia.
A significant decrease in rainfall intensity was evident during 1977 and 1986 in Polatlı, Esenboğa, Ankara (Figure 19(a)), Çankırı and Sivrihisar (Figure 19(b)). The significant decrease also occurred in Kırıkkale in 1979 (Figure 19(b)). A continuous decrease was found in Kırşehir from 1991 to 2007. However, there was no significant decrease in Kaman from 1991 to 2005. Decreasing trends were observed in Polatlı and Çiçekdağ in the early 2000s. A significant increasing trend was seen in Çiçekdağ in 1988 (Figure 20).
5. Discussion
Temperatures and rainfall amounts between 1975 and 2007 allowed us to visualize and evaluate climate changes on annual and seasonal scales. The results of statistical trend analyses and Erinç’s aridity index showed that both temperature and rainfall amounts have decreased significantly, and the climate is becoming increasingly drier at many stations. Changes in climate occurred in some stations due to decreases in rainfall and increases in temperature. Semi-arid and semi-humid climates prevailed in Ürgüp, Kırıkkale, Develi, Kırşehir and Akşehir between 1975 and 1990. However, arid and semi-arid conditions have prevailed in these stations between 1990 and the present. Comparing the first and second periods shows that the climate at the stations be-came increasingly drought-like over time. Semi-arid conditions prevailed in Ürgüp, Kırıkkale, Develi and Kırşehir, and semi-humid conditions were dominant in Akşehir during the first period (Figure 2). Today, arid conditions and semi-arid conditions are dominant in Ürgüp, Kırıkkale, Develi, Kırşehir and Akşehir due to low rainfall (Figure 3). The second period rainfall values are lower than those of the first period. As a result of these conditions, the study area is vulnerable to desertification processes. These results correspond to those of [27] in Cappadocia district. [41] examined the distribution of vegetation and the climate of Karacadağ Mt. and Karadağ Mt., which are located in the north of Karaman, for the period of 1929-2003 and reported an increasing trend of the mean annual temperature from the end of the 1990s to the present in Karaman. This increase was established as 0.5˚C by the same author. According to [27], the Nevşehir, Kayseri and Ürgüp environs are the most continental parts of the Cappadocia district and showed high inter-annual variability and low temperatures for the period of 1929-2002.
[41] showed that the amount of rainfall during each of the last twenty years is below the mean annual rainfall in Karaman. [24] also asserted that decreases in precipitation in the common periods determined for Konya, Kara-
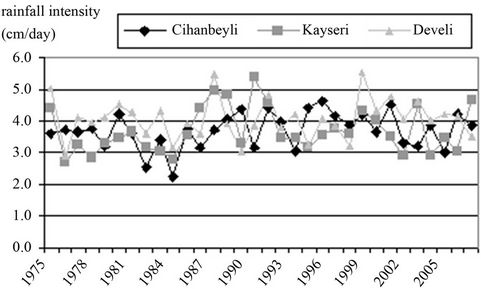
Figure 18. Annual changes in rainfall intensity amount in the Kayseri, Develi and Cihanbeyli.
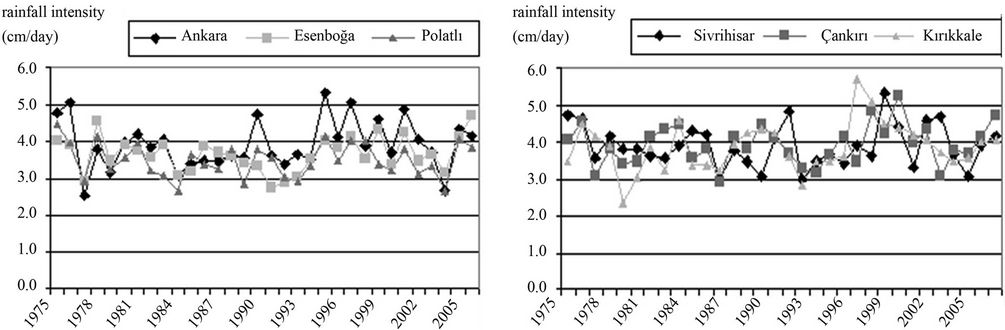
Figure 19. Annual changes in rainfall intensity amount in the Ankara, Esenboğa and Polatlı (a), Sivrihisar, Çankırı and Kırıkkale (b).
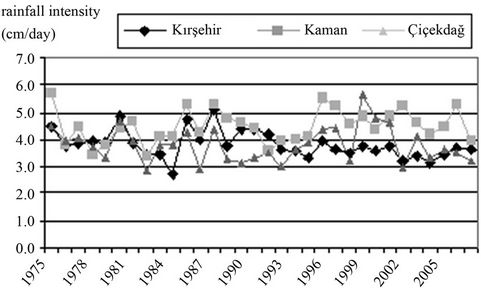
Figure 20. Annual changes in rainfall intensity amount in the Kırşehir, Kaman and Çiçekdağ.
man, Aksaray and Karapınar varied between 30% and 80% and are more evident particularly in winter and autumn. For the Cappadocia district (which is located in the southern part of the study area), [27] analyzed the vulnerability to desertification and reported that the coefficients of variation of the annual rainfall totals were approximately 18% in the north and approximately 20% in the south.
The results of decreasing trends of total annual rainfall are similar to the results of other studies conducted on Turkey and Central Anatolia [17,20,21,30,42]. All of the results in the previous studies show a generally decreasing trend of rainfall amounts. In an analysis of the annual rainfall of Turkey, [15] emphasized that there was a generally decreasing trend of annual rainfall anomalies. [20,24,27] established that there is a strongly decreasing trend in rainfall and this decrease is leading towards drought conditions around Konya and Cappadocia. The drought events of 1972-1974 and 1999-2001 were considerably severe [24]. In terms of rainfall intensity trends, our study is in agreement with [24,27].
Approximately in the last twenty years, studies conducted on regional rainfall changes showed that the sudden decrease in rainfall began in early 1970 in the East Mediterranean basin and Turkey. Changes in winter rainfall amounts show that the strong drought events were established and widespread between 1971-1974 and during 1983, 1984, 1989, 1990, 1996 and 2001 [32,41].
6. Conclusions
Temperature frequency was examined, and temperature increases were found in all of the stations. The amount of increase varied between 1% and 7%. The highest temperature increases were found in Karaman (7%), Çankırı (6%), Niğde (4%), Eskişehir (4%), Kırşehir (4%), and Ankara (4%). Given the data from all of the stations, the mean temperature increase was 2.6% corresponding to 0.4˚C in the Central Anatolia region.
Decreases in the mean rainfall intensity (MRI) were found at twelve stations. The decreases ranged from 0.3% to 21%. The stations showing decreases were Karaman (5%), Aksaray (9.8%), Kayseri (0.3%), Pınarbaşı (21%), Sarız (15.7%), Tomarza (20.5%), Kırşehir (10%), Konya (14.7%), Ereğli (1.9%), Akşehir 2%) and Polatlı (0.3%).
Decreases of SRI were found generally in the south, east and southeast of Central Anatolia. However, increases in SRI were observed generally in the north and northwest of Central Anatolia. The number of stations showing increases in rainfall intensity was less in autumn and winter, whereas the number of stations showing increases in rainfall intensity was far greater in spring. However, the increasing ratios were not as strong as the decreasing ratios.
Decreasing in annual rainfall totals trends was stronger in the south and east of Central Anatolia. Increasing trends were seen clearly northern regions. Decreases of annual rainfall intensity were very severe in Tomarza, Sarız, Pınarbaşı, Konya, Aksaray and Karaman. It is important that decreasing trends during all seasons were found in Tomarza, Sarız, Polatlı, Akşehir, Konya, and Pınarbaşı. These decreasing trends indicate that the south and the east parts of Central Anatolia are vulnerable to the desertification processes. Increasing trends during all seasons were observed only in Kaman.
Decreasing winter and spring rainfall intensity was evident, whereas a generally increasing trend was observed for summer and autumn rainfall intensity. Central Anatolia is characterized by a continental rainfall regime and has its maximum rainfall amount in winter and spring. Therefore, the strongly decreasing trend in annual rainfall totals and rainfall intensity in winter and spring will negatively affect changes of groundwater level and agricultural yield.
On an annual scale, decreasing trends in rainfall intensity became stronger after 1989 and 1990. This situation was more evident in stations in the south and east of Central Anatolia. The beginning of these trends occurred in the late 1970s and early 1980s across most of Central Anatolia.
REFERENCES
- IPCC, “Climate Change: The Intergovernmental Panel on Climate Change Scientific Assessment,” Cambridge University Press, Cambridge, 2007.
- C. K. Folland, T. R. Karl, N. Nicholls, B. S. Nyenzi, D. E. Parker and K. Y. Vinnikov, “Observed Climate Variability and Change, in Climate Change 1992,” The Supplementary Report to the Intergovernmental Panel on Climate Change Scientific Assessment, Cambridge University Press, Cambridge, 1992, pp. 135-170.
- WMO, “The Global Climate System in 1993,” World Meteorological Organization Bulletin, Vol. 43, No. 3, 1994, pp. 226-230.
- WMO, “The Global Climate System in 1992,” World Meteorological Organization Bulletin, Vol. 42, No. 3, 1993, pp. 230-233.
- B. Bolin, “Report to the Ninth Session of the Intergovernmental Negotiating Committee for a Framework Convention on Climate Change (INC/FCCC),” WMO/ UNEP/IPCC, Geneva, 1994.
- M. Türkeş, U. M. Sümer and G. Kılıç, “Variations and Trends in Annual Mean Air Temperatures in Turkey with Respect to Climatic Variability,” International Journal of Climatology, Vol. 15, No. 5, 1995, pp. 557-571. doi:10.1002/joc.3370150507
- M. Türkeş, U.M. Sümer and G. Kılıç, “Observed Changes in Maximum and Minimum Temperatures in Turkey,” International Journal of Climatology, Vol. 16, No. 4, 1996, pp. 463-477. doi:10.1002/(SICI)1097-0088(199604)16:4<463::AID-JOC13>3.0.CO;2-G
- T. E. Maden, “Global Warming and Environmental Security,” Proceedings the 3rd International Conference (BALWOIS 2008) on Water Observation and Information System for Decision Support, Ohrid, 27-31 May 2008, pp. 1-7.
- H. Özlü, “Drought and Water Management,” Proceedings of the National Conference on Climatic Change and Water Economy, Ankara, 2007, pp. 1-77.
- R. Kanber, B. Kapur, M.Ünlü, S. Tekin and L. Koç, “A New Approach to Evaluation of Climatic Change Effect on Agricultural Production System: ICCP Project,” Proceedings TMMOB 2nd National Conference on Water Politics, Ankara, 2007, pp. 83-94.
- M. Atik, T. Altan, M. Atmaca, E. Aktoklu, K. Kaplan, M. Artar, A. Güzelmansur, A. Çinçinoğlu and Y. Büyükaşık, “Climatic Change and Its Effect on Vegetation Cover: ICCAP Project and Seyhan Basin,” Proceedings of the 1st National Conference on Turkey Climatic Change, İstanbul, 21-23 August 2007, pp. 203-211.
- M. Kadioglu, “Climate Change in Turkey and Its Possible Impacts,” Environment Protection, Vol. 47, 1993, pp. 34-37.
- M. Türkeş, U. M. Sümer and G. Kılıç, “Protection of the Atmosphere and Climate Change,” State Meteorological Service, 1992, p. 110.
- M. Türkeş, T. Koç and F. Sarış, “T Spatial and Temporal Analysis of the Changes and Trends in Precipitation Total and Intensity Series of Turkey,” Coğrafi Bilimler Dergisi, Vol. 5, No. 1, 2007, pp. 57-73.
- M. Türkeş, “Spatial and Temporal Analysis of Annual Rainfall Variations in Turkey,” International Journal of Climatology, Vol. 16, No. 9, 1996, pp. 1057-1076. doi:10.1002/(SICI)1097-0088(199609)16:9<1057::AID-JOC75>3.0.CO;2-D
- M. Türkeş, “Vulnerability of Turkey to desertification with Respect to Precipitation and Aridity Conditions,” Turkish Journal of Engineering and Environmental Sciences, Vol. 23, No. 5, 1999, pp. 363-380.
- M. Türkeş, U. M. Sümer and S. Demir, “The Mean Daily Maximum and Minimum Temperature and Trend, and Changes in Temperature Width,” Proceedings National Sırrı Erinç Conference on Climatology, İzmir, 11-13 April 2002, pp. 89-106.
- M. Türkeş, “Spatial and Temporal Variations in Precipitation and Aridity Index Series of Turkey,” In: H.-J. Bolle, Ed., Mediterranean Climate Variability and Trends, Springer Verlag, Heidelberg, 2003, pp. 181-213.
- M. Türkeş, “Drought and Desertification Trend of Turkey and Evaluation in Respect to Climate Change,” Pankobirlik, Vol. 91, 2007, pp. 38-47.
- E. Şen and N. Başaran, “Trends and Changes in Some Climate Data of Konya Plain,” Proceedings National Conference on Global Climate Change, Konya, 16-18 June 2007, pp. 1-8.
- İ. Demir, G. Kılıç, M. Çoşkun and U. M. Sümer, “Changes and Trends in Maximum, Minimum, Mean Temperature and Rainfall Series in Turkey,” Proceedings TMMOB National Conference on Climate Changes, Ankara, 17-19 December 2008, pp. 69-84.
- G. İçel, “Temperature and Rainfall Trend Analysis, and Extreme Events in the East Mediterranean Coasts of Turkey,” Ph.D. Dissertation, Institute of Social Sciences, İstanbul University, Istanbul, 2009.
- M. Türkeş and H. Tatlı, “Use of the Standardized Precipitation Index (SPI) and a Modified SPI for Shaping the Drought Probabilities over Turkey,” International Journal of Climatology, Vol. 29, No. 15, 2009, pp. 2270-2282. doi:10.1002/joc.1862
- M. Türkeş, A. S. Akgündüz and Z. Demirörs, “Drought Periods and Severity over the Konya Sub-Region of the Central Anatolia Region According to the Palmer Drought Index,” Coğrafi Bilimler Dergisi, Vol. 7, No. 2, 2009, pp. 129-144.
- S. Şensoy, M. Demircan and I. Alan, “Trends in Turkey Climate Extreme Indices from 1971 to 2004,” Proceedings the 3rd International Conference on Water Observation and Information System for Decision Support, Ohrid, 27-31 May 2008, pp. 1-9.
- M. Fontugne, C. Kuzucuoğlu, M. Karabıyıkoğlu, C. Hatte and J.-F. Pastre, “From Pleniglacial to Holocene: A 14C Chronostratigraphy of Environmental Changes in the Konya Plain, Turkey,” Quaternary Science Reviews, Vol. 18, No. 4, 1999, pp. 573-591. doi:10.1016/S0277-3791(98)90098-1
- M. Türkeş, “Climate of Southern Part of the Middle Kızılırmak Sub-Region (Cappadocia District) and Its Vulnerability to Desertification,” Aegean Geographical Journal, Vol. 14, No. 4, 2005, pp. 73-97.
- H. Kutiel and Y. Benaroch, “North Sea-Caspian Pattern (NCP)—An Upper Level Atmospheric Teleconnection Affecting the Eastern Mediterranean: Identification and Definition,” Theoretical and Applied Climatology, Vol. 71, No. 1-2, 2002, pp. 17-28. doi:10.1007/s704-002-8205-x
- H. Kutiel, P. Maheras, M. Türkeş and S. Paz, “North Sea Caspian Pattern (NCP)—An Upper Level Atmospheric Teleconnection Affecting the Eastern Mediterranean: Implications on the Regional Climate,” Theoretical and Applied Climatology, Vol. 72, 2002, pp. 173-192. doi:10.1007/s00704-002-0674-8
- H. Kutiel and M. Türkeş, “New Evidence for the Role of the North Sea—Caspian Pattern on the Temperature and Precipitation Regimes in Continental Central Turkey,” Geografiska Annaler. Series A: Physica Geography, Vol. 87, No. 4, 2005, pp. 501-513. doi:10.1111/j.0435-3676.2005.00274.x
- M. K. Erkuş and H. Aksu, “Change of Relation between North Atlantic Oscillation and Precipitation of Southwest Anatolia,” Proceedings the 3rd International Conference (BALWOIS 2008) on Water Observation and Information System for Decision Support, Ohrid, 27-31 May 2008, p. 8.
- M. Türkes and E. Erlat, “Precipitation Changes and Variability in Turkey linked to the North Atlantic Oscillation during the Period 1930-2000,” International Journal of Climatology, Vol. 23, No. 14, 2003, pp. 1771-1796.
- M. Türkes, “Influence of Geopotential Heights, Cyclone Frequency and Southern Oscillation on Rainfall Variations in Turkey,” International Journal of Climatology, Vol. 18, No. 6, 1998, pp. 649-680. doi:10.1002/(SICI)1097-0088(199805)18:6<649::AID-JOC269>3.0.CO;2-3
- T. B. Altın, “The Effects of Wrong Land-Use on Distribution of Vegetation at Mt. Keçiboyduran and Mt. Melendiz,” Journal of Turkish Geography, Vol. 51, 2008, pp. 13-32.
- İ. Atalay, “Ecoregions of Turkey,” The Ministry of Environment and Forestry Press, Ankara, 2002.
- B. Barak, “The Size of Global Warming Depending on the Rainfall and Temperature Data in Central Anatolia, Turkey,” Unpublished Postgraduate Thesis, Nigde University Social Sciences Institute, Nigde, 2009, p. 750.
- S. Erinç, “A Trial on Rainfall Effectiveness,” İstanbul University, Geography Institute Press, Istanbul, 1965.
- WMO, “Climatic Change, WMO Technical Note, No. 79,” Secretariat of the World Meteorological Organization (WMO) Press, Geneva, 1966.
- O. Erol, “General Climatology,” Gazi Büro Press, Istanbul, 1993.
- S. Erinç, “Climatology and Method,” Alfa Press, Istanbul, 1996.
- M. Avcı, “The Last Shelters for the Remaining Forests of the Central Anatolia Region, the Vegetation on Karacadağ Mt. and Karadağ Mt. Volcanoes,” Çantay Press, Istanbul, 2004.
- M. Türkeş and E. Erlat, “Climatological Responses of Winter Precipitation in Turkey to Variability of the North Atlantic Oscillation during the Period 1930-2001,” Theoretical and Applied Climatology, Vol. 81, No. 1-2, 2005, pp. 45-69. doi:10.1007/s00704-004-0084-1