Journal of Behavioral and Brain Science
Vol.2 No.3(2012), Article ID:22107,4 pages DOI:10.4236/jbbs.2012.23044
How Many Electrodes Are Really Needed for EEG-Based Mobile Brain Imaging?
School of Kinesiology, University of Michigan, Ann Arbor, USA
Email: *troylau@umich.edu
Received April 16, 2012; revised May 12, 2012; accepted May 31, 2012
Keywords: Electroencephalography; Mobile Brain Imaging; Walking; Independent Component Analysis
ABSTRACT
A noninvasive method for imaging the human brain during mobile activities could have far reaching benefits for studies of human motor control, for research and treatment of neurological disabilities, and for brain-controlled powered prosthetic limbs or orthoses. Several recent studies have demonstrated that electroencephalography (EEG) can be used to image the brain during locomotion provided that signal processing techniques, such as independent Component Analysis (ICA), are used to parse electrocortical activity from artifact contaminated EEG. However, these studies used high-density 256-channel EEG sensor arrays, which are likely too time-consuming to setup in a clinical or field setting. Therefore, it is important to evaluate how reducing the number of EEG channel signals affects the electrocortical source signals that can be parsed from EEG recorded during standing and walking while concurrently performing a visual oddball discrimination task. Specifically, we computed temporal and spatial correlations between electrocortical sources parsed from high-density EEG and electrocortical sources parsed from reduced-channel subsets of the original high-density EEG. For this task, our results indicate that on average an EEG montage with as few as 35 channels may be sufficient to record the two most dominate electrocortical sources (temporal and spatial R2 > 0.9). Correlations for additional electrocortical sources decreased linearly such that the least dominant sources extracted from the 35 channel dataset had temporal and spatial correlations of approximately 0.7. This suggests that for certain applications the number of EEG sensors used for mobile brain imaging could be vastly reduced, but researchers and clinicians must consider the expected distribution of relevant electrocortical sources when determining the number of EEG sensors necessary for a particular application.
1. Introduction
Electroencephalography (EEG) has long been used to record electrocortical activity within the brain because it is a safe and non-invasive tool [1-3]. EEG is used to monitor ictal and inter-ictal activity in seizure patients [4, 5] and to assess cognitive processes during neuroscience and psychology experiments [6,7]. In addition, EEG is used in brain computer interface devices, which enable command of an electronic device by brain activity modulation [8-11]. Current EEG systems can have as few as four electrodes [11] or as many as 256 electrodes. Until recently, the use of EEG has been limited to stationary settings (i.e., settings where the subject is seated or prone) because of the susceptibility of EEG electrodes to movement and electromyographic artifacts [12-14]. However, we have recently demonstrated that these artifacts can be removed from high-density (256-channel) EEG using advanced computational methods; thus enabling the use of EEG during walking [15-17]. When combined with kinematic motion capture, this novel paradigm has been referred to as Mobile Brain Imaging (MoBI) [1] and is gaining traction as a viable technique to study the human brain under non-stationary conditions. MoBI will open the door to a plethora of new research areas including cognitive control of locomotion, brainbody interactions in neurological disorders, and advancements in the field of brain-machine interfaces.
The use of Independent Component Analysis (ICA), a technique that parses independent component (IC) signals from correlated time-series data [13,14,16,18-22], has been particularly helpful to the development of MoBI. ICA of EEG is based on the premise that each electrode on the scalp records a linear sum of various underlying electrocortical signals, as well as electromyographic, electroocular, electrocardiographic, and movement artifacts. ICA can generate one maximally independent source signal (which may reflect an electrocortical or artifactual source) for each EEG channel signal recorded; the more EEG channels recorded, the more ICs produced [20,21]. Therefore, it is desirable to record from as many EEG sensors as possible if the intent is to capture as many electrocortical processes as possible.
Increasing the number of EEG electrodes used is not trivial, and the increase is not without drawbacks. For high-density EEG systems, data processing can take a significant amount of time, even on large computing clusters. In addition, more electrodes mean higher costs and more difficult experimental setups. Lastly, in experimental setups involving movement and in many real-world settings, wireless transmission of EEG signals is desirable. Increasing the number of electrodes challenges existing wireless transmission systems. Given these drawbacks, a question naturally arises: How many electrodes are needed for MoBI? The answer will likely depend on the tasks being performed and nature of the cognitive activity involved, but we can begin to estimate the number for common situations.
In this study, we assessed how reducing the number of EEG channel signals affects the electrocortical source signals that can be parsed from EEG recorded during standing and walking using ICA. We performed this assessment using data from [16]. This study involved subjects standing and walking while performing a visual oddball discrimination task. We incrementally reduced the number of channels from the EEG montage that were used in the analysis and evaluated changes in the temporal and spatial properties of the resulting electrocortical source signals.
2. Methods
2.1. Data Collections
Twelve healthy volunteers with no history of major lower limb injury and no known neurological or locomotor deficits completed this study (11 males and 1 female, age range 20 - 31 years). All subjects provided written informed consent prior to the experiment. All procedures were approved by the University of Michigan Internal Review Board and complied with the standards defined in the Declaration of Helsinki.
Subjects stood, walked (0.8 m/s and 1.25 m/s), and ran (1.9 m/s) on an in-ground treadmill [23] while we recorded 248-channel electroencephalography at 512 Hz (ActiveTwo, BioSemi, Amsterdam, The Netherlands). Concurrently, standard (80%) and target (20%) stimuli (vertical or 45˚ rotated black crosses on a white background, respectively) were displayed on a monitor placed at eye level about 1 m in front of the subjects. For each gait condition (standing, slower walking, faster walking, running) subjects performed an experimental block wherein they were asked to press a handheld button whenever the target stimulus appeared and a control block wherein no manual response to the target stimulus was required. Each data collection session began with the standing condition, followed by the other three conditions in random order. The standing blocks lasted 5 minutes each while the walking and running blocks lasted 10 minutes each. For the present study, data collected during running were not used due to the presence of large mechanical artifacts in the EEG signals.
2.2. EEG Processing
All processing and analysis was performed in Matlab (The Mathworks, Natick, MA) using scripts based on EEGLAB (sccn.ucsd.edu/eeglab), an open source environment for processing electrophysiological data [18].
After data collection we high-pass filtered the EEG signals above 1 Hz. As in [15,16], EEG signals exhibiting substantial noise throughout the collection were removed from the data in the flowing manner: 1) channels with std. dev. >1000 µV were removed; 2) any channel whose kurtosis was more than 5 std. dev. from the mean was removed; and 3) channels that were uncorrelated (r < 0.4) with nearby channels for more than 1% of the timesamples were removed. Datasets containing fewer than 125 channels after channel rejection were not included in this analysis (data for 7 subjects were retained). For each remaining subject, a subset of 125 channels was selected so that the electrodes were uniformly distributed across the scalp. Next, for each subject, a subset of 115 channels was selected from the 125 channel subset so that the electrode distribution remained maximally uniform. We continued this processes, selecting nested subsets of channels, until we had 11 EEG subsets per subject (125, 115, ···, 25 channels). For each subject and each channel subset, the channel signals were re-referenced to an average reference.
We applied an adaptive mixture ICA algorithm [AMICA] [20,21] to each subset of EEG signals. ICA parses EEG signals into spatially static, maximally independent component processes [22]. Prior to performing ICA decomposition, time-periods of EEG with substantial artifact, as defined by z-transformed power across all channels in a given time window being larger than 0.8, were rejected using EEGLAB. DIPFIT functions within EEGLAB [24] computed an equivalent current dipole model that best explained the scalp topography of each IC using a boundary element head model based on the Montreal Neurological Institute (MNI) template (the average of 152 MRI scans from healthy subjects, available at www.mni.mcgill.ca).
The datasets with 125 channels were considered to be benchmark datasets to which the reduced channel datasets (115, 105, ···, 25 channels) were compared. For this purpose, each of the 125 ICs for the 125-channel ICA decompositions were categorized as electrocortical activity, muscle activity, eye movement artifact, or noise in the following manner. First, if the projection of the equivalent current dipole model to the scalp accounted for less than 85% of the scalp topography variance the component was considered to be noise (scalp topography refers to a mapping of electrode coefficients for each IC onto a 2-dimensional head-map); Second, the scalp topography and time-course of each IC was visually inspected to identify ICs that were reflective of eye movement artifact [14]; Third, the remaining ICs were classified as electrocortical sources or muscle sources based on inspection of their power spectra and the locations of their equivalent current dipoles.
2.3. Assessing Changes in IC Scalp Projections
To assess changes in the scalp topography of the ICs, as a function of the number of EEG channels used, the scalp topographies of ICs from the reduced channel datasets were interpolated at each EEG channel location in the 125-channel electrode montage. Next, for each subject, pairwise correlations were computed between IC scalp topographies for the 125-channel ICA decomposition and each of the reduced-channel ICA decompositions, using the Hungarian method. Only ICs representing electrocortical activity from the 125-channel dataset were considered. ICs were paired based on the maximum absolute IC scalp topography correlation. In other words, ICs from the reduced-channel datasets were paired with ICs from the 125-channel dataset that had similar scalp topography, irrespective of polarity. Finally, IC pairs were sorted by absolute IC scalp topography correlation and averaged across subjects. We also computed the percentage of electrocortical and electromyographic sources that were retained for each reduced-channel dataset. The percentage of electrocortical sources retained was defined as the number of electrocortical sources in the 125-channel dataset that were correlated with a source in the reduced-channel dataset (R > 0.85); the percentage of electromyographic sources retained was similarly defined.
2.4. Assessing Changes in IC Activations
To assess changes in IC activation (i.e., timeseries) as a function of the number of channels used, pairwise correlations (for each subject) were computed between 125- channel IC activations and reduced-channel IC activations, using the Hungarian method. Only ICs representing electrocortical activity from the 125-channel dataset were considered. ICs were paired based on the maximum correlation. In other words, ICs from the reduced-channel datasets were paired with ICs from the 125-channel dataset that had similar activations. Finally, IC pairs were sorted by IC activation correlation and averaged across subjects.
2.5. Assessing Changes in Visual Target Discrimination Electrocortical Dynamics
Previous analysis of a similar visual target discrimination task for seated subjects showed that brain processes projecting maximally to the frontal midline would contribute substantially to the event related potential (ERP), particularly to the post-motor positivity [25]. Prior visualizations of grand average IC-based ERPs from our dataset confirmed that mediofrontal ICs (projecting maximally to the frontal midline) had a clear and substantial stimulus-locked ERP [16].
In this study, the IC that projected most strongly to the frontal midline for each subject was identified from the 125-channel IC decomposition by inspecting the scalp topographies. Next, the corresponding paired ICs from the reduced-channel datasets were identified. For each IC, signal epochs were extracted, time-locked from –200 to 800 ms relative to visual stimulus onsets, using data from only the active walking conditions (i.e., the conditions in which subjects were walking and actively responding to the oddball stimuli by pressing a handheld trigger). A signal-to-noise ratio was computed for each trial as the peak magnitude in the range of 300 to 600 ms after the stimulus divided by the pre-stimulus standard deviation [26]. For each subject and each dataset (i.e., the 125- channel dataset and the reduced-channel datasets) the mean signal-to-noise was computed. Analysis of variance was used to compare the grand mean signal-to-noise ratio across datasets.
3. Results
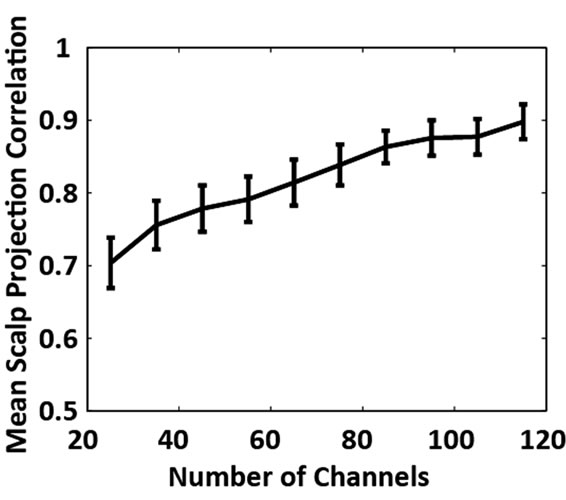
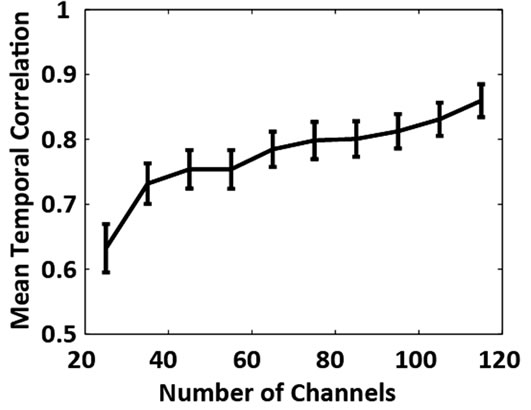
Of the 12 subjects who participated in this study, 7 had 125 or more EEG channels after rejection of noisy channels. For these subjects, 9.0 ± 1.3 electrocortical sources, 10.9 ± 2.3 electromyographic sources, and 2.4 ± 1.6 electroocular sources, were identified for the 125-channel datasets (mean ± std. dev.). In general, the scalp topographies for electrocortical sources were more distorted by reducing the number of EEG channels than the scalp topographies for electromyographic sources (Figure 1). The average correlation between electrocortical source scalp topographies for the reduced channel datasets (115, 100, ···, 25 channels) and the 125-channel dataset decreased from 0.90 ± 0.09 for the 115-channel dataset to 0.70 ± 0.14 for the 25-channel dataset (mean ± std. dev.) (Figure 2). Scalp topographies of four electrocortical sources, from an example subject, are shown for the 125- channel, 105-channel, ···, 25-channel datasets (Figure 3). The average correlation between electrocortical source activation for the reduced-channel datasets and the 125-channel dataset decreased from 0.86 ± 0.03 for the 115-channel dataset to 0.63 ± 0.04 for the 25-channel dataset (Figure 4). The visual target discrimination ERP
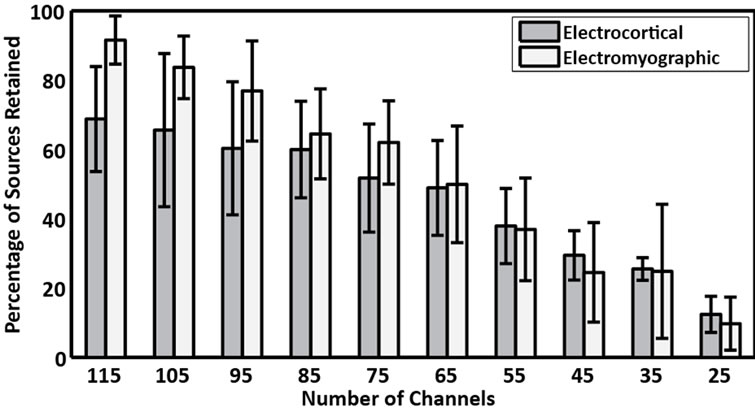
Figure 1. The percentage of (gray bars) electrocortical and (white bars) electromyographic sources retained for the reduced-channel datasets containing 115, 105, ···, 25 EEG channels. The percentage of electrocortical sources retained was defined as the number of electrocortical sources in the 125-channel dataset that were correlated with a source in the reduced-channel dataset (R > 0.85); the percentage of electromyographic sources retained was similarly defined.
 (a)
(a)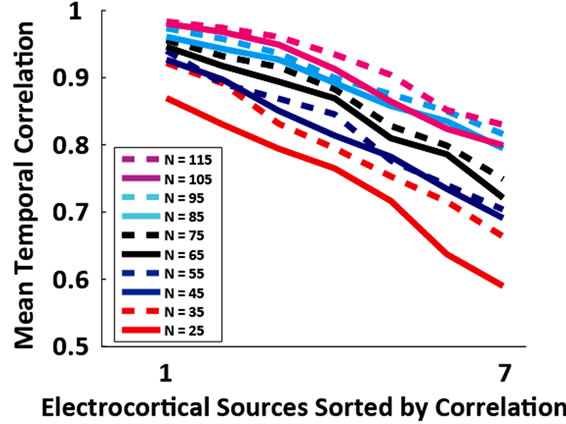 (b)
(b)
Figure 2. (a) Grand average absolute correlation between electrocortical sources scalp projections for the reduced channel datasets (115, 105, ···, 25 channels) and the 125- channel dataset (error-bars, 2 S.E.) and (b) Average absolute correlation between electrocortical source scalp projections for the reduced-channel datasets and the 125- channel dataset ordered by the magnitude of correlation; traces are color coded by the number of channels in the reduced-channel dataset. Data for the 10 best correlated sources are shown.
 (a)
(a)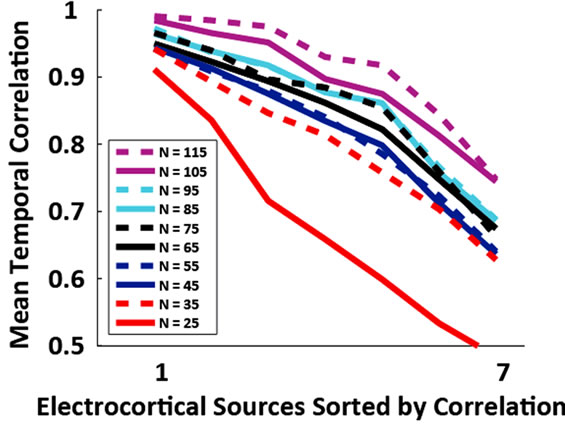 (b)
(b)
Figure 3. (a) Grand average absolute correlation between electrocortical sources temporal signals for the reduced channel datasets (115, 105, ···, 25 channels) and the 125- channel dataset (error-bars, 2 S.E.) and (b) Average absolute correlation between electrocortical source temporal signals for the reduced-channel datasets and the 125-channel dataset ordered by the magnitude of correlation; traces are color coded by the number of channels in the reducedchannel dataset. Data for the 10 best correlated sources are shown.
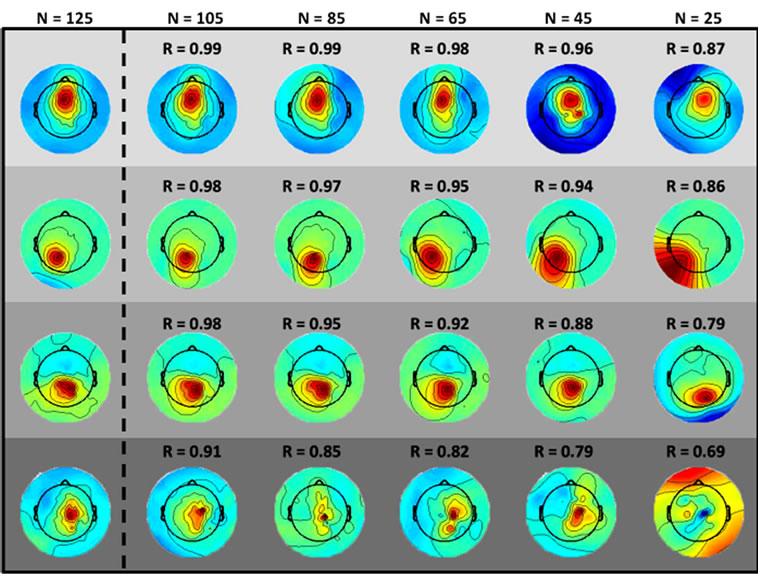
Figure 4. Electrocortical scalp projections for an example subject from the (columns, left to right) 125-channel, 105- channel, ···, 25-channel datasets, (rows) four electrocortical sources are shown for each dataset. Correlation values between the reduced-channel scalp projections and the 125- channel scalp projection are shown.
signal-to-noise ratio did not change significantly (P = 0.65) as a function of the number of channels removed. The mean (std. dev.) signal-to-noise ratio across all subjects and all datasets was 3.08 (0.09).
4. Discussion
Our results demonstrated a distinct relationship between the number of EEG electrodes used and the quality of electrocortical source signals that can be parsed from scalp EEG recorded during standing and walking using ICA. By systematically reducing the number of channels used, we implemented a straightforward paradigm to assess how reducing the number of EEG channels affected the electrocortical source signal estimates derived from ICA. We evaluated the scalp topography (i.e., the electrode coefficients mapped to the scalp), the timeseries activation of the electrocortical signals, and the signal-to-noise ratio of an IC-based visual target discrimination ERP.
Correlations between scalp topographies from the benchmark (125-channel) dataset and the reduced-channel datasets fell off linearly with the number of channels used. The correlation between the electrocortical source activations also weakened as the number of channels used was reduced. Figure 4 demonstrates that small reductions in scalp topography correlation can lead to qualitatively different topographies.
It is important not to over-interpret the spatial or the temporal performance results. These measures must be considered collectively. Topographical comparisons do not reflect the absolute contributions to the IC from each channel. For example, if a patch of EEG channels remained relatively silent (or absolutely zero) than any combination of weights for those electrodes would return (nearly) the same IC activation. In addition, temporal correlations, measured over the entire experimental timecourse, may not reflect the true accuracy of the electrocortical source signal because events time-locked to cortical processes may be better reconstructed than the entire activation time series. Furthermore, the correlations evaluated here do not indicate whether causal relationships between various electrocortical sources are maintained as channels are reduced.
Our results suggest that, for the concurrent locomotor and cognitive tasks study here, the two most robust electrocortical sources can be well captured (temporal and spatial R2 > 0.9) using an electrode montage with as few as 35 channels. The anterior cingulate cortex source, which contributes strongly to the visual target discrimination ERP, was a robust component that was well captured by the reduced-channel IC decompositions. Therefore, it is not surprising that the signal-to-noise ratio of the IC-based ERP did not change significantly as the number of channels was reduced. This is an encouraging result for those studying ERPs during mobile activities for BMI applications or for research purposes.
Another consideration is that despite the use of a 256- channel EEG system on average only 125 channels were usable. Poor recordings in the other channels were due to large movement artifacts and/or degrading electrodescalp connections, which likely resulted from forces on the electrode head cap from moving electrode wires. As sensor technologies improve (i.e., dry electrode sensors and wireless transmission) a higher percentage of electrodes will yield clean usable signals.
An emerging field of study in neuroscience approaches the brain as a complex network of dynamic oscillators. ICA has already been utilized to formulate these network nodes for various analyses [27-29]. The number of ICs extracted is of critical importance when studying brain activity with these methods. ICA can decode and anatomically locate sources of EEG activity, therefore, physiologically realistic maps can be generated when the density of anatomical nodes is sufficient. Therefore, while reducing the number of EEG channels may be sufficient for analysis of ERPs during mobile tasks, researchers interested in network analysis will likely want to maximize the number of EEG signals recorded.
Another area in which ICA of EEG has proved useful is seizure detection and localization [30]. Seizures are often marked by large amounts of movement artifact that can pose similar challenges as locomotion to the interpretation of EEG recordings [31]. The use of ICA to remove movement artifact from seizure EEG and to localize the anatomical source of seizure activity can be beneficial to this field. We can only speculate how the results of this study will transfer to seizure analysis. However, during seizure, the seizure-related EEG activity is dominant in the EEG channel signals. Therefore, just as the anterior cingulate source was well captured by the reduced-channel electrode montages in this study, seizure activity may be well captured with a reduced number of EEG sensors. We believe that applying the analysis approach presented in this study to seizure-related EEG would answer this question and, therefore, should be pursued.
The results of this study are important because they provide useful information for researches and developers who are interested in implementing MoBI. While additional EEG electrodes (at least up to 125 channels, as shown here) will improve the ICA decomposition, task specific placement of electrodes may bypass the need for added channels. For example, the cognitive state of a subject can be extracted from a few usable ICs, negating the benefit of additional channels [10,11]. We plan to evaluate the relative effects of strategic placement of EEG electrodes in future work.
5. Acknowledgements
The authors would like to acknowledge Scott Makeig from the Swartz Center for Computation Neuroscience at the University of California, San Diego, for fruitful discussions related to this manuscript. This work was supported in part by the Office of Naval Research (NO. 00140811215), the Army Research Laboratory (W911NF- 09-1-0139 & W911NF-10-2-0022), and an Air Force Office of Scientific Research National Defense Science and Engineering Graduate Fellowship (32 CFR 168a).
REFERENCES
- S. Makeig, K. Gramann, T. P. Jung, T. J. Sejnowski and H. Poizner, “Linking Brain, Mind and Behavior,” International Journal of Psychophysiology, Vol. 73, No. 2, 2009, pp. 95-100. doi:10.1016/j.ijpsycho.2008.11.008
- A. F. Rabbi, K. Ivanca, A. V. Putnam, A. Musa, C. B. Thaden and R. Fazel-Rezai, “Human Performance Evaluation Based on EEG Signal Analysis: A Prospective Review,” Annual International Conference of the IEEE on Engineering in Medicine and Biology Society, EMBC, Minneapolis, 3-6 September 2009, pp. 1879-1882.
- W. Klimesch, “EEG Alpha and Theta Oscillations Reflect Cognitive and Memory Performance: A Review and Analysis,” Brain Research Reviews, Vol. 29, No. 2-3, 1999, pp. 169-195. doi:10.1016/S0165-0173(98)00056-3
- R. D. Buechler, A. J. Rodriguez, B. D. Lahr and E. L. So, “Ictal Scalp EEG Recording during Sleep and Wakefulness: Diagnostic Implications for Seizure Localization and Lateralization,” Epilepsia, Vol. 49, No. 2, 2008, pp. 340-342. doi:10.1111/j.1528-1167.2007.01320.x
- L. A. Rudzinski and K. J. Meador, “Epilepsy,” Neurology, Vol. 76, No. 7, 2011, pp. S20-S25. doi:10.1212/WNL.0b013e31820c3636
- R. De Raedt, E. Franck, K. Fannes and E. Verstraeten, “Is the Relationship between Frontal EEG Alpha Asymmetry and Depression Mediated by Implicit or Explicit SelfEsteem,” Biological Psychology, Vol. 77, No. 1, 2008, pp. 89-92. doi:10.1016/j.biopsycho.2007.06.004
- D. L. Santesso, S. J. Segalowitz, A. R. Ashbaugh, M. M. Antony, R. E. McCabe and L. A. Schmidt, “Frontal EEG Asymmetry and Sensation Seeking in Young Adults,” Biological Psychology, Vol. 78, No. 2, 2008, pp. 164-172. doi:10.1016/j.biopsycho.2008.02.003
- K. Jerbi, J. R. Vidal, J. Mattout, E. Maby, F. Lecaignard, T. Ossandon, C. M. Hamamé, S. S. Dalal, R. Bouet, J. P. Lachaux, et al., “Inferring Hand Movement Kinematics from MEG, EEG and Intracranial EEG: From BrainMachine Interfaces to Motor Rehabilitation,” IRBM, Vol. 32, No. 1, 2011, pp. 8-18. doi:10.1016/j.irbm.2010.12.004
- K.-R. Müller, M. Tangermann, G. Dornhege, M. Krauledat, G. Curio and B. Blankertz, “Machine Learning for Real-Time Single-Trial EEG-Analysis: From Brain-Computer Interfacing to Mental State Monitoring,” Journal of Neuroscience Methods, Vol. 167, No. 1, 2008, pp. 82-90. doi:10.1016/j.jneumeth.2007.09.022
- P. G. Patil and D. A. Turner, “The Development of BrainMachine Interface Neuroprosthetic Devices,” Neurotherapeutics, Vol. 5, No. 1, 2008, pp. 137-146. doi:10.1016/j.nurt.2007.11.002
- T. J. Sullivan, S. R. Deiss, J. Tzyy-Ping and G. Cauwenberghs, “A Brain-Machine Interface Using Dry-Contact, Low-Noise EEG Sensors,” IEEE International Symposium on Circuits and Systems, Seattle, 18-21 May 2008, pp. 1986-1989.
- D. C. Godlove, “Eye Movement Artifact May Account for Putative Frontal Feedback-Related Potentials in NonHuman Primates,” The Journal of Neuroscience, Vol. 30, No. 12, 2010, pp. 4187-4189. doi:10.1523/JNEUROSCI.0449-10.2010
- T. P. Jung, S. Makeig, C. Humphries, T. W. Lee, M. J. McKeown, V. Iragui and T. J. Sejnowski, “Removing Electroencephalographic Artifacts by Blind Source Separation,” Psychophysiology, Vol. 37, No. 2, 2000, pp. 163- 178. doi:10.1111/1469-8986.3720163
- T. P. Jung, S. Makeig, M. Westerfield, J. Townsend, E. Courchesne and T. J. Sejnowski, “Removal of Eye Activity Artifacts from Visual Event-Related Potentials in Normal and Clinical Subjects,” Clinical Neurophysiology, Vol. 111, No. 10, 2000, pp. 1745-1758. doi:10.1016/S1388-2457(00)00386-2
- J. T. Gwin, K. Gramann, S. Makeig and D. P. Ferris, “Electrocortical Activity Is Coupled to Gait Cycle Phase during Treadmill Walking,” Neuroimage, Vol. 54, No. 2, 2010, pp. 1289-1296.
- J. T. Gwin, K. Gramann, S. Makeig and D. P. Ferris, “Removal of Movement Artifact from High-Density EEG Recorded during Walking and Running,” Journal of Neurophysiology, Vol. 103, No. 6, 2010, pp. 3526-3534.
- K. Gramann, J. T. Gwin, N. Bigdely-Shamlo, D. P. Ferris and S. Makeig, “Visual Evoked Responses during Standing and Walking,” Frontiers in Human Neuroscience, Vol. 4, 2011, p. 202. doi:10.3389/fnhum.2010.00202
- A. Delorme and S. Makeig, “EEGLAB: An Open Source Toolbox for Analysis of Single-Trial EEG Dynamics Including Independent Component Analysis,” Journal of Neuroscience Methods, Vol. 134, No. 1, 2004, pp. 9-21. doi:10.1016/j.jneumeth.2003.10.0099
- A. Delorme, T. Sejnowski and S. Makeig, “Enhanced Detection of Artifacts in EEG Data Using Higher-Order Statistics and Independent Component Analysis,” NeuroImage, Vol. 34, No. 4, 2007, pp. 1443-1449. doi:10.1016/j.neuroimage.2006.11.004
- J. A. Palmer, K. Kreutz-Delgado and S. Makeig, “Super-Gaussian Mixture Source Model for ICA,” In: J. Rosca, D. Erdogmus, J. C. Principe and S. Haykin, Eds., Lecture Notes in Computer Science, Springer, Berlin, 2006, pp. 854-861.
- J. A. Palmer, S. Makeig, K. Kreutz-Delgado and B. D. Rao, “Newton Method for the ICA Mixture Model,” 33rd IEEE International Conferance on Acoustics and Signal Processing, Las Vegas, 3 March-4 April 2008, pp. 1805- 1808.
- S. Makeig, A. J. Bell, T. P. Jung and T. J. Sejnowski, “Independent Component Analysis of Electroencephalographic Data,” Advances in Neural Information Processing Systems, Vol. 8, 1996, pp. 145-151.
- S. H. Collins, P. G. Adamczyk, D. P. Ferris and A. D. Kuo, “A Simple Method for Calibrating Force Plates and Force Treadmills Using an Instrumented Pole,” Gait Posture, Vol. 29, No. 1, 2009, pp. 59-64. doi:10.1016/j.gaitpost.2008.06.010
- R. Oostenveld and T. F. Oostendorp, “Validating the Boundary Element Method for Forward and Inverse EEG Computations in the Presence of a Hole in the Skull,” Human Brain Mapping, Vol. 17, 2002, pp. 179-192. doi:10.1002/hbm.10061
- S. Makeig, A. Delorme, M. Westerfield, T.-P. Jung, J. Townsend, E. Courchesne and T. J. Sejnowski, “Electroencephalographic Brain Dynamics Following Manually Responded Visual Targets,” PLOS Biology, Vol. 2, No. 6, 2004, p. 747. doi:10.1371/journal.pbio.0020176
- S. Debener, A. Strobel, B. Sorger, J. Peters, C. Kranczioch, A. K. Engel and R. Goebel, “Improved Quality of Auditory Event-Related Potentials Recorded Simultaneously with 3-T fMRI: Removal of the Ballistocardiogram Artefact,” NeuroImage, Vol. 34, No. 2, 2007, pp. 587-597. doi:10.1016/j.neuroimage.2006.09.031
- A. Londei, A. D’Ausilio, D. Basso, C. Sestieri, C. Del Gratta, G. L. Romani and M. O. Belardinelli, “Brain Network for Passive Word Listening as Evaluated with ICA and Granger Causality,” Brain Research Bulletin, Vol. 72, No. 4-6, 2007, pp. 284-292. doi:10.1016/j.brainresbull.2007.01.008
- J. S. Damoiseaux, C. F. Beckmann, E. J. S. Arigita, F. Barkhof, P. Scheltens, C. J. Stam, S. M. Smith and S. A. R. B. Rombouts, “Reduced Resting-State Brain Activity in the ‘Default Network’ in Normal Aging,” Cerebral Cortex, Vol. 18, No. 8, 2008, pp. 1856-1864. doi:10.1093/cercor/bhm207
- V. D. Calhoun, K. A. Kiehl and G. D. Pearlson, “Modulation of Temporally Coherent Brain Networks Estimated Using ICA at Rest and during Cognitive Tasks,” Human Brain Mapping, Vol. 29, No. 7, 2008, pp. 828-838. doi:10.1002/hbm.20581
- H. Nam, T.-G. Yim, S. K. Han, J.-B. Oh and S. K. Lee, “Independent Component Analysis of Ictal EEG in Medial Temporal Lobe Epilepsy,” Epilepsia, Vol. 43, No. 2, 2002, pp. 160-164. doi:10.1046/j.1528-1157.2002.23501.x
- E. Urrestarazu, J. Iriarte, M. Alegre, M. Valencia, C. Viteri and J. Artieda, “Independent Component Analysis Removing Artifacts in Ictal Recordings,” Epilepsia, Vol. 45, No. 9, 2004, pp. 1071-1078. doi:10.1111/j.0013-9580.2004.12104.x
NOTES
*Corresponding author.