International Journal of Geosciences
Vol. 4 No. 1 (2013) , Article ID: 27146 , 17 pages DOI:10.4236/ijg.2013.41013
Accumulation of Gel Particles in the Sea-Surface Microlayer during an Experimental Study with the Diatom Thalassiosira weissflogii
1Alfred Wegener Institute for Polar and Marine Research, Bremerhaven, Germany
2Helmholtz Centre for Ocean Research Kiel (GEOMAR), Kiel, Germany
Email: lgalgani@geomar.de
Received October 31, 2012; revised November 29, 2012; accepted December 27, 2012
Keywords: Sea Surface Microlayer; Extracellular Polymeric Substances; Organic Matter; Bacterial Abundance; Polysaccharides; TEP; CSP
ABSTRACT
Since the early 80’s, the sea-surface microlayer (SML) has been hypothesized as being a gelatinous film. Recent studies have confirmed this characteristic, which confers properties that mediate mass and energy fluxes between ocean and atmosphere, including the emission of primary organic aerosols from marine systems. We investigated SML thickness and composition in five replicate indoor experiments between September and December 2010. During each experiment, the SML and underlying seawater were sampled from four seawater tanks: one served as control, and three were inoculated with Thalassiosira weissflogii grown in chemostats at 180, 380 and 780 ppm pCO2. We examined organic material enrichment factors in each tank, paying particular attention to gel particles accumulation such as polysaccharidic Transparent Exopolymer Particles (TEP) and the proteinaceous Coomassie Stainable Particles (CSP). While previous studies have observed carbohydrates and TEP enrichment in the microlayer, little is yet known about proteinaceous gel particles in the SML. Our experiments show that CSP dominate the gelatinous composition of the SML. We believe that the enrichment in CSP points to the importance of bacterial activity in the microlayer. Bacteria may play a pivotal role in mediating processes at the air-sea interface thanks to their exudates and protein content that can be released through cell disruption.
1. Introduction
The sea-surface microlayer (SML) is a specific and dynamic ecosystem at the water-air interface. The SML is susceptible to modification by photochemical reactions, wind-driven atmospheric deposition, water circulation and biological activity: it can be a simultaneous sink and source of natural and anthropogenic compounds [1]. It includes a complex matrix of organic material and microorganisms that at times may form slicks, thus lowering seawater surface tension and influencing air-sea gas and energy exchange [2-4].
It has been widely recognized that physical, chemical and biological processes are very different in the SML compared to the underlying water. However, the determination of its thickness raises some controversy: Zhang [5-7] earlier defined the SML as the uppermost 50 ± 10 µm in situ and in laboratory experiments, while current estimates strongly depend on sampling techniques [8,9]. Based on scientific literature, the SML can be operationally defined as a several-layer structured microhabitat between 1 and 1000 µm thick: it has been proposed to study physicochemical characteristics in the upper 60 µm, and species dependent biological and ecological features over the upper 1000 µm [1].
Gel particles are three-dimensional networks of polymers penetrated by seawater that can range from 1 nm to several millimeters [10-12] and contribute to the microlayer structure. Transparent exopolymer particles (TEP) are a special group of gel particles composed of polysaccharides that contain acidic sugars [11,13]. Their sticky properties facilitate aggregate formation and colonization by bacteria [14,15]. A gelatinous-type composition of the surface film, i.e. a structured hydrated layer of carbohydrates, proteins and lipids was hypothesized early by Sieburth [16] and highlighted in more recent studies focused on polysaccharidic microgels [10,12,17].
According to past studies, gel particles can form spontaneously from free polymeric dissolved organic matter (DOM) [18-20] and the growth of these polymers might be enhanced in the SML because of its enrichment in surface-active polysaccharides [10]. Polysaccharides arise mostly from phytoplankton exudates and also represent a considerable fraction of high molecular weight (HMW; >1 kDa) DOM in the surface ocean [21]. In the SML, polysaccharides account for about 30% of dissolved organic matter while proteins constitute approximately 16% [16]. Proteins are included in another important class of gel particles known as Coomassie Stainable Particles (CSP) which can be stained using Coomassie Brilliant Blue, a protein-binding dye [11,22]. CSP may serve as substrate for particle-associated microbes because pelagic bacteria use proteins as major source of reactive nitrogen [22]. While the abundance and enrichment of protein-like material in the SML has been pointed out by various studies [2,23-25], to our knowledge the evidence of CSP enrichment has been recorded only once [26], suggesting that TEP and CSP observed might have represented the same particle with a mixed proteinaceous/carbohydrate nature.
Our aim in this study was to obtain a more comprehensive picture of the gelatinous composition of the surface microlayer with respect to its polysaccharidic and proteinaceous components. We chose to explore the dynamics of the microlayer that arise from polymeric components released by phytoand bacterioplankton. For this purpose we used filtered (<0.2 µm) North Sea Water as medium and as control, and a non-axenic strain of the diatom Thalassiosira weissflogii as source of fresh organic matter. T. weissflogii was grown at 180, 380 and 780 ppm pCO2 to further examine if increasing CO2 scenario may impact surface ocean composition in terms of organic matter and SML formation.
2. Methods
2.1. Experimental Set Up
Five replicate indoor experiments were performed from October to December 2010. In each experiment, three polyethylene tanks (61 × 36 × 31 cm, sampling surface of 2196 cm2) were filled with 60 L of North Sea Water (NSW) previously filtered through cellulose acetate cartridges (Sartobran P, 0.2 µm capsule, Sartorius). 10 L of a non-axenic culture of the diatom Thalassiosira weissflogii was then added to each tank. The diatom culture was grown for approximately 30 days in three chemostats at D = 0.3 d−1, at an irradiance of 170 - 180 µmol photons cm−2∙s−1, with a light:dark cycle of 12 h:12 h, and a temperature of 15˚C. The chemostats were aerated with 180, 380 and 780 ppm pCO2, respectively at a gas flow rate of approximately 60 ccm each, similar to the set-up described in Borchard et al. [27]. Cell abundance in the chemostats was on average 17,266 cells∙mL−1 at 180 ppm, 26,503 cells∙mL−1 at 380 ppm and 24,414 cells∙mL−1 at 780 ppm pCO2. One extra tank was filled with 70 L of < 0.2 µm filtered NSW solely and served as a control tank. Before each use, tanks were cleaned with HCl 10% and intensively rinsed with deionized water. The purpose of this setup consisted in getting SML and bulk water samples from simple defined conditions: a reference of “sterile” filtered seawater, and seawater added with phytoplankton culture which had released distinct exudates according to different pCO2 growth exposure.
2.2. Sea-Surface Microlayer Sampling
The glass plate approach was chosen to sample the seasurface microlayer [5,17,28,29]. First introduced by Harvey [30], it is based on the principle that a hydrophilic surface, immersed in the water and withdrawn at a controlled rate can retain a layer of approximately 60 - 100 µm thickness through viscous retention [2]. A glass plate of dimensions 500 × 200 × 4 mm with an effective sampling area of 2000 cm2 (including both sides of the plate), was pushed vertically into the surface and pulled out at about 20 cm∙sec−1: at each dip we were able to collect approximately 5 to 7 mL of sample from the glass plate, and we choose to repeat the procedure three times in order to get the first 100 - 150 µm of the surface. The thickness of the surface film was calculated dividing the volume collected by the area of the tank. The glass plate was wiped through Teflon blades and the sample was collected into sterilized glass bottles according to Stolle et al. [8]. Prior to use, both the glass plate and the Teflon blades were cleaned with ethanol 70% first and thoroughly rinsed with Milli-Q water thereafter. The bulk water was collected at about 20 cm below the surface from an opening in the tank to avoid any introduction of contamination to the tank itself. Results from the SML samples were compared to those of bulk water and expressed as enrichment factors (EF), defined as:
 (1)
(1)
where [x] is the concentration of a given parameter in the SML or in the bulk water (BW) [31].
From the four tanks, samples were taken from SML and from bulk water within one hour from the culture addition (t0), and then after 24 and 48 hours (t24 and t48), mixing the water after each sampling. Five experiments were performed, yielding a total of n = 15 samples for the SML in control and n = 45 samples for treatments.
2.3. Chemical and Biological Parameters
Determined parameters included total nitrogen (TN), total combined carbohydrates with a molecular weight > 1 kDa (TCCHO), bacterial abundance, Transparent Exopolymer Particles (TEP) and Coomassie Stainable Particles (CSP). The experiment was replicated five times. TN and TCCHO were determined for three replicates, CSP for four replicates, TEP and bacterial abundance were determined for five replicates. However, it was not possible to perform the analysis for all the previous mentioned parameters over the total 60 samples collected.
TCCHO and TN samples from the SML and bulk water were diluted with Milli-Q water in a ratio of 1:20 for sample analysis. In the experiments I and II, only SML samples were diluted. Therefore, when calculating enrichment factors of these parameters, data from experiments I and II were excluded. No dilution was necessary for bacterial cell number, TEP and CSP.
For TN, 20 mL were filled into pre-combusted (8 h, 500˚C) glass ampoules, preserved with 80 µL phosphoric acid (H3PO4) 85% and stored at 0˚C until analysis. Analysis was performed in four replicates with a Shimadzu TOC-VCSH analyzer with Total Nitrogen (TNM-1) unit, using potassium nitrate (KNO3) calibration standard over the measurement range 0 - 57 µmol∙N∙L−1, and Deep Sea Water reference from Hansell laboratory, University of Miami, Florida.
For bacterial cell number, 750 µL of sample were fixed with 37.5 µL glutaraldehyde (25%) and stored at −20˚C until enumeration no later than six months from collection. Abundance was determined after staining with SYBR Green in DMSO (2%) and analysis with a Flow Cytometer FACS Calibur 4CA (Becton Dickinson).
Microscopical analysis was applied to TEP and CSP. One mL of sample was filtered through polycarbonate filters (Nuclepore) of 0.4 µm pore size (Whatmann) in two replicates, and immediately stained with Alcian Blue (AB) solution for TEP and with Coomassie Brilliant Blue G (CBBG) for CSP following the method described in Engel (2009), and the CytoClear slide technique [32]. TEP and CSP samples were stored at −20˚C until microscopy. For each sample two filters were stored, and thirty images were taken per filter area at ×200 magnification with a Zeiss microscope. The equivalent spherical diameter (ESD) of individual particles was calculated by measuring its cross-sectional area with an image-analysis software (Image J, US National Institutes of Health), and counts were combined and classified into 66 logarithmic size classes from 1 to 33.5 µm [33,34].
For total combined polysaccharides >1 kDa (TCCHO), 15 mL of sample were filled into combusted glass vials (8 h, 500˚C) using 25 mL disposable syringes. Samples were frozen immediately and kept at −20˚C until analysis. Right before analysis samples were thawed and desalination was performed by membrane dialysis (1 kDa MWCO, Spectra Por) for 5 h at 0˚C. To yield monomeric CHO, acid hydrolysis of desalinated samples was conducted with 0.8 M HCl final concentration for 20 h at 100˚C followed by neutralization through acid evaporation (N2) for 5 h at 50˚C. After neutralization Milli-Q water was added to the dry residue and analysis was conducted by Ion Chromatography in two replicates on a Dionex ICS 3000 system following the protocol by Engel and Händel (2011) [35].
2.4. Data Treatment
Our experiment was intended to address certain aspects of SML composition and dynamics. In particular, we investigated if there is an equal occurrence of components in both SML and bulk water, or if some of these components are enriched in either one or the other compartment. We focused on organic matter like polysaccharidic and proteinaceous gel particles. When referring to polysaccharides, we aimed at understanding whether carbohydrate composition of SML and bulk water is comparable, or if we find selective enrichment of some sugars.
Moreover, changes in SML composition were studied, with respect to the addition of fresh organic material > 0.2 µm derived from a phytoplankton culture, and with respect to organic matter produced at different CO2 concentrations.
Assuming a SML thickness of about 100 µm, it was sufficient to sample three times with the glass plate to completely remove the microlayer of the tanks. i.e., for a sampling surface area of 2196 cm2 and a 100 µm thickness, the volume of the microlayer ideally would be 21.96 mL, approximately the same obtained after three dips of the plate. Therefore it is assumed that for every time point of sampling (t0, t24 and t48), a new microlayer was formed and sampled. Nevertheless, to assess variations among repetitive samplings, concentrations in SML and bulk water for each parameter have been tested with a one-way Repeated Measure ANOVA on normal distributed data with factor being the time of sampling.
Enrichment factors (EF) were calculated based on observations of both SML and bulk water. The number of observations varies between the different analyses. A complete dataset, like for bacterial abundance and TEP, consists of 15 samples for each CO2 treatment. A dataset for CSP consists in 12 samples for each CO2 treatment, while for TN and TCCHO the dataset comprises nine observations for each CO2 treatment. The Friedman Repeated Measures ANOVA on Ranks test was applied on non-normal distributed data (e.g. EF) to assess significant differences between pCO2 treatments with factor being pCO2. Spearman Rank correlation coefficients were calculated to determine significant correlations between enrichment factors and SML thickness.
Statistical significance was accepted for p < 0.05, and all tests were run with Sigma Plot 12.0 (Systat).
3. Results
3.1. SML Thickness
The SML thickness was calculated as the quotient between the volumes obtained with three dips of the glass plate and the surface area of the tank, as resumed in the equation:
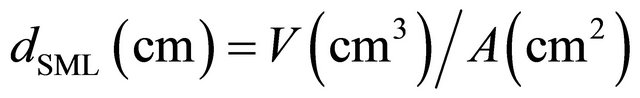 (2)
(2)
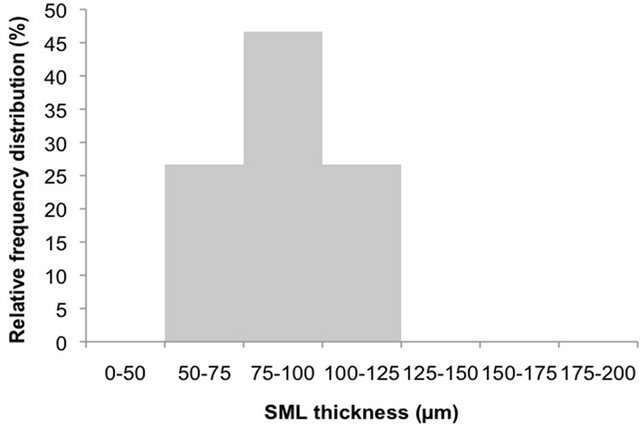
As showed in Figure 1(a), in 47% of the observations SML thickness was comprised between 75 and 100 µm in the control tank. Smaller percentages (27%) relate to thickness of 50 - 75 µm and 100 - 125, being overall in the range between 50 and 125 µm (43%). Most of the observations for treatments (Figure 1(b), 82%) were comprised between 75 and 150 µm, with 38% in the range 100 - 125 µm, 24% between 75 and 100 µm and 20% between 125 and 150 µm. Smaller percentages were also recorded, below 75 µm (4%) and above 150 µm (13%). Thus, our reference microlayer for this study was represented by the upper 150 µm of the surface.
3.2. Gel Particles: TEP and CSP
TEP data proceed from all five experiments, while CSP data were collected in experiments II, III, IV and V.
TEP were enriched in the SML in the control tank as 50% of observations yielded EF values between 0 and 4, with a median value of 0.817 (Figure 2). In treatments instead, the highest EF was found at 180 ppm with median value of 0.913, compared to 380 ppm and 780 ppm with median values of 0.480 and 0.503 respectively. However, due to a large variability within each treatment, a statistically significant effect of CO2 on TEP enrichment in the SML was not confirmed (Friedman ANOVA test, p = 0.158, n = 15).
Compared to TEP, the proteinaceous CSP showed a different partitioning between SML and bulk water (Figure 3). The control was characterized by the lowest EF with 50% of the observations below 1. Treatments instead showed increasing median EF with increasing pCO2: at 180 ppm, we found a median value of 1.15, at 380 ppm of 1.44, at 780 ppm of 1.34. Although Friedman ANOVA test on CO2 effect did not indicate a significant trend (p = 0.126), it is interesting to notice how the vari-
 (a)
(a)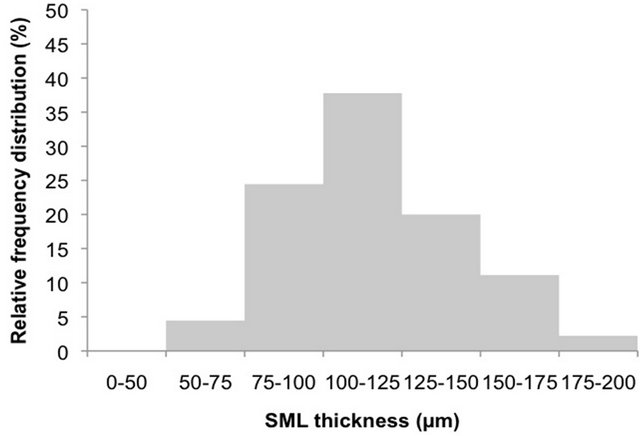 (b)
(b)
Figure 1. Relative frequency distributions of SML thickness in the five experiments in control ((a) n = 15) and in treatments ((b) n = 45).
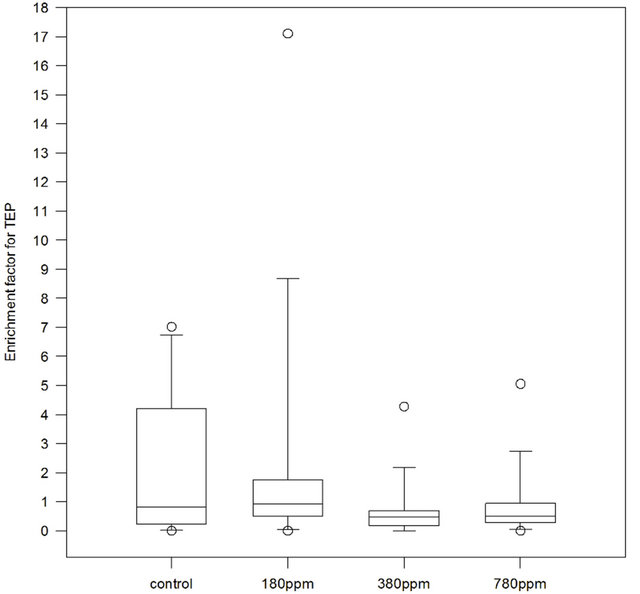
Figure 2. Enrichment factors (EF) for Transparent Exopolymer Particles (TEP) in control, 180 ppm pCO2, 380 ppm pCO2 and 780 ppm pCO2 treatments. Samples number n = 15 for control and each treatment.
ability of the values seemed to be distributed over a narrower range with increasing pCO2. 50% of EF ranged from below 1 to ~2.7 at 180 ppm, from 1 to 2.5 at 380 ppm, and from 1 to ~1.9 at 780 ppm.
CSP dominated gel particles abundance (Figure 4), particularly in the SML. Here median TEP area was 0.2 × 106 µm2∙mL−1 while median CSP area was 1 × 106 µm2∙mL−1, five times higher. In the bulk water median TEP area was 0.4 × 106 µm2∙mL−1, double than in SML; median CSP area was the same as in the SML but in the latter higher abundances were also observed. As well shown in the box plot, TEP abundances in the bulk water were higher than in the SML, while CSP abundances in the bulk water on the contrary were lower than in the SML. The equivalent spherical diameter (ESD) is a proxy for particles size. For TEP in the control, the median ESD in the SML was 14.08 µm and larger than in bulk water with 8.42 µm. Similar observations were made for the 780 ppm pCO2 treatment, yielding 18.97 and 16.31 µm ESD in SML and bulk water, respectively. At low and medium pCO2 conditions instead, average TEP size in SML was smaller with 16.60 µm ESD (180 ppm pCO2) and 16.80 µm ESD 380 ppm pCO2 compared to 17.18 µm ESD (180 ppm CO2) and 18.39 µm ESD (380 ppm pCO2) in the bulk water.
CSP generally included bigger particles than TEP, with values being higher in the SML than in the bulk water. The largest difference was observed at 380 ppm pCO2 with a median size of 32.06 µm ESD in SML compared to 21.31 µm ESD in the bulk water. In the control, CSP median size was 25.31 µm ESD in SML and 25.92 µm ESD in bulk water; at 180 ppm pCO2 median SML CSP size was 25.45 µm ESD compared to 23.37 µm ESD in bulk water, while in the highest pCO2 scenario, 780 ppm, CSP median size in SML was 29.13 µm ESD against 23.45 µm ESD in bulk water.
3.3. Total Combined Carbohydrates (TCCHO)
Total combined carbohydrates (>1 kDa; TCCHO) varied between 0.2 and 5.1 µM∙L−1 in SML and between 0.7 and 4.2 µM∙L−1 for bulk water (data not shown). Highest enrichment of TCCHO was observed in the control (median EF = 1.22) (Figure 5). Median EF in treatments were 0.87, 0.87 and 1.09 for 180 ppm, 380 ppm and 780 ppm pCO2 respectively. Friedman ANOVA test on EF did not result to discern significant differences with
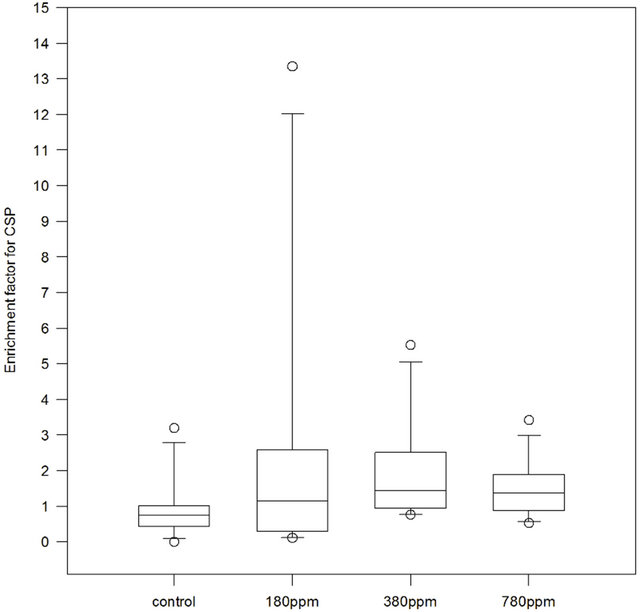
Figure 3. Enrichment Factors (EF) for Coomassie Stainable Particles (CSP) in control, 180 ppm pCO2, 380 ppm pCO2 and 780 ppm pCO2 treatments. Samples number n = 12 for control and each treatment.

Figure 4. Distribution of TEP and CSP in the SML and in bulk water for experiment II, III, IV and V.
pCO2 gradient (p = 0.435, n = 9).
Neutral sugars were the most abundant fraction of TCCHO, and yielded similar percentages in SML and bulk water for both, control (86.9 mol% for SML and 87.3 mol% for bulk water) and treatment samples (82.9 mol% for SML and 83.3 mol% for bulk water) (Tables 1 and 2). Among neutral sugars, fucose, galactose, glucose were close to equal distribution between SML and bulk water or slightly depleted in the SML (Table 1). Rhamnose and arabinose were enriched in the SML of control seawater (median EF = 4.5 and 1.5 respectively). Rhamnose was slightly depleted in the SML of treatments (median EF = 0.9) while arabinose was enriched (median EF = 1.5). Mannose/xylose was more abundant in both, SML in control and treatments (median EF = 1.2 in control and median EF = 1.4 in treatments).
Glucose dominated the composition of polysaccharides in all experiments, with values up to 85 mol% in control and 80 mol% in treatments (Figure 6). Mannose/Xylosewere the second most abundant sugars with percentages of up to 40 mol% in both control and treatments. Fucose represented up to approximately 20 mol% of TCCHO in both control and treatments (Figure 6). Amino sugars were observed in relatively high percentages, especially
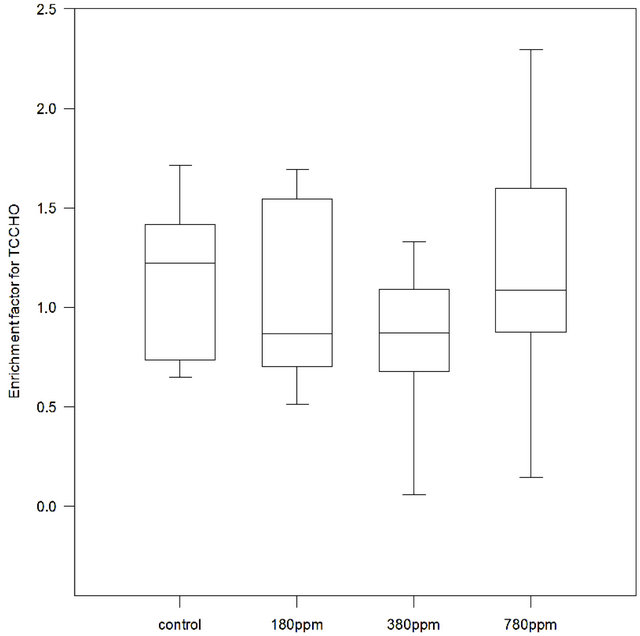
Figure 5. Enrichment Factors (EF) for Total Combined Carbohydrates (TCCHO) determined in control, 180 ppm pCO2, 380 ppm pCO2 and 780 ppm pCO2 treatments. For control and each treatment n = 9 samples.
Table 1. Average molar percentages (mol%) of carbohydrates in TCCHO > 1 kDa of microlayer (SML) and bulk water (BW) from control and treatments samples. In order of listing: fucose (Fuc), rhamnose (Rha), galactosamine (GalN), arabinose (Ara), glucosamine (GlcN), galactose (Gal), glucose (Glc), mannose/xylose (Man/Xyl), gluconic acid (GlucAc), muramic acid (MurAc), galacturonic acid (GalURA) and glucuronic acid (GlcURA).
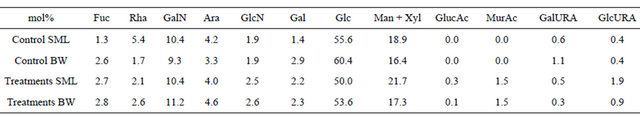
Table 2. Average molar percentages (mol%) and standard deviations of carbohydrates in TCCHO > 1 kDa in control and treatments, for microlayer (SML) and bulk water (BW), merged into three main classes: neutral sugars (Fuc, Rha, Ara, Gal, Glc, Man/Xyl), amino sugars (GalN, GlcN and MurAc) and acidic sugars (GlucAc, GalURAand GlcURA).
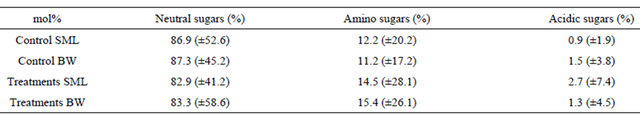
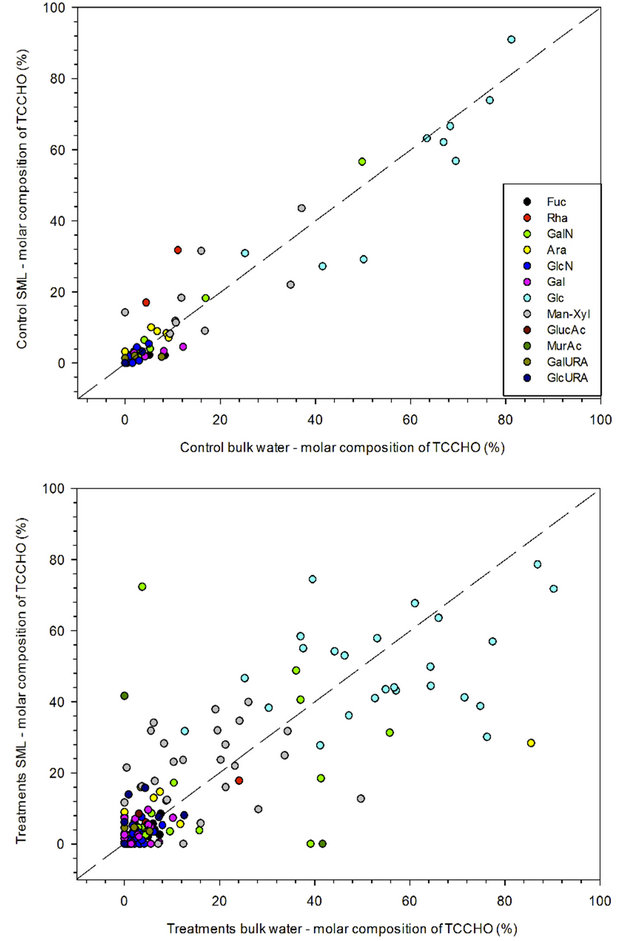
Figure 6. Molar fractions (mol%) of neutral sugars (Fuc, Rha, Ara, Gal, Glc, Man/Xyl), amino sugars (GalN, GlcN and MurAc) and acidic sugars (GlucAc, GalURAand GlcURA).
in treatment samples (Table 2). With a range of 9 - 11 mol%, Galactosamine was the most abundant of amino sugars in control as well as treatment samples (Table 1). Contribution of uronic acids, including galacturonic acid and glucuronic acid, to TCCHO > 1 kDa was low in general, yielding 0.9 ± 1.9 mol% for SML and 1.5 ± 3.8 mol% for bulk water in control (Table 2). Gluconic acid was detected in low percentages in treatments, where acidic sugars represented 2.7 ± 7.4 mol% of total polysaccharides in SML and 1.3 ± 4.5 mol% in bulk water (Tables 1 and 2).
3.4. Total Nitrogen (TN)
Total nitrogen was determined in the experiments III, IV and V. In general, enrichment factors for TN were highly variable (Figure 7), and did not significantly depend on pCO2 (Friedman ANOVA test on ranks, p = 0.352, n = 9). In the control, median EF was 1.01, while in the treatments it increased from 1.24 at 180 ppm to 1.38 at 780 ppm. At 380 ppm median EF was 0.71.
3.5. Bacterial Cell Number
Bacterial abundance in SML and in bulk water was highly variable in the three samplings, both over time (t0, t24 and t48) as well as for the different experiments. In the control, bacterial abundance for both SML and bulk water was <0.5 × 10⁶ cells∙mL−1 with some enrichment in the SML. Generally higher bacterial abundances were observed in the treatment tanks, ranging from 0.5 × 10⁶ cells∙mL−1 to 3 × 10⁶ cells∙mL−1 and increasing numbers were found after 48 hours of sampling for all CO2 conditions. Differences in abundance between t0, t24 and t48 were statistically significant for all treatments and controls in the five experiments (One Way Repeated Measure ANOVA on normal distributed data, p < 0.01 and n = 20 for SML and p < 0.01, n = 20 for bulk water). In most observations, SML was enriched in bacteria with respect to bulk water. Bacterial EF was calculated for each tank and treatment, and suggested that median EF tended to decrease with pCO2 increase (Figure 8). However, a CO2 effect was not significant (p = 0.93, n = 15, Friedman ANOVA). For 50% of the treatments observations, EF for bacteria ranged between 0.8 and 1.7, with outliers up to 3.
3.6. Enrichment Factors
All EF obtained during the five experiments were included in a meta-analysis (Tables 3 and 4). When we refer to an enriched microlayer (yes) we considered all EF > 1.1, while for a depletion (no) we took into account all EF < 0.9. These reference enrichment factors were chosen within a 10% interval from EF = 1, which we consider as uncertainty range; i.e. equal concentration in SML and bulk water cannot be excluded. Enrichment or depletion based on factors between 0.9 and 1.1 was hence assumed as being not unambiguously determinable (n.d.).
In general, bacterial abundance was most often enriched in the SML, i.e. in 67% of the observations of control and in 51% of treatments samples. An enrichment of TEP in the SML was observed in 40% of the observations of the control samples. On the contrary, in treatment tanks having higher absolute TEP concentration, an enrichment of TEP in SML compared to the bulk water was observed in just 22% of the cases.
CSP differed clearly from TEP with respect to partitioning between SML and bulk water. In the control tank, CSP were mostly depleted in the SML, i.e. only 17% of observations account for enrichment. In contrast, 58% of treatment tanks showed enrichment in the SML. For total combined carbohydrates (TCCHO), most observations from control tank suggested an enriched microlayer (56%). Instead, for treatment samples an equal amount
Table 3. Percentage of samples in the control showing enrichment in SML compared to BW (yes), no enrichment (no) and not determinable (n.d). n = number of experiments considered.
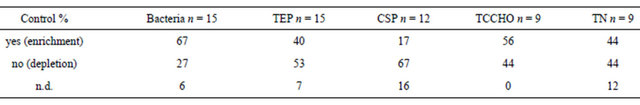
Table 4. Percentage of samples in the treatments showing enrichment in SML compared to BW (yes), no enrichment (no) and not determinable (n.d). n = number of experiments considered.
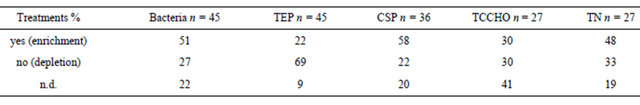
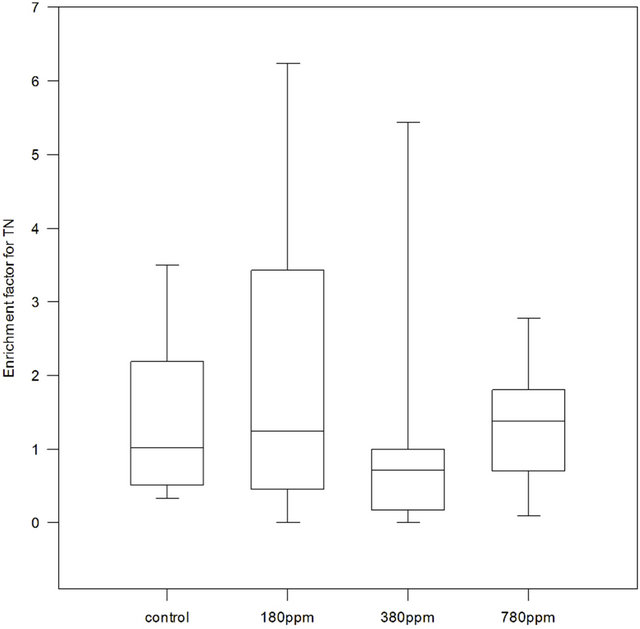
Figure 7. Enrichment Factors (EF) for Total Nitrogen (TN) in control, 180 ppm pCO2, 380 ppm pCO2 and 780 ppm pCO2 treatments. For control and each treatment n = 9 samples.
of observations showed enriched or depleted SML, and in a high percentage of treatment samples enrichment was not clearly determinable (41%). For total nitrogen (TN), no clear pattern of distribution between SML and bulk water was found in control tank, as the same percentages account for enrichment and depletion, and 12% of samples suggested equal distribution. In treatments, TN was enriched in the SML in more experiments (48%), while 33% of the cases manifested depletion. Still, 19% of samples showed similar concentrations in SML and bulk water.
In principle, any component in the SML may become diluted during sampling with the glass plate due to cosampling of bulk water. This would result in larger sampling volume of SML and thus in greater thickness of SML, and consequently in an underestimation of EF. In order to account for potential bias in EF due to the amount of bulk water collected simultaneously, we related all enrichment factors to SML thickness. Spearman Rank correlation coefficients resulted to be not significant (p > 0.05) in any case contemplated in our study, indicating that the sampling volume was not susceptible to interfere with results for EF.
4. Discussion
The aim of this study was to obtain a better understanding of the chemical and biological composition of the SML. Principally we were interested in SML formation as a result of phytoand bacterioplankton exudation. Consequently, we examined if SML composition would change because of increasing pCO2 applied to the phytoplankton culture, source of fresh organic material. The phytoplankton culture was grown at controlled conditions of pCO2 and temperature, and then transferred into tanks where we tested for microlayer formation. Effect of time on accumulation of bacterial cells and gel particles in the SML was investigated sampling the tanks at three different time points. Each pCO2 treatment was tested against a control tank solely containing filtered seawater, and the whole set up of the experiment was replicated five times.
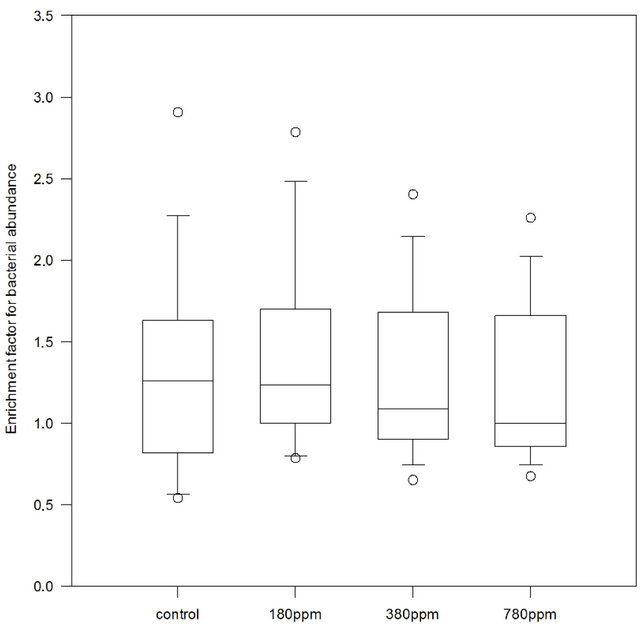
Figure 8. Enrichment factors for bacterial abundance in control, 180 ppm pCO2, 380 ppm pCO2 and 780 ppm pCO2 treatments. For control and each treatment n = 15 samples.
4.1. Thickness of the SML
The majority of measurements yielded a SML thickness between 75 and 150 µm, which was greater than reported elsewhere [5,6,8,29]. Zhang et al. suggested a SML thickness of 50 ± 10 µm, based upon physicochemical measurements [5-7], but it has been proposed that is meaningful to study biological characteristics of the SML in the upper 1000 µm [1]. Our measurements included biologically derived constituents of the SML like gel particles, as well as bacterial cells. Therefore, it is reasonable to think that the thickness we reported agrees with previous observations and studies on SML composition.
4.2. Gel Particles
Gel particles indicate a biogenic gelatinous nature of the surface film [10,26,36], with TEP being the hitherto abundant gels reported in the SML. TEP can facilitate the formation of aggregates in seawater [37] and SML [12]. Our meta-analysis (Tables 3 and 4) suggested that accumulation of TEP and CSP in the SML might be different. While TEP abundance was more pronounced in the SML of control tank compared to the treatment tanks, CSP were mostly enriched in the SML of treatments, but depleted in the control. Examining gel particles distribution in the SML in more detail (Figure 4) showed that CSP were always more abundant than TEP across the five experiments. The presence of TEP > 0.4 µm in the control can be explained by its characteristics to form abiotically from dissolved material smaller than 0.2 µm [18,19,38,39]. On the other hand, TEP have often been observed in diatom aggregates [13,36,50-42]. Attachment to diatom cells and subsequent sinking to the bottom of the tanks are hence potential explanations for reduced TEP presence in the surface microlayer, as reflected by the larger average particle size in bulk water and smaller in the microlayer (Figures 9(a) and (b)). In natural environments, the formation of ocean bubbles scavenges surface-active material from the pelagic water column and transports it to the surface thus contributing to SML enrichment in organic matter. This situation was not considered in our set up, because bubble size and bubbling intensity could hardly be controlled well enough to allow for comparison between pCO2 treaments. However, TEP formation has been shown to be enhanced with bubbling and breaking waves [43] and the lack of con-
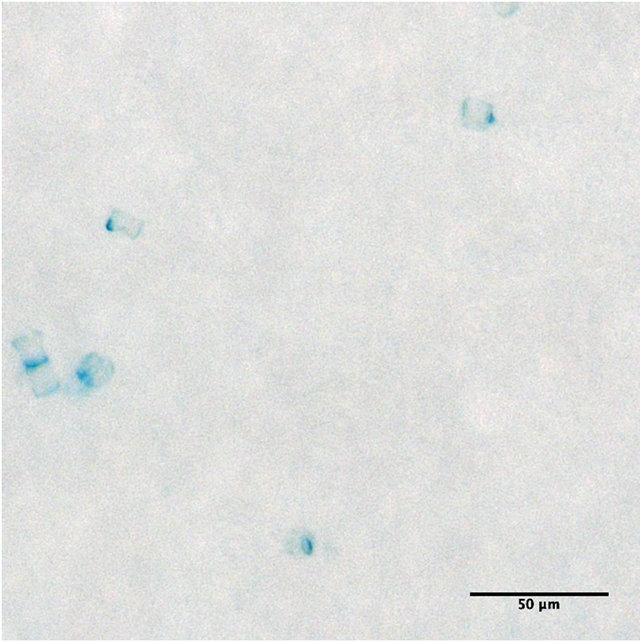 (a)
(a)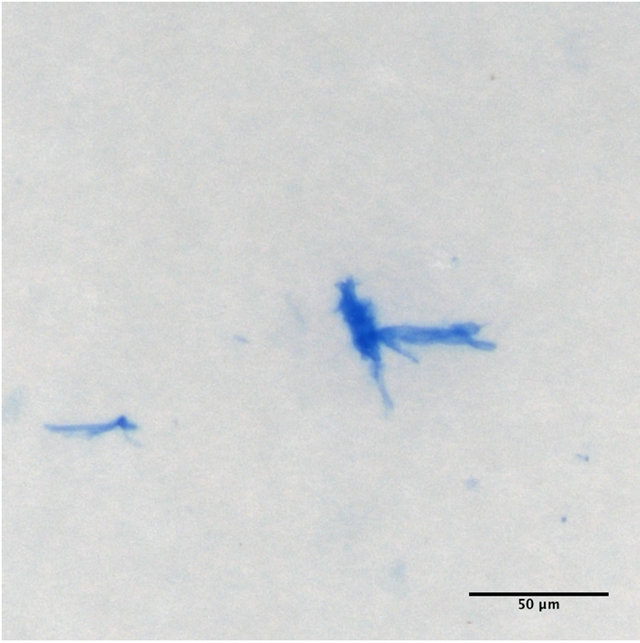 (b)
(b)
Figure 9. Sea-surface microlayer at 380 ppm pCO2. TEP attached to diatom cells (a), and “free” CSP (b).
tinuous bubbling in the incubation tanks might be addressed as another factor limiting TEP production. Wurl et al. (2011) investigated a possible bias in TEP SML accumulation due to adhesion to the glass plate, but found no evidence for this [39].
Thalassiosira weissflogii may release both small [40] and copious amounts [44] of TEP. A more recent study suggested that TEP production in T. weissflogii may be closely related to specific bacteria strains [41]. We did not investigate bacteria community composition during this study, but lack of specific strains may explain low TEP abundance in this experiment. At the same time, the degradation of particulate organic matter (like TEP and CSP) by heterotrophic bacteria might be responsible for low TEP concentration in the SML of our experiments, where bacterial cells accumulated more than in bulk water.
Two aspects need to be considered in the dynamic of organic matter pool. As discussed by Wurl and Holmes [10], TEP can assemble spontaneously within the boundaries of the SML thanks to precursors from bacterial exudates. Additionally, colloidal and particulate organic matter forms in the water column and is vertically transported to the surface where heterotrophic bacteria find an optimal environment [45]. To what extent CSP can form within the SML is still unclear. CSP are protein-containing marine gel particles, but it is uncertain whether or not TEP and CSP represent different chemical subunit of the same gel particle or are separate particles. It has been suggested that CSP are closely associated to TEP [11], even though the strong CSP enrichment of our treatments was not recorded for TEP as well (Figure 4). As extracellular polymeric substances, their abundance, as discussed for TEP, is presumably dependent on the algaebacteria interaction as well as on the changing composition of the bacterial community [46].
The observation of CSP enrichment may be corroborated by earlier reports of enhanced presence of proteins and higher rates of extracellular enzymatic peptide hydrolysis in the SML [23,25]. An enrichment of SML with dissolved amino acids was recently reported for the subtropical Atlantic in a transect from the Mauritanian upwelling area to the oligotrophic gyre and for the western Mediterranean Sea [47]. The amino acid pool might increase in the SML as a consequence of organic matter leaching from bacterial damaged cells because of viruses or other stress factors typical of that environment [2]. Enrichment in the SML has been well documented for dissolved free amino acids (DFAA) and for particulate amino acids [2,48]. Proteinaceous matter is a significant source of organic nitrogen in surface ocean [26] and microbial communities of the SML rapidly metabolize DFAA [49,50]. Total hydrolysable amino acids can be found as dissolved material, colloids or submicron particles [25] that migrate to the surface rather than being produced in situ within the SML [23]. Organisms and particularly bacteria take up free carbohydrates and amino acids for their metabolism, resulting in a loss of dissolved organic matter (DOM). When there is a high production of DOM, for example during phytoplankton blooms, another pathway of converting dissolved into particulate organic carbon (POC) is aggregation into particles, as demonstrated for TEP [19]. We suggest that spontaneous assembly of gel-like particles from DOM may account for CSP also, since CSP were observed in control and treatment tanks as well.
4.3. Total Combined Carbohydrates Analysis
Early studies suggested that total carbohydrates could be less strongly associated with the SML [48]. During this study, little enrichment of TCCHO and TEP in SML was observed (Tables 3 and 4). Our experiments were connoted by the predominance of neutral sugars and in particular by glucose as primary product of photosynthesis. Glucose is possibly the most abundant sugar in seawater as early studies reported [51-55]. Acidic polysaccharides are a characteristic fraction of TEP [13,55-57] and their low abundance in our experiment reflected the lower TEP concentration.
Amino sugars like galactosamine and glucosamine were found in relatively high mol% compared to recent field studies [55,56]. Peptides and amino acids are common algal products but usually represent a small fraction of the total algal extracellular production [58], even if there is also evidence of high abundance and frequency of amino sugars in oceanic samples [59]. Galactosamine, glucosamine and muramic acid contribute to the structure of peptidoglycan, dominant cell wall polymer and therefore are important constituents of marine carbon and nitrogen cycles [60]. Bacterial protein content supports the amino acid pool and may provide precursors for proteinaceous gel particles assemblage, such as observed in the SML of this study.
4.4. Bacterial Abundance
The abundance of bacterial specific organic components and of proteinaceous gel particles together with an enrichment of bacteria in the SML suggest a major role of bacteria in determining the gelatinous character of SML during this study. Bacteria associated to the SML might result from a migration of bacterial cells from the bulk water to the surface, where they benefit from the accumulation of organic and inorganic substrates [8,60]. The observed increase in bacterial numbers in the SML over time, confirms this idea. Recent studies suggested that because of the stressful environment, a specifically adapted SML bacterial community is unlikely [8]. However, a specific bacterioneuston community originating from the underlying waters might concentrate at the surface through upward passive transport [61]. Nevertheless, the observed tendency of bacterial abundance to be higher in the SML, suggests that bacteria not only find in gel particles optimal energy source to be degraded, but they contribute to the continuous gel matrix formation through the release of exudates.
4.5. Implications for Ocean’s Surface Processes in Future Climate Scenarios
One aspect of our study was to investigate CO2 effects on SML dynamics, because increasing pCO2 and decreasing pH may impact biological production of organic matter in marine systems [62] and thus SML formation and composition. Pre-industrial (180 ppm), current (380 ppm) and predicted future ocean pCO2 by the year 2100 (780 ppm) were applied to phytoplankton cultures in this experiment.
A direct relationship between TEP and CO2 uptake has been demonstrated before, pointing to the importance of exopolymers released by phytoplankton as sink for CO2 [63]. In surface waters, coupled acidification and rising sea-surface temperature might enhance this process, thus implying changes in the microbial food web [56] and consequently in the recycling of dissolved organic matter in the ocean. Heterotrophic bacteria are the main consumers of organic carbon in the ocean. Therefore, changes in bacterial activity could highly affect the oceanic carbon budget and the cycling of nutrients, in particular nitrogen, which limits primary productivity in many regions [64]. The enrichment of proteinaceous exudates in the SML found in our study suggests that bacterial activity might crucially affect surface ocean dynamics. The results that have been shown do not ascertain a particular CO2 effect on microlayer gelatinous composition, but because of SML complexity this should be studied in natural environments and is an aspect for future investigations. We expect that an enhanced release of exopolymers by phytoand bacterioplankton due to anthropogenic changes in climate may impact surface ocean processes and among them, air-sea gas fluxes.
5. Conclusion
This study investigated the upper 150 µm of the water column in order to understand the composition of the SML with respect to bulk water as a result of phytoplankton and bacterial activity. Enrichment of the microlayer was found in the particulate organic matter fraction to which bacterial cells and gel particles contribute. This study suggests that the gelatinous nature of the sea-surface microlayer is not solely determined by polysaccharides but also by proteinaceous material, which we found more abundant in the form of CSP. Among gel particles, TEP showed microlayer enrichment related to low bacterial abundance (control tank) confirming TEP formation from abiotic sources, which conversely does not occur for CSP. Therefore we reason that to the protein-like gelatinous matrix, bacteria are a determining factor because of their amino acidic exudates and probably to a greater extent than phytoplankton. In natural systems the mutual association between bacteria and gel particles renders the microlayer a unique environment subject to many processes and inputs from bulk water and from the atmosphere. The surface matrix can be enriched and depleted of its components, and the metabolic activity of the SML community might influence exchange of gases between ocean and atmosphere on a global scale, as pointed out previously [47]. The ocean’s breathable skin therefore should not be intended as a “waste” region that collects all the material scavenged from the bulk water, but as a dynamic and living habitat that continuously changes in an independent way.
6. Acknowledgements
This work was supported bythe BMBF projects SOPRAN and BIOACID, as well as by the Helmholtz Association (HZ-NG-102). We thank Sonja Endres, Nicola Wannicke, Juliane Unger for providing data on Thalassiosira weissflogii culture, as well as Nicole Händel, Jon Roa, Tobias Mattfeldt, Ulrike Eberhardtand Kao-Na Pongsagulfor technical support.
REFERENCES
- O. Wurl and J. P. Obbard, “A Review of Pollutants in the Sea-Surface Microlayer (SML): A Unique Habitat for Marine Organisms,” Marine Pollution Bulletin, Vol. 48, No. 11, 2004, pp. 1016-1030. doi:10.1016/j.marpolbul.2004.03.016
- P. S. Liss and R. A. Duce, “The Sea Surface and Global Change,” Cambridge University Press, Cambridge, 2005.
- E. S. Van Vleet and P. M. Williams, “Sampling Sea Surface Films: A Laboratory Evaluation of Techniques and Collecting Materials,” Limnology and Oceanography, Vol. 25, No. 4, 1980, pp. 764-770. doi:10.4319/lo.1980.25.4.0764
- E. S. Van Vleet and P. M. Williams, “Surface Potential and Film Pressure Measurements in Seawater Systems,” Limnology and Oceanography, Vol. 28, No. 3, 1983, pp. 401-414. doi:10.4319/lo.1983.28.3.0401
- Z. Zhang, “Studies on the Sea Surface Microlayer II. The Layer of Sudden Change of Physical and Chemical Properties,” Journal of Colloid and Interface Science, Vol. 264, No. 1, 2003, pp. 148-159. doi:10.1016/S0021-9797(03)00390-4
- Z. Zhang, C. Liu and L. Liu, “Physicochemical Studies of the Sea-Surface Microlayer,” Frontiers of Chemistry in China, Vol. 1, No. 1, 2006, pp. 1-14. doi:10.1007/s11458-005-0003-8
- Z. Zhang, L. Liu, Z. Wu, J. Li and H. Ding, “Physicochemical Studies of the Sea Surface Microlayer: I. Thickness of the Sea Surface Microlayer and Its Experimental Determination,” Journal of Colloid and Interface Science, Vol. 204, No. 2, 1998, pp. 294-299.
- C. Stolle, K. Nagel, M. Labrenz and K. Jürgens, “Bacterial Activity in the Sea-Surface Microlayer: In Situ Investigations in the Baltic Sea and the Influence of Sampling Devices,” Aquatic Microbial Ecology, Vol. 58, No. 1, 2009, pp. 67-78. doi:10.3354/ame01351
- H. Agogué, E.O. Casamayor, F. Joux, I. Obernosterer, C. Dupuy, F. Lantoine, P. Catala, M. G. Weinbauer, T. Reinthaler, G. J. Herndl and P. Lebaron, “Comparison of Samplers for the Biological Characterization of the Sea Surface Microlayer,” Limnology and Oceanography: Methods, Vol. 2, 2004, pp. 213-225. doi:10.4319/lom.2004.2.213
- O. Wurl and M. Holmes, “The Gelatinous Nature of the Sea-Surface Microlayer,” Marine Chemistry, Vol. 110, No. 1, 2008, pp. 89-97. doi:10.1016/j.marchem.2008.02.009
- A. Engel, “Determination of Marine Gel Particles,” In: Practical Guidelines for the Analysis of Seawater, CRC Press, Boca Raton, 2009. doi:10.1201/9781420073072.ch7
- M. Cunliffe and J. C. Murrell, “The Sea-Surface Microlayer Is a Gelatinous Biofilm,” The ISME Journal, Vol. 3, No. 9, 2009, pp. 1001-1003. doi:10.1038/ismej.2009.69
- A. L. Alldredge, U. Passow and B. E. Logan, “The Abundance and Significance of a Class of Large, Transparent Organic Particles in the Ocean,” Deep Sea Research, Vol. 40, No. 6, 1993, pp. 1131-1140. doi:10.1016/0967-0637(93)90129-Q
- H.-P. Grossart, G. Czub and M. Simon, “Algae-Bacteria Interactions and Their Effects on Aggregation and Organic Matter Flux in the Sea,” Environmental Microbiology, Vol. 8, No. 6, 2006, pp. 1074-1084. doi:10.1111/j.1462-2920.2006.00999.x
- U. Passow, R. F. Shipe, A. Murray, D. K. Pak, M. A. Brzezinski and A. L. Alldredge, “The Origin of Transparent Exopolymer Particles (TEP) and Their Role in the Sedimentation of Particulate Matter,” Continental Shelf Research, Vol. 21, No. 4, 2001, pp. 327-346. doi:10.1016/S0278-4343(00)00101-1
- J. M. Sieburth, “Microbiological and Organic-Chemical Processes in the Surface and Mixed Layers—Air-Sea Exchange of Gases and Particles,” D. Reidel Publishing Company, Boston, 1983.
- O. Wurl, E. Wurl, L. Miller, K. Johnson and S. Vagle, “Formation and Global Distribution of Sea-Surface Microlayers,” Biogeosciences, Vol. 8, No. 1, 2011, pp. 121- 135. doi:10.5194/bg-8-121-2011
- W.-C. Chin, M. V. Orellana and P. Verdugo, “Spontaneous Assembly of Marine Dissolved Organic Matter into Polymer Gels,” Nature, Vol. 391, No. 6667, 1998, pp. 568-572. doi:10.1038/35345
- A. Engel, S. Thoms, U. Riebesell, E. Rochelle-Newall and I. Zondervan, “Polysaccharide Aggregation as a Potential Sink of Marine Dissolved Organic Carbon,” Nature, Vol. 428, No. 6986, 2004, pp. 929-932. doi:10.1038/nature02453
- P. Verdugo, A. L. Alldredge, F. Azam, D. L. Kirchman, U. Passow and P. H. Santschi, “The Oceanic Gel Phase: A Bridge in the DOM-POM Continuum,” Marine Chemistry, Vol. 92, No. 1-4, 2004, pp. 67-85. doi:10.1016/j.marchem.2004.06.017
- R. Benner, “Chemical Composition and Reactivity,” In: D. A. Hansell and D. J. Carlson, Eds., Biogeochemistry of Marine Dissolved Organic Matter, Academic Press, Waltham, 2002, pp. 59-90. doi:10.1016/B978-012323841-2/50005-1
- R. A. Long and F. Azam, “Abundant Protein-Containing Particles in the Sea,” Aquatic Microbial Ecology, Vol. 10, No. 3, 1996, pp. 213-221. doi:10.3354/ame010213
- M. Kuznetsova, C. Lee and J. Aller, “Enrichment of Amino Acids in the Sea Surface Microlayer at Coastal and Open Ocean Sites in the North Atlantic Ocean,” Limnology and Oceanography, Vol. 49, No. 5, 2004, pp. 1605- 1619. doi:10.4319/lo.2004.49.5.1605
- M. Kuznetsova and C. Lee, “Dissolved Free and Combined Amino Acids in Nearshore Seawater, Sea Surface Microlayers and Foams: Influence of Extracellular Hydrolysis,” Aquatic Sciences—Research Across Boundaries, Vol. 64, 2002, pp. 252-268.
- M. Kuznetsova and C. Lee, “Enhanced Extracellular Enzymatic Peptide Hydrolysis in the Sea-Surface Microlayer,” Marine Chemistry, Vol. 73, No. 3-4, 2001, pp. 319-332. doi:10.1016/S0304-4203(00)00116-X
- M. Kuznetsova, C. Lee and J. Aller, “Characterization of the Proteinaceous Matter in Marine Aerosols,” Marine Chemistry, Vol. 96, No. 3-4, 2005, pp. 359-377. doi:10.1016/j.marchem.2005.03.007
- C. Borchard, A. V. Borges, N. Händel and A. Engel, “Biogeochemical Response of Emiliania Huxleyi (PML B92/11) to Elevated CO2 and Temperature under Phosphorous Limitation: A Chemostat Study,” Journal of Experimental Marine Biology and Ecology, Vol. 410, 2011, pp. 61-71. doi:10.1016/j.jembe.2011.10.004
- C. Stolle, K. Nagel, M. Labrenz and K. Jürgens, “Succession of the Sea-Surface Microlayer in the Coastal Baltic Sea under Natural and Experimentally Induced LowWind Conditions,” Biogeosciences, Vol. 7, No. 9, 2010, pp. 2975-2988. doi:10.5194/bg-7-2975-2010
- M. Cunliffe, A. Engel, S. Frka, B. Gašparović, C. Guitart, J. C. Murrell, M. Salter, C. Stolle, R. Upstill-Goddard and O. Wurl, “Sea Surface Microlayers: A Unified Physicochemical and Biological Perspective of the Air-Ocean Interface,” Progress in Oceanography, 2012, in Press.
- G. W. Harvey and L. A. Burzell, “A Simple Microlayer Method for Small Samples,” Limnology and Oceanography, Vol. 11, No. 4, 1972, pp. 608-614. doi:10.4319/lo.1966.11.4.0608
- P. S. Liss and R. A. Duce, “The Sea Surface and Global Change,” Cambridge University Press, Cambridge, 1997. doi:10.1017/CBO9780511525025
- B. E. Logan, H.-P. Grossart and M. Simon, “Direct Observation of Phytoplankton, TEP and Aggregates on Polycarbonate Filters Using Brightfield Microscopy,” Journal of Plankton Research, Vol. 16, No. 12, 1994, pp. 1811- 1815. doi:10.1093/plankt/16.12.1811
- E. J. Rochelle-Newall, X. Mari and O. Pringault, “Sticking Properties of Transparent Exopolymeric Particles (TEP) during Aging and Biodegradation,” Journal of Plankton Research, Vol. 32, No. 10, 2010, pp. 1433-1442. doi:10.1093/plankt/fbq060
- X. Mari and A. Burd, “Seasonal Size Spectra of Transparent Exopolymeric Particles (TEP) in a Coastal Sea and Comparison with Those Predicted Using Coagulation Theory,” Marine Ecology Progress Series, Vol. 163, 1998, pp. 63-76. doi:10.3354/meps163063
- A. Engel and N. Händel, “A Novel Protocol for Determining the Concentration and Composition of Sugars in Particulate and in High Molecular Weight Dissolved Organic Matter (HMW-DOM) in Seawater,” Marine Chemistry, Vol. 127, No. 1-4, 2011, pp. 180-191. doi:10.1016/j.marchem.2011.09.004
- M. Cunliffe, M. Salter, P. J. Mann, A. S. Whiteley, R. C. Upstill-Goddard and J. C. Murrell, “Dissolved Organic Carbon and Bacterial Populations in the Gelatinous Surface Microlayer of a Norwegian Fjord Mesocosm,” FEMS Microbiology Letters, Vol. 299, No. 2, 2009, pp. 248-254. doi:10.1111/j.1574-6968.2009.01751.x
- U. Passow, “Transparent Exopolymer Particles (TEP) in Aquatic Environments,” Progress in Oceanography, Vol. 55, No. 3-4, 2002, pp. 287-333. doi:10.1016/S0079-6611(02)00138-6
- U. Passow, “Formation of Transparent Exopolymer Particles, TEP, from Dissolved Precursor Material,” Marine Ecology Progress Series, Vol. 192, 2000, pp. 1-11. doi:10.3354/meps192001
- O. Wurl, L. Miller and S. Vagle, “Production and Fate of Transparent Exopolymer Particles in the Ocean,” Journal of Geophysical Research, Vol. 116, 2011, Article ID: C00H13. doi:10.1029/2011JC007342
- K. M. Crocker and U. Passow, “Differential Aggregation of Diatoms,” Marine Ecology Progress Series, Vol. 117, 1995, pp. 249-257. doi:10.3354/meps117249
- A. Gardes, M. H. Iversen, H.-P. Grossart, U. Passow and M. S. Ullrich, “Diatom-Associated Bacteria Are Required for Aggregation of Thalassiosira weissflogii,” The ISME Journal, Vol. 5, No. 3, 2011, pp. 436-445.
- U. Passow and A. L. Alldredge, “Aggregation of a Diatom Bloom in a Mesocosm: The Role of Transparent Exopolymer Particles (TEP),” Deep Sea Research Part II: Topical Studies in Oceanography, Vol. 42, No. 1, 1995, pp. 99-109. doi:10.1016/0967-0645(95)00006-C
- J. Zhou, K. Mopper and U. Passow, “The Role of Surface-Active Carbohydrates in the Formation of Transparent Exopolymer Particles by Bubble Adsorption of SeaWater,” Limnology and Oceanography, Vol. 43, No. 8, 1998, pp. 1860-1871.
- U. Passow, “Production of Transparent Exopolymer Particles (TEP) by Phytoand Bacterioplankton,” Marine Ecology Progress Series, Vol. 236, 2002, pp. 1-12. doi:10.3354/meps236001
- I. Obernosterer, P. Catala, T. Reinthaler, G. J. Herndl and P. Lebaron, “Enhanced Heterotrophic Activity in the Surface Microlayer of the Mediterranean Sea,” Aquatic Microbial Ecology, Vol. 39, No. 3, 2005, pp. 293-302. doi:10.3354/ame039293
- H.-P. Grossart, F. Levold, M. Allgaier, M. Simon and T. Brinkhoff, “Marine Diatom Species Harbour Distinct Bacterial Communities,” Environmental Microbiology, Vol. 7, No. 6, 2005, pp. 860-873. doi:10.1111/j.1462-2920.2005.00759.x
- T. Reinthaler, E. Sintes and G. J. Herndl, “Dissolved Organic Matter and Bacterial Production and Respiration in the Sea-Surface Microlayer of the Open Atlantic and the Western Mediterranean Sea,” Limnology and Oceanography, Vol. 53, No. 1, 2008, pp. 122-136. doi:10.4319/lo.2008.53.1.0122
- S. M. Henrichs and P. M. Williams, “Dissolved and Particulate Amino Acids and Carbohydrates in the Sea Surface Microlayer,” Marine Chemistry, Vol. 17, No. 2, 1985, pp. 141-163. doi:10.1016/0304-4203(85)90070-2
- A. F. Carlucci, D. M. Wolgast and D. B. Craven, “Microbial Populations in Surface Films: Amino Acid Dynamics in Nearshore and Offshore Waters off Southern California,” Journal of Geophysical Research, Vol. 97, No. C4, 1992, pp. 5271-5280. doi:10.1029/91JC02614
- A. F. Carlucci, D. B. Craven, K. J. Robertson and P. M. Williams, “Surface-Film Microbial Populations: Diel Amino Acid Metabolism, Carbon Utilization, and Growth Rates,” Marine Biology, Vol. 92, No. 2, 1986, pp. 289- 297. doi:10.1007/BF00392847
- K. Mopper, R. Dawson, G. Liebezeit and V. Ittekkot, “The Monosaccharide Spectra of Natural Waters,” Marine Chemistry, Vol. 10, No. 1, 1980, pp. 55-66. doi:10.1016/0304-4203(80)90058-4
- A. Skoog and R. Benner, “Aldoses in Various Size Fractions of Marine Organic Matter: Implications for Carbon Cycling,” Limnology and Oceanography, Vol. 42, No. 8, 1997, pp. 1803-1813. doi:10.4319/lo.1997.42.8.1803
- K. Mopper, “Sugars and Uronic Acids in Sediment and Water from the Black Sea and North Sea with Emphasis on Analytical Techniques,” Marine Chemistry, Vol. 5, No. 4-6, 1977, pp. 585-603. doi:10.1016/0304-4203(77)90044-5
- S. M. Myklestad, E. Skkanoy and S. Hestmann, “A Sensitive and Rapid Method for Analysis of Dissolved Monoand Polysaccharides in Seawater,” Marine Chemistry, Vol. 56, No. 3-4, 1997, pp. 279-286. doi:10.1016/S0304-4203(96)00074-6
- A. Engel, J. R. M. Harlay, J. Piontek and L. Chou, “Contribution of Combined Carbohydrates to Dissolved and Particulate Organic Carbon after the Spring Bloom in the Northern Bay of Biscay (North-Eastern Atlantic Ocean),” Continental Shelf Research, Vol. 45, 2012, pp. 42-53. doi:10.1016/j.csr.2012.05.016
- A. Engel, N. Händel, J. Wohlers, M. Lunau, H. P. Grossart, U. Sommer and U. Riebesell, “Effects of Sea Surface Warming on the Production and Composition of Dissolved Organic Matter during Phytoplankton Blooms: Results from a Mesocosm Study,” Journal of Plankton Research, Vol. 33, 2010, pp. 357-372. doi:10.1093/plankt/fbq122
- C. Borchard and A. Engel, “Organic Matter Exudation by Emiliania huxleyi under Simulated Future Ocean Conditions,” Biogeosciences, Vol. 9, 2012, pp. 3405-3423. doi:10.5194/bg-9-3405-2012
- S. M. Myklestad, “Dissolved Organic Carbon from Phytoplankton,” In: P. Wangersky, Ed., Springer, Berlin, Heidelberg, 2000, pp. 111-148.
- R. Benner, K. Kaiser, “Abundance of Amino Sugars and Peptidoglycan in Marine Particulate and Dissolved Organic Matter,” Limnology and Oceanography, Vol. 48, No. 1, 2003, pp. 118-128. doi:10.4319/lo.2003.48.1.0118
- [61] P. M. Williams, A. F. Carlucci, S. M. Henrichs, E. S. Van Vleet, S. G. Horrigan, F. M. H. Reid and K. J. Robertson, “Chemical and Microbiological Studies of Sea-Surface Films in the Southern Gulf of California and off the West Coast of Baja California,” Marine Chemistry, Vol. 19, No. 1, 1986, pp. 17-98. doi:10.1016/0304-4203(86)90033-2
- [62] A. L. Santos, C. Mendes, N. C. M. Gomes, I. Henriques, A. N. Correia, A. Almeida and Ç. Cunha, “Short-Term Variability of Abundance, Diversity and Activity of Estuarine Bacterioneuston and Bacterioplankton,” Journal of Plankton Research, Vol. 31, No. 12, 2009, pp. 1545- 1555. doi:10.1093/plankt/fbp083
- [63] G. C. Hays, A. J. Richardson and C. Robinson, “Climate Change and Marine Plankton,” Trends in Ecology & Evolution, Vol. 20, No. 6, 2005, pp. 337-344. doi:10.1016/j.tree.2005.03.004
- [64] A. Engel, “Direct Relationship between CO2 Uptake and Transparent Exopolymer Particles Production in Natural Phytoplankton,” Journal of Plankton Research, Vol. 24, No. 1, 2002, pp. 49-53. doi:10.1093/plankt/24.1.49
- [65] I. Joint, S. C. Doney and D. M. Karl, “Will Ocean Acidification Affect Marine Microbes?” The ISME Journal, Vol. 5, 2011, pp. 1-7. doi:10.1038/ismej.2010.79