International Journal of Geosciences
Vol. 3 No. 3 (2012) , Article ID: 21197 , 10 pages DOI:10.4236/ijg.2012.33059
A Review of Geothermal Type-Curves with Damage Effect: A Case of Practical Apply to a Mexican Geothermal Field
1Universidad Popular de la Chontalpa, Cárdenas, México
2Instituto de Investigaciones Eléctricas, Cuernavaca, México
Email: ssagp@hotmail.com.mx, aaragon@iie.org.mx
Received January 31, 2012; revised March 29, 2012; accepted May 9, 2012
Keywords: Geothermal reservoir; Inflow Performance Relationships; Type-curves; Damage effect; Well production; Mass flow rate; Output curves
ABSTRACT
A review of the art state was developed about the inflow relationships and their application for reservoir characterization. The theoretical development of the methodology for determining the damage effect using type-curves of the inflow relationships was shown. We show the process followed for achieve the geothermal type-curve affected with damage for reservoirs with mean salinities of 30,000 ppm and temperatures up to 350˚C. This type-curve was applied using measurement production data in a Mexican geothermal field. According with the obtained results is shown that the methodology for determining the damage effect using production measurements is a sure alternative for the damage effect calculation. It was used an alternative methodology in order to validate the damage presence and the obtained results were consistent. Last thing shows that both methodologies can be combined as a confident manner.
1. Introduction
Geothermal resources ordinarily remain in the reservoir as a mixture of H2O-CO2-NaCl [1,2] with conditions up to 360˚C and 500 bar, with solids concentrations of NaCl dissolved up to 30,000 ppm. In relation with the salinity, the geothermal reservoir of Salton Sea is considered as extremely saline [1], whose NaCl concentration is estimated in 10 times the concentration of the sea water. The wells are the means to extract the geothermal energy from the reservoir to surface through its commercial exploitation. So, the drilling of a well is focused to an efficiently exploitation of the geothermal resource and the criteria applied in the production designs are grounded to achieve high productivities [3].
However the different operations during drilling are the reason of the alterations in the walls of the hole. Examples of these alterations can be found in the changes of formation permeability, due to influence of drilling muds, whose sediments clog the pores spaces. The results of all the alterations provoked to formation during drilling jobs affect to abnormal behavior of the well in the production and in additional losses of the pressures. Last thing is known as skin factor and is called with “s”, because the drilling mud adheres to walls of the hole leaving a thin film similar to skin. During exploitation stage is an ordinary task to characterize the well performance, using production tests at different diameters of opening. Using the values pair, flow rate and pressure (W, p) of the measured data, can be obtained the production characteristic curves (or output curves). These characteristic curves taken at different stages of the productive life of the wells allow characterize their performance. The decrease in the productive characteristics of the well can be related with its decline productivity [3].
Originally the technique of well performance analysis using production characteristic curves was applied in the petroleum industry. With the development of the analysis methodology were incorporated the parameters at reservoir conditions (W, pwf) resulting thus, the inflow performance relationships (IPR). The corresponding graphs are known as inflow curves.
Similarly to petroleum engineering in the geothermal engineering was developed [4] the geothermal inflow performance relationship (GIPR). These relationships relate the flow rate and bottom hole flowing pressure [5]. It were researched abnormal diminutions of the pressure, found [6,7] in the well, which are not related with those expected according to its variations in the flow rate changes. Founding that decrease in the well productivity is related with the presence of the damage that provokes alterations in the permeability formation. Ordinarily the damage effect, have been determined through the analysis of the transient pressure tests [8-15]. However recently was introduced [16] the methodology for determining the damage effect from equations for the analysis of production performance using production measured data.
2. Background
The methodology for determining the damage effect from production measurements uses the data of mass flow rate and pressure (W, p), that are the same used in the technique for production characteristic curves. Through the use of reservoir and wellhead conditions can be obtained the inflow curves [4] and characteristic curves respectively.
One of the possible reasons for the additional decrease in the pressure due to the changes in the flow rate was identified [7,17-19]. Gilbert [20] initially started with the analysis of the inflow behavior and after, Vogel [21] applied this in the characterization of the well in order to establish its exploitation designs. The numerical inflow performance relationships (IPR) were developed [22] for be applied in petroleum systems. Different authors [22- 27, among others] incorporated the analysis of inflow performance relationships in the reservoir engineering. Similarly [28-33] did applications with this type of technical tool for geothermal reservoir characterization.
Additionally were developed inflow relationships assuming the geothermal fluid is composed by: 1) Pure water [34]; 2) A binary mixture H2O-CO2 [35,36]; 3) A ternary mixture H2O-CO2-NaCl with salinity less than 5000 ppm of NaCl [37]; 4) [38] Assumes a ternary mixture H2O-CO2-NaCl with salinities between 5000 and 30,000 ppm of NaCl; and 5) A ternary mixture H2OCO2-NaCl with salinities greater than 30,000 ppm of NaCl [39]. The incorporation of the damage effect in the inflow relationships was proposed for petroleum systems [25] and for geothermal systems [16,39-41].
3. Theoretical Review
The inflow relationships are applied for production characterization in a well. One of the main objectives is the determination of the maximum mass flow rate (Wmax) that the well can produce. The knowledge of this value is used as technical criterium for establishing its exploitation designs and as a reference value of its conditions at the time stage of the production test. Through the comparison of the different production curves, obtained in the well at different stages of its operative life is feasible to determine its decline tendency during its exploitation. The inflow performance relationships are associated with the respective dimensionless parameters of flow rate (WD) and pressure (pD), whose expressions are:
 (1)
(1)
 (2)
(2)
where pwf is the bottom hole flowing pressure, pe is the static pressure of the reservoir, W is the mass flow rate of the well and Wmax is the maximum mass flow rate that the well can produce at the time of the production test.
The inflow performance relationships use as input data, the flow rate and pressure at bottom-hole conditions. During a production test, these values (flow rate and pressure) are measured at wellhead conditions. So, the values at bottom-hole conditions are calculated using well flow simulators. Therefore, by this manner are determined the dimensionless parameters of Equations (1) and (2). Such dimensionless parameters are useful in the reservoir characterization [4].
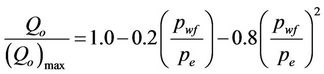
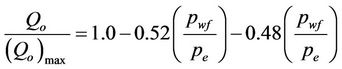
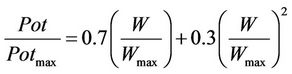
The methodology of analysis using this technique initially was applied [22] for petroleum systems with different physical properties of the reservoir. Through the use of production measurements of different fields [22] modified the methodology of Weller [21] and proposed an equation useful for two phase fluid:
 (3)
(3)
where qo is the petroleum flow rate, (qo)max is the maximum flow rate of oil, pwf and pe as defined previously. The main assumption used in this equation is a compressible fluid with gas content. Standing [23] uses more widely last expression [22] in order to predict the behavior of inflow performance relationships and introduced the productivity index ( ), resulting the next expression:
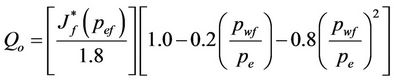 (4)
(4)
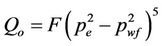
The research, focused to turbulent flow in wells [24] incorporates the turbulence factor (τ), whose expression is:
 (5)
(5)
where F is an auxiliary variable in the analysis, resulting a proportionality constant of the flow as a function of the pressure decrease. The values of the turbulent factor vary between 1.0 (laminar flow) and 0.5 (high turbulent flow). Assuming known the static reservoir pressure (pe) is recommended carry out at least two production tests for evaluate the parameters F and τ.
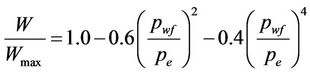
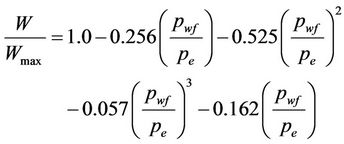
Using data of more than 30 fields were modified the coefficients [25] of the proposed polynomial in [22] resulting the next equation:
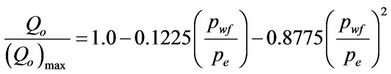 (6)
(6)
Besides was improved in [26] the predictive capacity of the Vogel equation [22] incorporating the decay factor (d), whose expression is:
 (7)
(7)
where
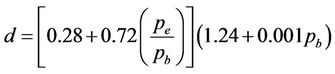 (8)
(8)
There are different procedures for obtaining the inflow curves of a well through the use of the above equations, but the used in this paper is [4]:
• Determine the bubble point pressure (pb) of the fluid and the reservoir pressure (pe) using the analysis results of its chemical composition.
• Determine the exponent value (b) using Equation (8).
• Solve Equation (7) for obtaining (Qo)max using a pair values (Qo, pwf).
• Plot the inflow curve for different Qo values, starting from zero, up to the (Qo)max obtained in Equation (7).
Similar inflow relationships were proposed [27] one for oil systems, whose form is:
 (9)
(9)
And another one for water:
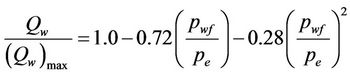 (10)
(10)
where Qw is the water flow rate and (Qw)max is the maximum water flow rate.
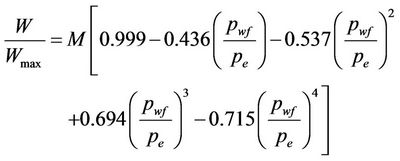
The first geothermal inflow relationships (GIPR) were developed [34] assuming pure water at 300˚C, whose expression for mass productivity is:
 (11)
(11)
And for thermal productivity:
 (12)
(12)
Assuming a binary system H2O-CO2 [35] the corresponding dimensionless inflow relationships were obtained.
 (13)
(13)
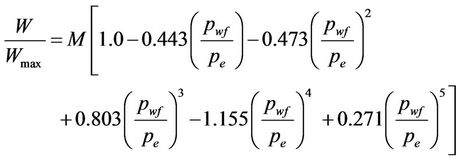
The binary model was applied [3,36,42] to cases of Mexican geothermal fields. The obtained results agree very good with measured data and from these, was feasible to obtain output curves. The inflow curves were validated [43] through comparison with measurements at bottom-hole conditions. Besides, the methodology also was applied for determining the permeability formation [5,44]. Later on, was obtained an expression assuming the fluid as a ternary mixture [37] H2O-CO2-NaCl with salinity less than 5000 ppm, which is the next:
 (14)
(14)
[38] proposed an inflow relationship assuming fluid as a ternary mixture with salts content up to 30,000 ppm in the liquid phase.
 (15)
(15)
The change of variables for obtaining the equation in pD function in place of WD as appears in Equation (15) was did [40] and the expression is:
 (16)
(16)
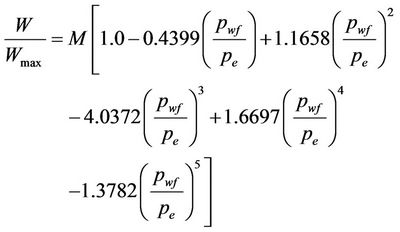
Due that around the world different reservoirs produce fluid with high salinity content, in this research is proposed [39], the inflow relationship considering the fluid as a ternary mixture H2O-CO2-NaCl with high salinity (greater than 30,000 ppm of NaCl) and high temperature (350˚C).
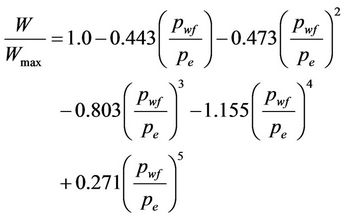 (17)
(17)
It seems that above expression produces more accuracy when the reservoir fluid is with high salinity content. A comparative analysis of the five geothermal inflow performance relationships, Equations (11), (13), (14), (16) and (17), is shown in Figure 1. From the comparison, it can be observed the similarity of the results of these five inflow relationships. Also can be seen that the maximum differences between these inflow relationships, occur in the rank for pD values between 0.3 and 0.8. Table 1 shows the WD values obtained using the above mentioned relationships and the maximum percentage differences found. It can be observed that the maximum values of WD consistently correspond to those obtained considering the fluid as pure water [34]. By other side the minimum values of WD are obtained with inflow relationship of Montoya [37] for 0.1 ≤ pD ≤ 0.7.
Incorporation of the Damage Effect
The first authors [25] that researched the damage effect in the inflow relationships included the M coefficient in Equations (3) and (6) proposed above [22,25]. The resulting expressions are:
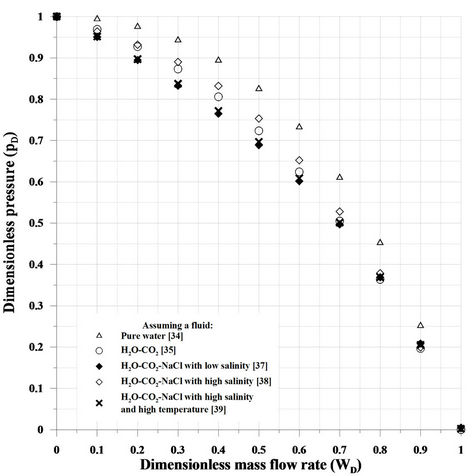
Figure 1. Comparison of the five geothermal inflow performance relationships, proposed by different authors.
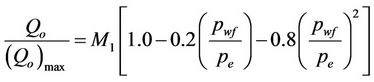 (18)
(18)
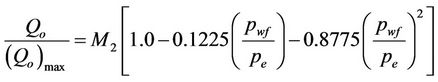 (19)
(19)
The parameter M involves the damage effect(s) and is function of the ratio between the radius of drainage area of the reservoir (re) and the well bore radius (rw). According with Equations (18) and (19) the M value is slightly different for each considered case, so, the expressions for each M value [45] are:
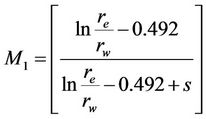 (20)
(20)
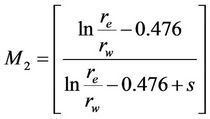 (21)
(21)
The M parameter acts as inverse function in the Darcy’s law, so the coefficient values of 0.492 and 0.476 were obtained [25] from different simulations done. They [25] assume as a drainage radius, values between 67 and 91 m (220 and 300 ft. respectively) and 0.0635 m (2.5 in.) as average radius of a well. According with the last considerations, the Equations (20) and (21) take next expressions:
 (22)
(22)
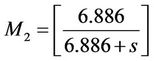 (23)
(23)
According with different authors [28] for geothermal reservoirs, it is possible to assume as drainage radius re, a value of 400 m (1312 ft.) and as a wellbore radius rw of 0.0889 m (3.5 in.). Therefore the M value in a geothermal system is expressed with next form:
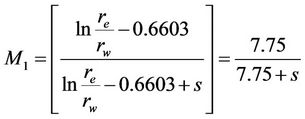 (24)
(24)
During exploitation stage, the damage effect in a well is identified by its productivity decrease. However the concept of the damage effect is related with the alteration of its initial conditions. Therefore the damage effect in a well could have positive, negative or zero values [45].
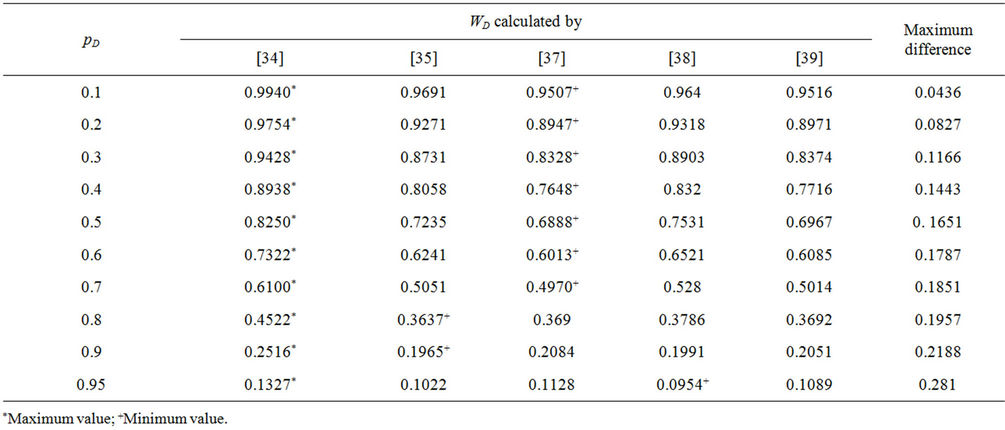
Table 1. Values of WD obtained using the five geothermal inflow performance relationships and maximum percent differences found.
The positive values of the damage effect indicate diminution in the well productivity, while negative values indicate improvement in its productivity. Zero value of damage effect indicates a natural effect of the reservoir without any artificial manipulation. A negative value of the damage effect could be present after the well has been washed, stimulated and/or fractured. According with Equation (24) the damage effect(s) is an inverse function of M parameter. So, while the s value increases, M value decreases and contrarily, while s decreases, M increases. Combining M parameter into GIPR and considering that the fluid is a mixture of H2O-CO2-NaCl with salinity less than 5000 ppm is obtained [45] next expression:
 (25)
(25)
Considering the fluid as a mixture of H2O-CO2-NaCl with salinity greater than 5000 ppm [38], the expression is:
 (26)
(26)
While that, considering a mixture of fluid composed by H2O-CO2-NaCl with salinity of 30,000 ppm and 350˚C of temperature [39], the expression is:
 (27)
(27)
Figure 2 represents Equation (27) using different damage
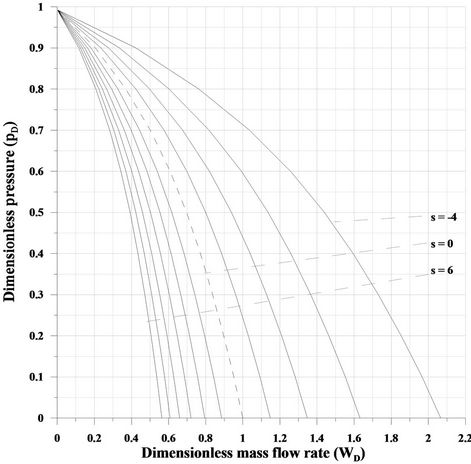
Figure 2. Geothermal inflow type curve affected with damage, obtained considering a ternary mixture H2O-CO2-NaCl with salinities of 30,000 ppm and temperature of 350˚C.
values. The practical application of this type curve is focused to determine the damage effect values in wells using dimensionless parameters (WD, pD) obtained from their production measurements.
4. Field Applications
Due that it is difficult retire the well from continuous operation we propose the use of production easurements (W, pwh) taken at wellhead conditions. So for determining bottom hole flowing pressure (pwf) we used well flow simulators. The methodology for determining the damage effect [45,46] is used in this work and is shown the application of the type-curve with damage effect for salinity of 30,000 ppm and 350˚C of temperature [39].
In order to show the application of the proposed methodology, data of wells 17, 18, 26, 33, 34 and 46 [47], of the Los Azufres México geothermal field were used. These wells are located at the south zone of this fieldwhose location is shown in Figure 3.
Los Azufres geothermal field is the second Mexican production field, is highly fractured and of volcanic origin. It is important make mention that tectonic regional system and the recent stress generated normal faults in E-W direction. Last thing resulted in reaction of ancient faults, which are crossed by the majority of production wells. Therefore it is believed that these faults act as geothermal fluid conduction, controlling the majority of thermal hot springs. The most important faults at the zone of this field are: “El Chinapo”, “Los Azufres”, “Puentecillas”, and “Agua fría” [48].
Due that there is not a methodology for verify the presence or absence of the damage effect [45], in this work was found appropriate to apply the methodology of the turbulence analysis [49] using measurements production data. This methodology allows to diagnose the presence or absence of the damage effect and its use have been shown be successful. This methodology was developed for be applied in oil wells, by this reason the application in geothermal wells, to date is too scarce. The method [49] is used for identify the loss of pressure due to turbulent flow caused by presence of damage at the interface well-reservoir [45].
The methodology was used for each well, using data of theirs production tests carried out at different stages of their operative life, from the startup of operation. Were calculated the parameter values at reservoir conditions and the corresponding dimensionless values (WD, pD) using Equations (1) and (2). The dimensionless value pairs are graphed on the type curve proposed in this work (Figure 2). From the comparison of the dimensionless values of the well with the type curve, the damage effect is determined as shown in Figure 4.
In this work we presented production measurements data of the well No. 34. However a similar process was applied in all analyzed wells and the results are shown in Table 2.
It was found that during low flow rates, the transient
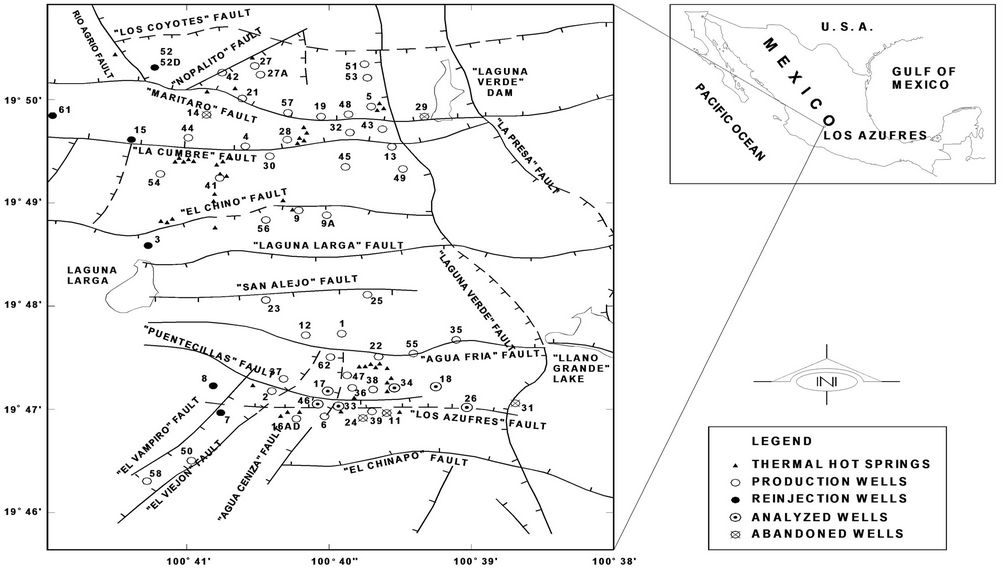
Figure 3. Map of location of analyzed wells in this work.
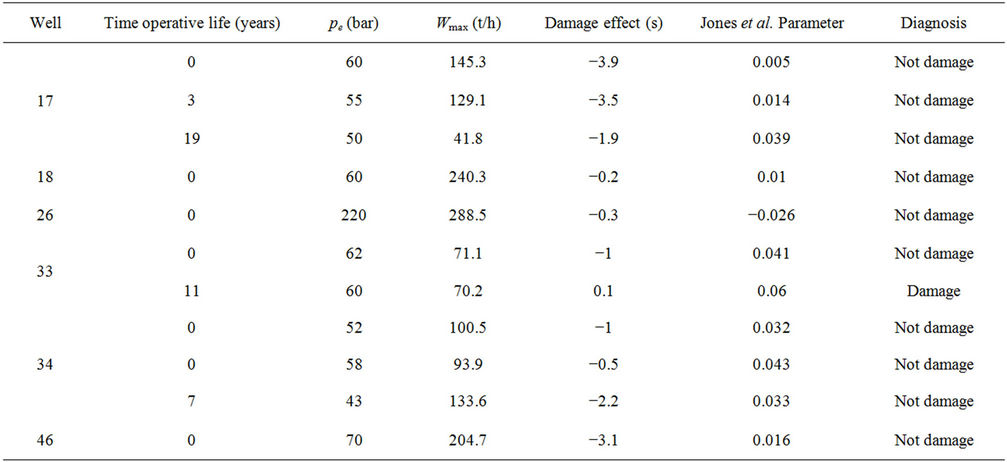
Table 2. Damage values and characterization parameters obtained with methodology described in this work using measurement production data of analyzed wells.
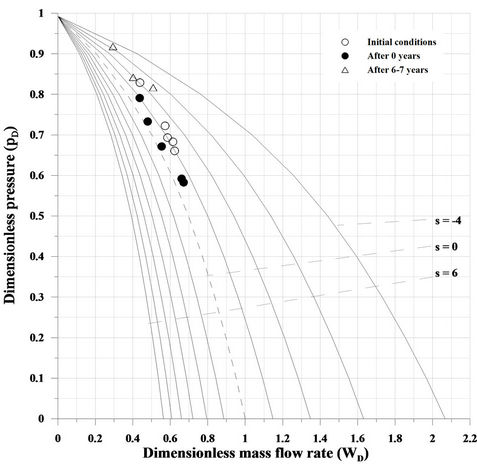
Figure 4. Obtention of the damage effect values, using the type-curve with damage effect, high salinity, high temperature and production data of well 34.
effects have higher duration time. By this reason in this work are considered the measured values at higher flow rates, assuming that the transient effects have finished.
In order to verify the presence or absence of the damage was used the qualitative method [49]. Such method requires at least of three pairs of measured data (W, p) and the procedure is as follows:
Calculate the value (pe − pwf)/q at each one of the different measurements. This value represents the inverse value of the productivity index J, whose expression is:
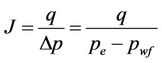 (28)
(28)
Obtain a graph of (pe − pwf)/q versus q, later fit the calculated values to a right line equation, determining the values of the intersection to origin (b value) and the slope (m), according with Equation (29).
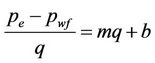 (29)
(29)
If b value is less than 0.05 there is not damage in the well. However if b value is greater than 0.05 there is damage in the analyzed well. This procedure is shown in Figure 5 using measured production data of well 34.
The method [49] also can be applied for identify presence of turbulent flow in the wellbore by calculating b* value, through the use of next expression:
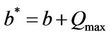 (30)
(30)
If the value of the ratio b*/b < 2.0 the turbulent flow is light or null at the interface wellbore-reservoir.
Table 2 shows the main values of parameters obtained in this work, which are useful for well characterization. The different times of operative life of each analyzed well are shown in this same table. Similarly the characterization parameters (Wmax, pe) of the reservoir, the damage effect(s) and the parameters of Jones et al. [49] are shown.
From Table 2 it can be observed a correlation between the columns of the damage effect, Jones et al. parameter [49] and the diagnosis about presence or absence of damage.
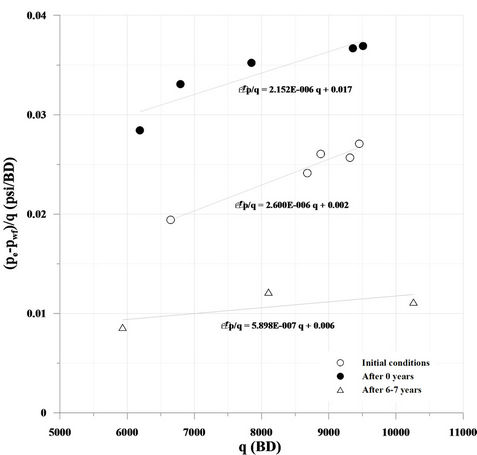
Figure 5. Application of Jones et al. methodology [49] for diagnosing damage presence in well 34.
5. Discussion Results
According with our methodology can be observed that were obtained negative values of the damage effect in all cases except in one. As mentioned before, the behavior of the damage effect is a function of the reservoir characteristics and therefore can be related with decline of its productivity. The obtained values of the damage effect in each well show a behavior corresponding to different stages of their operative life.
It is important annotate that the values of damage effect that we obtained in wells 17, 33 and 34 change as a function of the exploitation time. Also it is assumed that the damage effect values are changing due to different jobs applied in the well, such as cleaning, repairs, stimulations, fracturing, etc. The analysis of the well 34 indicates improving condition, which can be observed in the behavior of obtained values of the damage effect. By other side, the change to positive values of damage effect in the well 33 indicates decline in its productivity.
From the obtained values of the Jones et al. parameter, shown in Table 2, it can be observed that in the majority of the cases b values are less than 0.05, which diagnose that there is not damage. Therefore can be identified a consistency in the obtained values through the application of both methodologies.
We assume that the slight increase of the calculated value of the damage effect in the well 33 is related with decline in its productivity.
The main objective of the inflow relationships in the reservoir and production engineering is focused to the practical applications such as productivity diagnosis of the wells, exploitation designs, reserves calculation etc. [45]. As can be seen, we obtained values of the damage effect correspond to wells during their production stage, which are useful in their analysis performance. Therefore taking into account that the behavior of the damage effect is related with the productivity decline, we propose that is feasible use these parameters for reservoir characterization.
In our opinion the analyzed wells are locate in a zone with geological structures, whose influence helps to understand the behavior of obtained damage values.
6. Conclusions
From the developed research the main conclusions are the next:
A review about the development of the different methodologies that use the inflow performance relationships for reservoir characterization was done.
The theoretical sequence to art state of the methodology for determining the damage effect using measurement data production of a well was shown.
The process for obtain the type-curve with damage effect for reservoirs with high salinity, high temperature and its application to cases of a Mexican geothermal field, was shown.
From the obtained results it is possible to identify the decline tendency using the results of the damage effect in analyzed wells.
The presence of the damage effect was validated using an alternative methodology which allows determine qualitatively its presence obtaining consistent results.
Due to the obtained results with the methodology applied in the analysis of the field behavior, can be assured that this is useful in reservoir characterization.
Through this work was found that the knowledge of the damage effect using production measurements is a useful technical tool in the criteria definition for establishing exploitation designs.
The knowledge of productivity decline rate through behavior of damage effect helps to define the appropriate operations to apply in the well for improving its performance.
7. Acknowledgements
The authors express their gratitude to Instituto de Investigaciones Eléctricas, to Comisión Federal de electricidad and to Universidad Popular de la Chontalpa, México by the support in this research.
REFERENCES
- A. Battistelli, C. Calore and K. Pruess, “The Simulator TOUGH2/EWASG for Modeling Geothermal Reservoirs with Brines and Non-Condensibles Gas,” Geothermics, Vol. 26, No. 4, 1997, pp. 437-464. doi:10.1016/S0375-6505(97)00007-2
- L. N. Gutiérrez, “Recursos Geotérmicos de México,” Proceedings Simposio Internacional de Geología Ambiental para Planificación del uso de Territorio, Puerto Varas, 4-6 November 2002, pp. 67-70.
- S. L. Moya, A. Aragón and L. González, “Estimación de Curvas Características de Producción de Pozos Geotérmicos Empleando dos Curvas de Referencia Adimensionales del Comportamiento de Influjo,” Ingeniería Hidráulica en México, Vol. 12, No. 3, 1997, pp. 35-40.
- A. Aragón, G. Izquierdo, M. Pal-Verma and S. Santoyo, “Análisis de Influjo en Pozos Geotérmicos para la Determinación de sus Flujos Máximos,” Ingeniería Hidr- áulica en México, Vol. 24, No. 1, 2009, pp. 73-83.
- S. L. Moya, D. Uribe, A. Aragón and A. García, “Formation Permeability at the Feedzone of Geothermal Wells Employing Inflow Type-Curves,” Geofísica Internacional, Vol. 40, No. 3, 2001, pp. 163-180.
- H. H. Evinger and M. Muskat, “Calculations of Theoretical Productivity Factor,” Transaction of American Institute of Mining, Metallurgical, and Petroleum Engineers, Vol. 146, No. 1, 1942, pp. 126-139.
- D. R. Horner, “Pressure Build-Up in Wells,” Proceedings of 3rd World Petroleum Congress, E. J. Brill, Leiden, 1951, p. 503.
- J. E. Warren and P. J. Root, “The Behavior of Naturally Fractured Reservoirs,” SPE Journal, Vol. 3, No. 3, 1963, pp. 245-255.
- C. S. Matthews and D. G. Russell, “Pressure Buildup and Flow Test in Wells,” Monograph, Vol. 1, Society of Petroleum Engineers of AIME, Henry L. Doherty Series, Dallas, 1977.
- R. G. Agarwal, R. Al-Hussainy and H. J. Ramey Jr., “An Investigation of Wellbore Storage and Skin Effect in Unsteady Liquid Flow: I. Analytical Treatment,” SPE Journal, Vol. 10, No. 3, 1970, pp. 279-290.
- H. J. Ramey, “Short-Time Well Test Data Interpretation in the Presence of Skin Effect and Wellbore Storage,” Journal of Petroleum Technology, Vol. 22, No. 1, 1970, pp. 97-104.
- R. C. Earlougher Jr., “Advances in Well Test Analysis,” Monograph, Vol. 5, Society of Petroleum Engineers of AIME, Dallas, 1977.
- J. R. Rivera and H. J. Ramey Jr., “Application of TwoRate Flow Tests to the Determination of Geothermal Reservoirs Parameters,” Proceedings of 52th Annual Fall Meeting of Society of Petroleum Engineers, Denver, 9-12 October 1977, pp. 346-353.
- J. Barua and R. Horne, “Computerized Analysis of Thermal Recovery Well Test Data,” SPE Journal, Formation Evaluation, Vol. 2, No. 4, 1997, pp. 560-566.
- C. S. Chen and C. C. Chang, “Theoretical Evaluation of Non-Uniform Skin Effect on Aquifer Response under Constant Rate Pumping,” Journal of Hydrology, Vol. 317, No. 3-4, 2006, pp. 190-201. doi:10.1016/j.jhydrol.2005.05.017
- A. Aragón, G. Izquierdo and V. Arellano, “Practical Application of the Damage Determination in a Well,” Geothermal Resources Council Transactions, Vol. 34, 2010, pp. 1125-1130.
- M. Muskat, “The Production Histories of Oil Producing Gas-Drive Reservoirs,” Journal Applied Physics, Vol. 16, 1945, pp. 147-153. doi:10.1063/1.1707566
- A. F. Van Everdingen and W. Hurst, “The Application of the LaPlace Transformation to Flow Problems in Reservoirs,” Petroleum Transactions AIME, Vol. 196, 1949, pp. 156-164.
- A. F. Van Everdingen, “The Skin Effect and Its Influence on the Productive Capacity of a Wells,” Transaction of American Institute of Mining, Metallurgical, and Petroleum Engineers, Vol. 203, 1952, pp. 171-176.
- W. E. Gilbert, “Flowing and Gas-Lift Well Performance,” Drilling and Production Practice, Vol. 13, 1954, pp. 126-157.
- W. T. Weller, “Reservoir Performance during Two-Phase Flow,” Journal of Petroleum Technology, Vol. 18, No. 2, 1966, pp. 240-246. doi:10.2118/1334-PA
- J. V. Vogel, “Inflow Performance Relationships for Solution Gas Drive Wells,” Annual Fall Meeting of Society of Petroleum Engineers, Dallas, 29 September-2 October 1968, pp. 66-79.
- M. B. Standing, “Inflow Performance Relationships for Damaged Wells Producing by Solution-Gas Drive,” Journal of Petroleum Technology, Vol. 21, No. 11, 1970, pp. 1399-1400.
- J. J. Fetkovich, “The Isochronal Testing of Oil Wells,” SPE 48th Annual Fall Meeting, Las Vegas, 30 September-3 October 1973, pp. 78-84.
- M. A. Klins and M. W. Majcher, “Inflow Performance Relationships for Damaged or Improved Wells Producing under Solution-Gas Drive,” Journal of Petroleum Technology, Vol. 44, No. 12, 1992, pp. 1357-1363. doi:10.2118/19852-PA
- M. A. Klins and L. Clark, “An Improved Method to Predict Future IPR Curves,” SPE Reservoir Engineering, Society of Petroleum Engineers, San Antonio, 1993, pp. 243-248.
- M. L. Wiggins, “Generalized Inflow Performance Relationships for Three-Phase Flow,” Production Operations Symposium, Oklahoma City, 25-28 March 1994, pp. 275-286.
- A. Grant, G. Donaldson and F. Bixley, “Geothermal Reservoir Engineering,” Academic Press, New York, 1982.
- S. P. Kjaran and J. Elliasson, “Geothermal Reservoir Engineering,” Lecture Notes, University of Iceland, Reykjavik, 1982, pp. 222-236.
- S. K. Garg and T. D. Riney, “Analysis of Flow Data from the DOW/DOE, L. R. Sweezy No. 1 Well,” Topical Report, La Jolla, 1984, pp. 78-83. doi:10.2172/5096904
- M. H. Chu, “Inflow Performance Relationships for Geopressured Geothermal Wells,” Geothermal Resources Council Transactions, Vol. 12, 1988, pp. 437-440.
- R. James, “One Curve Fits All,” Proceedings of 14th Workshop on Geothermal Reservoir Engineering, Stanford University, Stanford, 24-26 January 1989, pp. 329- 334.
- C. Gunn and D. Freeston, “Applicability of Geothermal Inflow Performance and Quadratic Drawdown Relationships to Wellbore Output Curve Prediction,” Geothermal Resources Council Transactions, Vol. 15, 1991, pp. 471- 475.
- E. Iglesias and S. L. Moya, “Geothermal Inflow Performance Relationships,” Geothermal Resources Council Transactions, Vol. 14, 1990, pp. 1201-1205.
- S. L. Moya, “Efectos del Bióxido de Carbono Sobre el Transporte de Masa y Energía en Yacimientos Geotérmicos,” Tesis de Doctorado, Universidad Nacional Autó- noma de México, México City, 1994.
- S. L. Moya, A. Aragón, E. Iglesias and E. Santoyo, “Prediction of Mass Deliverability from a Single Wellhead Measurement and Geothermal Inflow Performance Reference Curves,” Geothermics, Vol. 27, No. 3, 1998, pp. 317-329. doi:10.1016/S0375-6505(98)00005-4
- D. Montoya, “Estimación de Permeabilidades de Yacimientos Geotérmicos Mediante la Aplicación de Curvas Tipo de Influjo Geotérmico,” Tesis de Maestría, Centro Nacional de Investigación y Desarrollo Tecnológico, Cuernavaca, 2003.
- O. Meza, “Efecto de la Precipitación de Sales en el Diagnóstico de Permeabilidades Rocosas,” Tesis de Maestría, Centro Nacional de Investigación y Desarrollo Tecnológico, Cuernavaca, 2005.
- S. López, “Análisis del Comportamiento de Influjo con Efecto de Daño en Yacimientos Altamente Salinos y de Alta Temperatura,” Tesis de Licenciatura, Universidad Popular de la Chontalpa, H. Cárdenas, 2011.
- A. Aragón, “La Influencia del Factor de daño en CurvasTipo de Influjo Geotérmico y su Impacto en el Diagnóstico de Permeabilidades,” Tesis de Doctorado, Centro Nacional de Investigación y Desarrollo Tecnológico, Cuernavaca, 2006.
- A. Aragón, S. L. Moya and A. García, “Inflow Performance Relationships in Geothermal and Petroleum Reservoir Engineering: A Review of the State of the Art,” Geothermics, Vol. 37, No. 4, 2008, pp. 635-650.
- S. L. Moya, E. Iglesias and A. Aragón, “Curvas de Referencia Adimensionales para Estimar Productividades de Masa y Energía en Yacimientos Geotérmicos con/sin Bióxido de Carbono,” Geotermia, Revista Mexicana de Geoenergía, Vol. 11, 1995, pp. 167-179.
- E. Iglesias and S. L. Moya, “Applicability of Geothermal Inflow Performance Reference Curves to CO2-Bearing Reservoirs,” Geothermics, Vol. 27, No. 3, 1998, pp. 305- 315. doi:10.1016/S0375-6505(98)00004-2
- S. L. Moya, D. Uribe and D. Montoya, “Computational System to Estimate Formation Permeabilities and Output Curves of Geothermal Wells,” Computer & Geosciences, Vol. 29, No. 9, 2003, pp. 1071-1083. doi:10.1016/S0098-3004(03)00031-1
- A. Aragón, S. L. Moya and M. Suárez, “Determination of the Damage Effect in Geothermal Wells Using Inflow Type Curves,” Geothermal Energy Research Trends, Nova Publishers Inc., New York, 2008, pp. 163-201.
- S. López and A. Aragón, “Caracterización de Yacimientos a Partir de Análisis de Mediciones de Producción,” Investigación y Posgrado Revista de la Universidad Popular de la Chontalpa, Vol. 2, 2011, pp. 24- 29.
- S. de Estudios, “Características de Producción Actuales del Campo Geotérmico de Los Azufres, Mich., México,” Informe Interno ISE-045-2002, Gerencia de Proyectos Geotérmoeléctricos de la CFE, Morelia, 2002.
- M. C. Salto and A. F. Hernández, “Simulación Numérica de Yacimientos Geotérmicos Mediante el Simulador de Volúmenes Finitos, TOUGH2,” Reporte Interno AIT, Gerencia de Geotermia del IIE, Cuernavaca, 2011.
- G. Jones, M. Blount and H. Glaze, “Use of Short Term Multiple Rate Flow Tests to Predict Performance of Wells Having Turbulence,” SPE 51st Annual Fall Meeting, New Orleans, 3-6 October 1976, pp. 378-383.