Food and Nutrition Sciences
Vol.5 No.13(2014), Article
ID:47874,11
pages
DOI:10.4236/fns.2014.513137
A Study on Tomato Candy Prepared by Dehydration Technique Using Different Sugar Solutions
Md. Hasanuzzaman1, M. Kamruzzaman1, Md. Mominul Islam1, Sultana Anjuman Ara Khanom2, Md. Mashiar Rahman3, Laisa Ahmed Lisa4, Dipak Kumar Paul1*
1Department of Applied Nutrition and Food Technology, Islamic University, Kushtia, Bangladesh
2Vegetable Technology Research Section, Institute of Food Science & Technology, Bangladesh Council of Scientific and Industrial Research (BCSIR), Dhaka, Bangladesh
3Food Enzymology Research Section, Institute of Food Science & Technology, Bangladesh Council of Scientific and Industrial Research (BCSIR), Dhaka, Bangladesh
4Department of Microbiology and Biotechnology, Jagannath University, Dhaka, Bangladesh
Email: *dpauliu@yahoo.com
Copyright © 2014 by authors and Scientific Research Publishing Inc.
This work is licensed under the Creative Commons Attribution International License (CC BY).
http://creativecommons.org/licenses/by/4.0/


Received 21 April 2014; revised 26 May 2014; accepted 9 June 2014
ABSTRACT
The aim of the research was to develop a self-stable dehydrated tomato product using different sugar solutions and to study the effects of the sugar solution on the characteristic of tomato candy. Tomato was immersed into the sugar solution with the concentrations of 40%, 50% and 60% for 24 hours. Moisture, ash, protein, fat, vitamin C, acidity, total sugar, crude fiber, total SO2 and salt content and organoleptic quality and microbiological status of the prepared candy were analyzed. There was a tendency of decreasing moisture, ash, protein, fat, vitamin C, acidity, crude fiber and increasing total sugar content with increased concentration of sugar solution used. On the microbiological analysis, total bacteria and total fungus load were increased with increasing the concentration of sugar solution. The best characteristic of tomato candy was found with 40% sugar solution, with highest nutrient and sensory score and lowest microbial load than candy prepared with 50% and 60% sugar solution.
Keywords:Tomato Candy, Sugar Solution, Nutritional Composition, Organoleptic Quality, Sensory Score, Microbial Load

1. Introduction
Tomato (Lycopersiconesculentum) is one of the most important edible and nutritious vegetable crops in Bangladesh. Tomato is the nutritious food which contains many vitamins and minerals that are useful for our health [1] . Tomato is cultivated in all parts of Bangladesh due to its adaptability to a wide range of climate and soil [2] . It ranks next to potato and sweet potato in respect of vegetable production in the world. It is widely cultivated in tropical, sub-tropical and temperate climates and ranks third in terms of world vegetable production [3] . The best growing areas of tomato in Bangladesh are Chittagong, Comilla and Rajshahi [4] and it ranks fourth in respect of production and third in respect of area [5] .
Fruits and vegetables usually do not survive in a long storage and similarly tomatoes are vulnerable to damage. Fungal growth is one of the major problems that often arise on the surface of tomatoes. As a seasonal fruit, tomato is widely found in winter season and the price is relatively cheap at the time of harvest. During non-harvesting season, the price of tomatoes rises and goes beyond the affordable limit of general people. The high price of tomatoes indeed creates the demand of availability of tomatoes during the off season. In Bangladesh, the storage system is not so abundant and plenty of tomatoes are lost every year. Tomato candy making is one of the alternative processes to preserve tomato. Fresh tomatoes usually can be fresh for 3 - 4 days without any preservation system; whereas tomato candies have the endurance for as long as about 6 months. Tomato candy would be more attractive to consumers because it is more practical to live to eat. It contains a number of nutritive elements almost double compared to fruit apple and shows superiority with regard to food values [6] .
Tomato contains vitamin C and licopenand β-carotene which are very beneficial to health. Research studies have shown that tomatoes contain enzymes or a factor (dubbed P3) that inhibits platelets in blood from clumping together and forming blood clots [7] . Tomato is also rich in antioxidant lycopene that is known to be an effective guard against breast cancer, prostate cancer, coronary artery diseases, and atherosclerosis [8] . Epidemiological research has also shown that lycopene may protect against breast cancer [9] and myocardial infarction [10] . Tomato is also high in calcium, vitamin C, carbohydrates, and phosphorus. Tomatoes help wash out the toxins and other contaminants from the body and act as a gentle stimulant for kidneys. Tomatoes are also rich in vitamin A. Regular consumption of tomatoes can prevent shortsightedness, night blindness, and other eye diseases. Tomato is also effective in curing morning sickness, excessive gas formation in the intestine, gastro-intestinal diseases, indigestion, etc. Tomato is also helpful in preventing joint pain problems and the respiratory disorder as well [11] .
Osmotic dehydration (OD) is an important technique of food preservation and processing in which foods especially fruits and vegetables are immersed in the osmotic solution containing concentrated salt, sugar, alcohol or starch. The osmotic agent used may be fructose, corn syrup, glucose, sodium chloride or sucrose. Cell membrane of fruits and vegetables works as semipermeable membrane which permits water to move from low concentrated fruits and vegetables to high concentrated osmotic solution [12] . The dehydration occurs primarily due to an osmotic water flow and solute activity gradients across the semi permeable membranes. Osmotic dehydration is actually a simultaneous diffusion process, brings some benefits reducing the damage of heat to the flavor, color, inhibits the browning of enzymes and decreases the energy costs [13] . Comparing to other conventional methods, Osmotic Dehydration treatment is a simple procedure which requires no mechanical aid and involves decreased cost of energy. It is easy to perform at room temperature, which ensures the retention of color, texture and nutrients. OD treatment also involves limited loss of volatile compounds and less oxidative changes [14] . The aim of this study was to develop a processed tomato candy through the combination of osmotic dehydration and mechanical drying.
2. Materials and Methods
2.1. Materials
The research was conducted in October 2011 to April 2012, at vegetable Technology Section, Institute of Food Science and Technology, Bangladesh Council of Scientific and Industrial Research, Dhaka. Mature ripe tomatoes and sugar was used to prepare the candy and were collected from the local markets of Dhaka. The sample was packed in polyethylene bag and stored at refrigeration temperature in airtight box at the laboratory until use.
2.2. Methods
Ripe tomatoes were selected and collected according to their uniform size, freshness and cleanliness (free from dirt, twigs, soil, dust). Color sorting methods of United State Department of Agriculture (USDA) was used to select ripe tomatoes. According to this method, tomatoes with more than 90% of the surface area with red color were sorted and selected as ripe [15] . The tomatoes were then washed to clean the dirt that is still attached and then boiled at 85˚C temperature for 10 minutes followed by stripping the skin and cut into quarter pieces of each tomato. The seed and hard portion of tomatoes were removed. Then tomatoes were soaked in sugar solution (40, 50 and 60˚Brix). Sucrose was used as osmotic agent. Brix Hydrometers are used to measure the Brix. Then the soaked tomatoes were boiled for about 15 minutesand the solution of salt and citrate were added as 0.2% as flavoring agent. After cooling, sodium meta-bi-sulphite was added as preservative as 0.1%. Tomatoes were stored at room temperature for about 20 hours followed by draining to reduce free water attached to tomatoes and then dried at 60˚C in mechanical dryer to obtain the moisture content of ≤10% (Figure 1). Prepared tomato candy were then wrapped in polythene pouch and kept in a cool place in an airtight plastic box for storage.
2.2.1. Proximate Nutrient Analysis
Moisture content of collected samples was determined by drying the samples at 105˚C in a drying oven till a constant weight was attained [16] . Ash content was determined in triplicate using a muffle furnace at 600˚C for 8 h by AOAC method [17] . Protein content was determined by the Micro-Kjeldahl method as described by AOAC [18] by first determining the percent nitrogen content and then converted to % crude protein by multiplying with the factor 6.25. Total sugar content of the sample was determined by Phenol Sulfuric acid method [19] -[21] . The total lipid content of sample was determined using Soxhlet apparatus [22] . Crude fiber was determined by Acid-Alkali Hydrolysis as followed by AOAC [23] . Available carbohydrate content was determined by difference, i.e. by subtracting the sum of the values of moisture, ash, protein, fat and crude fiber from 100 (per 100 gm) [24] . Ascorbic acid content was determined according to Moreira et al. [25] and Bruce et al. [26] by titrimetric method using a dye 2,6-dichlorophenolindophenol. Tomato sample was analyzed for percent acidity and salt content according to standard procedures described by AOAC [27] . Sulfites content of tomato was determined by titrimetric methods as described by Hillery et al. [28] . Weight loss of tomato was analyzed by osmotic dehydration methods [29] . The energy content of the samples was determined by calculating the amount of protein, fat and carbohydrate of respective food items and by using the following equation [30] .

2.2.2. Microbiological Analysis of Tomato Candy
Microbial examinations of tomato candy were performed to assess Bacterial, Fungal and Yeast load under laboratory condition. Standard plate count, Fungal and Yeast count and enumeration of total coliform and Staphylococcus aureus ssp. of tomato candy were examined. All media and equipment were sterilized by steam Sterilization at 15 psi for 20 minutes at 121˚C in an autoclave. For analysis, 10 gm of each sample was aseptically weighted and diluted to 1:10 (10 gm in 90 ml) with sterilized distilled water and mixed well. Standard plate count (SPC) was estimated by decimal dilution technique followed by the pour plate method and Spread Plate
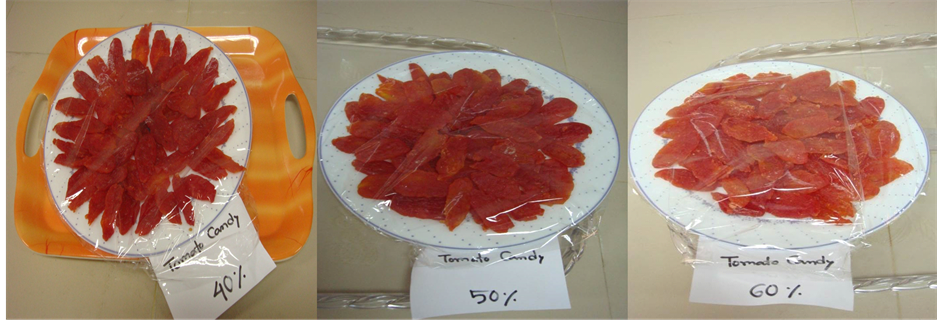
Figure 1. Tomato candy with 40%, 50% and 60% sugar solution.
Method for Fungus and Yeast. In the Pour Plate Method, 0.1 ml and 1 ml samples were pipetted onto sterilized Petri plates. Sterilized agar medium was cooled to about 45˚C and was poured on the plates. The media was mixed well by a gentle swirling motion. The Petri plates were then allowed to solidify. The plates were incubated at room temperature for 24 - 72 hours. In this study for each sample there were 2 Petri plates for 0.1 ml and other 2 for 1 ml [31] [32] . For Spread Plate Method approximately 15 ml of previously autoclaved media was poured in a sterilized Petri plate and was kept at room temperature until the agar was solidified. In Potato dextrose agar (PDA) plate, 0.2 ml sample was dropped and then the sample was spread on the agar plate with the help of sterilized bent glass rod (spreader). By this method, yeast and mould counts were determined [33] [34] . The plate was then incubated at the 37˚C temperature for 24 to 72 hours. All steps of this media were done under laminar airflow. Staphylococcus aureus count in tomato candy samples was determined according to the methods of Lancette and Bennett [35] . Isolation and enumeration of total coliform were performed by Most Probable Number (MPN) method. The MPN method using lauryl tryptose sulfate broth (LST) [36] is a statistical, multi-step assay consisting of presumptive, confirmed and completed phases. In the assay, serial dilutions of a sample are inoculated into broth media. From the gas positive (fermentation of lactose) tubes, the other 2 phases of the number of organisms was estimated from statistical tables. Typically only the first 2 phases were performed in coliform analysis for E. coli [37] .
2.2.3. Sensory Evaluation of Tomato Candy
The food sample was prepared at Vegetable Technology section and the taste testing was carried out at the Quality Control section of institute of food science and technology (IFST) of Bangladesh council of scientific and industrial research (BCSIR) Dhaka. Seven subjects (employees of Institute of Food Science and Technology of BCSIR) participate in the evaluation of taste. Sensory evaluation of tomato candy was carried out for Color, Texture, Flavor, Softness, Taste and Overall acceptance by the panel of seven judges. Samples were presented in succession and panelists were asked to rate evaluation variables according to 9-point Hedonic scale as described by Larmond [38] . The 9-point Hedonic scale was used, where the lowest point 1 = extremely dislike and the highest point 9 = extremely like.
3. Results
3.1. Weight Reduction of Raw Material
Figure 2 and Figure 3 illustrate a plot of respective mass transfer parameter (weight reduction) as a function of osmotic times due to the influence of three different sugar solutions. In case of osmotically-dehydrated blanched tomato, a trend of rapid weight loss for the first hour of osmotic process was observed, after which the rate of mass transfer parameter gradually slowed down towards the equilibrium end-point whereasosmotically-dehydrated unblanched tomato lose weight rapidly for the first two hour and after which the rate of mass transfer parameter gradually slowed down. In case of osmotically-dehydrated unblanched tomato, the weight loss was higher than the blanched one. After 4 hours, osmotically-dehydrated unblanched tomato candy with 40%, 50% and 60% sugar solution lose weight from 14.2% - 39.4%, 15.0% - 44.13% and 16.10% - 50.29% respectively, whereas blanched tomato candy lose weight from 12.88% - 22.88%, 13.29% - 23.83% and 20.75% - 33.93% respectively.
A tendency of increased weight reduction was shown with increasing the sugar concentration from 40% to 60%. It is shown from the Table 1 that at 0.5 hr the weight loss of osmotically-dehydrated unblanched tomato was 14.2% for (40% sugar), 15.0% (50% sugar) and 16.10% (60% sugar) and at 4.0 hr the weight loss was 39.4%, 44.13% and 50.29% respectively. Whereas at 0.5 hr the weight loss of osmotically dehydrated blanched tomato was 12.88% (40% sugar) 13.29% (50% sugar) and 20.75% (60% sugar) and at 4.0 hr the weight loss was 22.88%, 23.83% and 33.93% respectively. The addition of salt in the sugar solution was also shown to increase the rate of weight loss to a greater extent. The addition of salt in the sugar solution was also shown to increase the rate of weight loss to a greater extent.
3.2. Nutritional Composition of Raw Tomato and Tomato Candy
The chemical composition of raw tomato was found as moisture 91%, ash 0.5%, protein 0.73%, fat 0.03%, acidity

Figure 2. Weight loss of unblanched tomato.

Figure 3. Weight loss of blanched tomato.

Table 1. Weight loss of raw material.
0.39%, total sugar 2.13%, crude fiber 0.66%, vit-C 13.05 mg/100gm, carbohydrate 7.74% and energy 35.006 kcal. The data for chemical composition of final product are presented in Table2 All samples were analyzed four times, for 6 months with and interval of 2 months, to know the change in nutrient content of the tomato candy. The concentration of sugar solution influences some of the characteristics of tomato candy. Table 2 showed a trend of gradual decrease of ash, protein, fat, sugar, acidity, crude fiber, vit-C and energy content with increasing moisture content. Whereas freshly prepared candy with 40% sugar solution was shown to contain
Table 2 . The average nutritional composition of final product (Tomato candy with 40% sugar solution) are given below.
7.42% moisture, after 2 months the moisture content was shown to increase to 8.72% and nutrient content was decreased. After 4 month the moisture content was increased to 10.16% and nutrient content was decreased. Similarly after 6 month the moisture content was increased to 10.96% and nutrient content was moderately decreased compare to initial month. Candy with 50% and 60% sugar solution was followed with similar trend of having moderately decreased nutrient content after 6 months of storage.
3.3. Effect of Sugar Solution on Nutritional Composition of Tomato Candy
There was a tendency of decreasing water content with increasing sugar solution used and on the contrary the lower the concentration of sugar solution used the higher the water content was found. At the initial month the moisture content of candy (with 40% sugar solution) was 7.42 and it was decreased accordingly from 7.20 to 7.01 with increasing the sugar concentration from 50% to 60%. From the Table 2, it was also found that at the final month the moisture content of candy with 40% sugar solution was 10.96 and it was decreased accordingly from 10.42 to 9.86 with increasing the sugar concentration from 50% to 60%. There was a tendency that the higher concentration of sugar solution used, the lower ash content and on the contrary the lower the concentration of sugar solution used and the higher the ash content found. At the initial month, the ash content of candy with 40% sugar solution was 1.02 and it was decreased accordingly from 1.00 to 0.76 with increasing the sugar concentration from 50% to 60%. It was also found that at the final month the ash content of candy with 40% sugar solution was 0.90 and it was decreased accordingly from 0.80 to 0.70 with increasing the sugar concentration from 50% to 60%. There was also a tendency that the higher concentration of sugar solution used with lower protein content and on the contrary the lower the concentration of sugar solution used the higher the protein found. At the initial month the protein content of candy with 40% sugar solution was 2.97 and it was decreased accordingly from 2.58 to 2.00 with increasing the sugar concentration from 50% to 60%. It was also found that at the final month the protein content of candy with 40% sugar solution was 2.08 whereas it was found to decrease accordingly from 2.06 to 1.65 with increasing the sugar concentration from 50% to 60%. Fat, Vitamin C, Fiber content and % acidity was also shown to follow the similar trend of decreasing with increased sugar solution used, whereas, total sugar and carbohydrate content was shown to follow the opposite trend of increasing with increasing sugar solution.
3.4. Sensory Characteristics of the Tomato Candy
The score of different sensory characteristics of different candy are shown in Table3 The score given by each panelist for each characteristic and the average score are shown in Table3 It is shown that candy with 40% sugar solution was found of having the highest average score of organoleptic test for flavor, which was of 8.14
Table 3. Mean sensory score of tomato candy with different sugar solutions.
whereas the lowest score of 7.71 was found in candy with 60% sugar solution. It was found that the highest score for color (8.28) was given for candy with 40% sugar solution and the lowest score of 7.85 was given for candy with 60% sugar solution and the highest score for taste (8.71) was given for candy with 40% sugar solution where a score of 7.28 was obtained for candy with 60% sugar solution. The average score indicating that the color, flavor and taste of tomato candy with 40% sugar solution was more acceptable than candy with 50% and 60% sugar. From the table it is shown that, candy with 40% sugar solution was given the highest average score for texture, and softness also than candy with 50% and 60% sugar solution which indicates tomato candy with 40% sugar solution was more acceptable than candy with 50% and 60% sugar.
3.5. Microbial Analysis of Tomato Candy
The total viable bacterial counts for candy samples were shown in Table4 From the results, it was found that the bacterial load on tomato candy with 40% and 50% sugar solution was nil and Candy with 60% sugar solution contained 3 × 101 cfu/g tested after 15 days of preparation. After 6 months of storage candy with 40%, 50% and 60% sugar solution was found to show a bacterial count of 1 × 101, 3 × 101 and 7 × 101 cfu/gm respectively. The total fungal counts of the sample are also shown in Table4 It was found that the fungal counts of candy with 40%, 50% and 60% sugar solution was nil, whereas after 6 months this counts was 2 × 10², 3 × 10² and 6 × 10² cfu/gm respectively. Most probable number (MPN) method with lauryl tryptose sulfate broth (LST) media was used for total coliform count. Total coliform counts were found negative in all candy samples both after 15 days and 6 months of storage (Table 4). This means that candy with 40%, 50% and 60% sugar solution contained no coliform. Staphylococcus aureus counts on candy with 40%, 50% and 60% sugar solution was found nilat the initial and after 6 months the.
4. Discussion
High water content foods are usually susceptible to be easily damaged by microorganisms and especially mold are grown and endanger the health of the consumer [39] . Drying of food can lead to impaired growth of
Table 4 . Total microbial load on tomato candy.
microorganisms [40] . Chemical test results showed that water content in tomato candy from all treatments are still relatively safe as the water content of food permitted for a maximum of 25% (SII 0525-2008). In addition, water content in food or food ingredient may affect the texture, taste, freshness, durability of materials and consumer acceptance. Ash content in tomato candy from all treatments was found relatively safe as the maximum permitted value of ash is of 1.0% [41] . There was a tendency that the higher concentration of sugar solution used, lower the protein content and on the contrary the lower the concentration of sugar solution used the higher the protein content contained in tomato candies. Fruits and vegetables are not ordinarily thought of as a source of lipids, but we find that most of them contain between <1 percent of total lipid, usually listed as fat. Tomato candy was found to have the same percentage of fat. Changes in fat content occur mainly due to oxidation because fats and oils slowly take up oxygen and become rancid when it is stored and ultimately reduced. The higher the concentration of sugar solution is attempted, the lower its vitamin C content. The loss of vitamin C is believed due to a change in the structure of tissue of fruit, the higher the sugar solution is added lead to more water molecules to move (diffuse) out of the material and water to dissolve the vitamin C and ultimately reduce the Vitamin C content [42] . There was a tendency that the higher concentration of sugar solution used, lower the acidity and on the contrary the lower the concentration of sugar solution used the higher the acidity content found in tomato candy. This might be due to the osmotic process which makes water to move out of the food into the solution and leach out the natural solutes (organic acid) from the food into the solution and acidity is ultimately reduced. The existence of crude fiber content comes from the tomato itself, however there was a tendency that the higher concentration of sugar solution used, lower the crude fiber and on the contrary the lower the concentration of sugar solution used the higher the crude fiber content contained. With increasing the concentration of sugar solution, the network of the cell wall changes which increase the progressive dissolution of pectin substances due to the enzyme activity [43] . There is a tendency that the higher concentration of sugar solution used, the higher the sugar found and on the contrary the lower the concentration of sugar solution used lower the sugar content contained in these tomato candies. Because during osmotic process water flow out of the food into the solution with a simultaneous transfer of solute from the solution into the food.
Tomato candies with 40% sugar solution were the most preferred product to the panelists, this might be due to the beautiful or unique flavor of tomatoes were still feels fresh. The higher concentration of sugar replaces the beautiful tomato flavor and the panelists like it less and gave a low value. To give distinctive flavor, synthetic or artificial flavors can be added, although the result does not seem like the taste of the original. Color is one determinant of quality of food products in addition to the nutritional value itself. The visual assessment of color usually comes first, because the color is a view that can attract consumers so that there are many terms of the color of love. In addition, color can be used as an indicator of freshness or maturity [44] . Tomato candy with 40% sugar solution were the most preferred product to the panelists, this is possible because the red color of tomatoes were still beautiful. Red color was still beautiful because immersion of tomato in a solution of sugar, which is not too high, do not damage the tomato flesh tissue in which the pigments or dyes contained therein. Higher concentrations of sugar sometimes create caramelization and turn the products into red with dark red and even black. The final taste of a food products usually also depends on the addition of additive, such as the addition of sugar can provide a sweet taste in food products including confectionery tomato itself. Tomato candy with 40% sugar solution were the most preferred product to the panelists, this is possible because the taste of tomatoes were still pleasant. Higher concentrations of sugar made the candy more sugary which is unpopular with the panelists. Texture is a trait or a physical condition and morphology of agricultural products which includes the level of hardness, tenderness, flexibility, elasticity, roughness and smoothness of materials. Texture usually depends on the with maturity level of the material itself (the fruit) and fruits with low level of maturity has a higher level of hardness compared with fruits that are ripe and texture is more soft or mushy [45] . Tomato candy with 40% sugar solution were the most preferred product to the panelists, this is possible because the texture of tomatoes were still beautiful. This might be due to a variety of treatments of soaking in different sugar solutions. In higher concentration of sugar solution, more sugar molecules enter and the more sugar is retained inside the cells of tomato, causing shrinkage. According to Apandi [43] , the progressive dissolution of pectin substances can occur due to the enzyme activity that causes changes in texture in fruits and vegetables. The existence of a solution of sugar in the material with the lowest sugar concentration of 40% dissolved solids and causes the softer material [46] . Texture in terms of the level of hardness and tenderness materials related to the amount of water content, where the number of high water content in a material of agricultural products will be more tender texture than the low water content [47] . Softness with a lower value means the material harder than the other sample and higher value means the texture is tenderer than the other samples. This is because soaking of material in different sugar solutions. Higher the concentration of sugar solution is attempted, the more sugar molecules that enter and the more sugar is retained inside the cells of tomato fruit, causing the texture of harder where lower the concentration of sugar solution , causing the texture softer. The difference of water flow out and flow of incoming sugar will cause the cell structure and texture of the fruit becomes hard [48] .
5. Conclusion
The different sugar solutions have effects on the characteristics of tomato candy i.e. on moisture, ash, protein, fat, vit-C, acidity, crude fiber, total sugar content and on color, flavor, texture and taste. The best quality of tomato candy was found with 40% sugar solution. We know that the higher the water content is, the tendency of the food is damaged more easily, but candy with 40% sugar solution contains less microorganisms than the other candy. The ash, protein, fat, citric acid, ascorbic acid (Vit-C), crude fiber content of candy with 40% sugar solution was higher than candy with 50% & 60% sugar solution. The total sugar content of candy with 40% sugar solution was lower than candy with 50% & 60% sugar solution and higher sugar content is not desirable for children and diabetic patient. Higher sugar is responsible for dental carriage of young children. On the other hand, the color, flavor, texture and taste of candy with 40% sugar solution were most preferred because the beautiful or unique tomato flavor was still felt; the red color was not broken; the taste was sweet enough and texture was more tender. Higher sugar makes the candy more dark red color; aroma was lost, causing shrinkage of the texture, and made the candy more sugary which is unpopular. This study will help the food producer or the confectionary manufacturer to select the appropriate concentration of sugar solution for making tomato candy and at the same time consumers can reduce the spoilage of tomatoes by preserving them through making tomato candy, which is nutritious.
Acknowledgements
This work was supported in part by the Grant-in-Aid for Scientific Research from Bangladesh Council for Scientific and Industrial Research (BCSIR) and from the Dept. of Applied Nutrition and Food Technology, Islamic University, Kushtia, Bangladesh. The authors are grateful to the Vegetable Technology Research Section of Institute of Food Science & Technology of Bangladesh Council of Scientific and Industrial Research (BCSIR), Dhaka for their continuous support to conduct the research work.
Competing Interest Statement
The authors declare no competing financial interests.
References
- Rismunandar (1984) Tomato Plants Are Versatile. Terate. Bandung [Indonesia].
- Haque, M.S., Islam, M.T. and Rhaman, M. (1999) Studied on the Preservation of Semi-Concentrated Tomato Juice. Bangladesh Journal of Agricultural Science, 26, 37-43.
- FAO (2006) FAO Production Yearbook. 1996. Basic Data Unit, Statistics Division, FAO, Rome, Italy, 55, 125-127.
- Sharfuddin, A.F.M. and Siddque, M.A. (1985) Sabjibagan. Bangladesh Agricultural University, Mymensingh, 32.
- BBS (2006) Statistical Pocket Book. Statistics Division, Ministry of Planning, Government of the People’s Republic of Bangladesh, Dhaka, 58.
- Barman, S.C. (2007) Real Adoption Impact Measure of Tomato Technologies on Production at Farmers’ Level in Bangladesh. Bangladesh Journal of Scientific and Industrial Research, 42, 15-28. http://dx.doi.org/10.3329/bjsir.v42i1.351
- Lazarus, S.A., Bowen, K. and Garg, M.L. (2004) Tomato Juice and Platelet Aggregation in Type 2 Diabetes. The Journal of the American Medical Association, 292, 805 -806. http://dx.doi.org/10.1001/jama.292.7.805
- Rao, A.V. and Agarwal, S. (2000) Role of Antioxidant Lycopene in Cancer and Heart Disease. Journal of the American College of Nutrition, 19, 563-569. http://dx.doi.org/10.1080/07315724.2000.10718953
- Rao, A.V. and Rao, L.G. (2007) Carotenoids and Human Health. Pharmacological Research, 55, 207-216. http://dx.doi.org/10.1016/j.phrs.2007.01.012
- Kohlmeier, L., Kark, J.D., Gomez-Gracia, E., Martin, B.C., Steck, S.E., Kardinaal, A.F., Ringstad, J., Thamm, M., Masaev, V., Riemersma, R., Martin-Moreno, J.M., Huttunen, J.K. and Kok, F.J. (1997) Lycopene and Myocardial Infarction Risk in the EURAMIC Study. American Journal of Epidemiology, 146, 618-626. http://dx.doi.org/10.1093/oxfordjournals.aje.a009327
- Friedman, M. (2013) Anticarcinogenic, Cardioprotective, and Other Health Benefits of Tomato Compounds Lycopene, α-Tomatine, and Tomatidine in Pure Form and in Fresh and Processed Tomatoes. Journal of Agricultural and Food Chemistry, 61, 9534-9550. http://dx.doi.org/10.1021/jf402654e
- Khan, M.R. (2012) Osmotic Dehydration Technique for Fruits Preservation—A Review. Pakistan Journal of Food Science, 22, 71-85.
- Torres, J.D., Talens, P. and Escriche, I.A. (2006) Chiralt Influence of Process Conditions on Mechanical Properties of Osmotically Dehydrated Mango. Journal of Food Engineering, 74, 240-246. http://dx.doi.org/10.1016/j.jfoodeng.2005.03.017
- Marani, C.M., Agnelli, M.E. and Mascheroni, R.H. (2007) Osmo-Frozen Fruits: Mass Transfer and Quality Evaluation. Journal of Food Engineering, 79, 1122-1130. http://dx.doi.org/10.1016/j.jfoodeng.2006.03.022
- USDA (1991) US Standards for Grades of Fresh Tomatoes. USDA, Agricultural Marketing Service, Washington DC.
- AOAC (1995) Official Methods of Analysis: Official Method for Moisture. Method No. 925.10. Association of Official Analytical Chemists, Washington DC.
- AOAC (2000) Official Methods of Analysis: Official Method for Ash. Method No. 936.03. Association of Official Analytical Chemists, Washington DC.
- AOAC (1995) Official Methods of Analysis: Official Method for Protein. Method No. 920.87. Association of Official Analytical Chemists, Washington DC.
- Dubois, M., Gilles, K.A., Hamilton, J.K., Rebers, P.A. and Smith, F. (1956) Colorimetric Method for Determination of Sugars and Related Substances. Analytical Chemistry, 28, 350-356. http://dx.doi.org/10.1021/ac60111a017
- Krishnaveni, S., Balasubramanian, T. and Sadasivam, S. (1984) Sugar Distribution in Sweet Stalk Sorghum. Food Chemistry, 15, 229-232. http://dx.doi.org/10.1016/0308-8146(84)90007-4
- Ranganan (1991) Handbook of Analysis and Quality Control. Lane and Eynon Method for Total Sugar Determination. 12-15.
- AOAC (1995) Official Methods of Analysis: Official Method for Fat Extraction. Method No. 920.85. Association of Official Analytical Chemists, Washington DC.
- AOAC (1995) Official Methods of Analysis: Official Method for Crude Fibre. Method No. 920.85. Association of Official Analytical Chemists, Washington DC.
- AOAC (1980) Official Methods of Analysis. 13th Edition, Association Official Analytical Chemists, Washington DC.
- Moreira, M.R., Roura, S. and de Valle, C. (2003) Quality of Swiss Chard Produced by Conventional and Organic Methods. LWT, Food Science and Technology, 36, 135-141. http://dx.doi.org/10.1016/S0023-6438(02)00207-4
- Bruce, R.D., Arcy, G.H. and Bentley, I. (2006) Food Chemistry A Practical Manual. (A University of Queensland Publication 2006, Copyright © 2006 by The University of Queensland All Rights Reserved) 2006, p. 41.
- AOAC (2007) Official Methods of Analysis. 19th Edition, Association of Official Analytical Chemists, Arlington.
- Hillery, B.R., Elkins, E.R., Warner, C.R., Daniels, D., Fazio, T., Balazs, P., Bosquez, M.H., Chaddha, R., Cordes, S., Couture, K., et al. (1989) Optimized MonierWilliams Method for Determination of Sulfites in Foods: Collaborative Study. Journal of Association of Official and Annual Chemistry, 72, 470-475.
- Rastogi, N.K., Raghavarao, K.S.M.S. and Niranjan, K. (2005) Developments in Osmotic Dehydration. Emerging Technologies for Food Processing. p. 221.
- Edeoga, H.O., Okwu, D.E. and Mbaebie, B.O. (2003) Minerals and Nutritive Value of Some Nigerian Medicinal Plants. Journal of Medicinal and Aromatic Plant Science, 25, 1010-1015.
- Badau, M.H., Adeniran, A.M. and Nkama, I. (2001) Fungi Associated with Various Fresh Meats Sold in Maiduguri Market, Nigeria. Journal of Pure and Applied Science, 4, 255-262.
- Badau, M.H., Adeniran, A.M., Nkama, I. and Baba, S.S. (1999) Bacteriological Quality of Various Fresh Meats Sold in Maiduguri Market, Nigeria. Journal of Arid Agriculture, 9, 133-141.
- Mosupye, F.M. and Von Holy, A. (1999) Microbiological Quality and Safety of Ready-to-Eat Street-Vended Foods; Johannesburg, South Africa. Journal for Food Production, 62, 1278-1284.
- Mudgil, S., Aggarwal, D. and Ganguli, A. (2004) Microbiological Analysis of Street Vended Fresh Squeezed Carrot and Kinnow-Mandarin Juices in Patiala City, India. Internet Journal of Food Safety, 3, 1-3.
- Lancette, G.A. and Bennett, R.W. (2001) Staphylococcus Aureus and Staphylococcal Enterotoxins. In: Downes, F.P. and Ito, K., Eds., Compendium of Methods for the Microbiological Examination of Foods, 4 Edition, APHA, Washington DC, 387-403.
- Harrigen, Ν.F. and MacCance, Μ.Ε. (1976) Laboratory Methods in Food and Diary Microbiology. Academic Press, New York and London, p. 132, 142, 258.
- Speck, Μ.L. (1976) Compendium of Methods for the Microbiological Examination of Foods. American Public Health Association Inc., New York.
- Larmond, E. (1977) Laboratory Methods for Sensory Evaluation of Foods. Research Branch, Canada Department of Agriculture, Publication No.1637.
- Fellows, P. and Hampton, A. (1992) Small-Scale Food Processing. A Guide to Appropriate Equipment. Intermediate Technology Publications, London, 7, 155-156.
- Kolawole, O.M., Adeyemi, B.J., Kayode, R.M.O. and Ajibola, T.B. (2009) The Drying Effect of Colour Light Frequencies on the Nutrient and Microbial Composition of Cassava. African Journal of Agricultural Research, 4, 171-177.
- Winarno, F.G. (1981) “Food Additives” Safe for Us? Collection and the Idea of Writing 1978-1981. Research and Development Center for Food Technology. Bogor Agricultural University, Bogor.
- Hui, Y.H., Barta, J., Cano, M.P., Gusek, T., Sidhun, J.S. and Sinha, N.K. (2006) Handbook of Fruits and Fruit Processing. Blackwell, Ames. http://dx.doi.org/10.1002/9780470277737
- Apandi, M. (1994) Technology of Fruit and Vegetables. Terate, Bandung.
- Winarno, F.G. (1997) Food Chemistry and Nutrition. Gramedia, Jakarta.
- Baedowi (1980) Knowledge of Agricultural Produce (PBHP) Directorate of Vocational High Schools, Department of Education and Culture, Jakarta.
- Purnomo, H. (1995) Water Activity and Its Role in Food Preservation. UI Press, Jakarta.
- Winarno, F.G. (1990) Fermentation Technology. Project Development Joint Facility, Inter-University Center for Food and Nutrition, Gadjah Mada University, Yogyakarta.
- Apriyantono, T. (2000) Practical Guide Making Sweets, Small Specialist Food Processing Industry. Director General of Small Industry, Ministry of Agriculture, Jakarta.
NOTES

*Corresponding author.