Food and Nutrition Sciences
Vol.5 No.2(2014), Article ID:42184,6 pages DOI:10.4236/fns.2014.52025
Comparison of Physicochemical, Organoleptic and Nutritional Abilities of Eight Sweet Potato (Ipomoea batatas) Varieties
Department of Research and Development, Pôle Agroalimentaire Régional de Martinique, Lamentin, Martinique, France.
Email: *adenet@parm.asso.fr
Received October 18th, 2013; revised November 18th, 2013; accepted November 25th, 2013
ABSTRACT
In Martinique (F.W.I.), biodiversity of vegetable varieties remain unexploited due to public unawareness or supply problems. To further enhance the sweet potato, physicochemical, sensory and nutritional characteristics of eight varieties of sweet potato were established. The eight sweet potatoes cultivars were noticeably diverse with phenotypic, sensory, physicochemical and nutritional characteristics which were very varied. The eight cultivars grown in Martinique were advantageously positioned in relation to the globally identified sweet potato, regarding fibre, starch, potassium, copper, vitamin B1, B3 and B9 contents. Compared to the ordinary potato, Martiniquan sweet potatoes have a much better nutritional potential. Energy value and vitamin C levels were twice as much as in normal potatoes. Martiniquan sweet potatoes cultivars were also richer in minerals and vitamins, with 2.7 times more vitamin B9 and 63 times more beta-carotene than the ordinary potato.
Keywords:Sweet Potato; Ipomoea batatas Variety; Physicochemical Characteristics; Nutritional Characteristics; Sensory Profile
1. Introduction
The sweet potato is a perennial plant but treated as an annual in agriculture and farming. Creeping stems are thin and can reach up to 4 m long. The size and shape of leaves are extremely variable. The plants foliage ground covers, whilst underground roots transform into tubers. These fully grow underground [1,2].
The sweet potato is native to Central and South America, but found worldwide in tropical and subtropical climates. It is a plant that requires minimal cultivable supervision. It is grown all year round, reaching full maturity in four months, depending on the variety. Harvesting usually takes place when leaves turn yellow [1,3-6]. Multiplication of plant is carried out either by transplanting or planting cut tubers stems.
The International Potato Center (CIP) recorded from 1895 to 2000 more than 6500 varieties or cultivars including accessions “wild” varieties and selected varieties [7]. In a publication entitled “Descriptors for Sweet Potato” [8], CIP, AVRDC (Asian Centre for Research and Development of Vegetables) and IBPGR (International Plant Genetic Resources Institute) provide a descriptors list in order to characterize the sweet potatoes. This publication contains the tools to identify, characterize and assess the sweet potato. It includes two sections: 1) identifications of the origins of the cultivars (donor, genus, species, name...), specifications of planting sites (country, location, geographic coordinates, altitude...) and cropping systems (sowing date, harvest date, taxonomy of soil, irrigation...); 2) the second section qualifies and evaluates the plant: morphology, tubers (morphological, physicochemical, nutritional, cooking skills) and flowering. This evaluation is performed using a scale ranging from 0 to 9. In his book “Sweet Potato”, L. Degras [9] refers to this document to describe the morphological variation between different cultivars of sweet potato. The tuber has a very variable shape, but for a given cultivar, it still presents a characteristic appearance. However, it lies in wet soil and deforms due to ground and parasite attacks. Tubers skins are smooth to rough, finely granular with a rarely scaly or ridged surface. Emission point’s rootlets may exist. Colour is generally uniform, with blended and various shades of white, light-pink, dark-purple, red and cream, orange-brown and yellow. Its flesh is homogeneous, although may have diffusions of a secondary colour, which corresponds to the colouration of the skin. Leaves are also variegated with different degrees of yellow and purple. Differences of leaf shape in adults tubers characterized the plants varietal.
Sweet potatoes also react differently when cooked (soft or firm varieties, colour after cooking). They may be more or less rich in starch, sugars, dextrins, anthocyane and carotene [3-5,10]. Some varieties are listed and identified on an international level, including in the United States by American firms: Beauregard, Centennial, Regal, Georgia Jet, Golden, Jewel and Red Garnet (the closest varieties of skin red/purple orange flesh varieties of Martinique, F.W.I.).
Sweet potatoes tubers clearly seem to have a high technological potential. Globally, all components of the plant are valued and used in many processed products [5,10]. For instance, stems and leaves are used as fresh vegetables and fodder, underground stems as fodder, and fermentation products (wine, liquor, vinegar), sugar production and tubers may be baked, fried, canned, used as desserts, pastries, biscuits, flour, pasta, alcohol (ethanol), sugar or starch.
In Martinique (F.W.I.), the sweet potato is used in several ways: cook (water or steam), puree, jam, flour and crisps. It also enters into the composition of cakes and bread in the form of puree and flour respectively [11]. At the post-harvest, it was established that the tubers were retained best when kept around 29˚C and 85% humidity for 4 to 20 days [9]. These storage conditions can optimize healing after harvesting. This storage however leads to changes in the chemical composition of the tuber. Thus, after healing, sugar content is increased, primarily in sucrose, and starch content decreases. These variations are amplified during cooking. Sweet potato also has an advantage at the primary processing yield, trimming high, between 70% and 90% [12,13]. Degras [9] reported that chemical and nutritional changes may occur during the cooking of sweet potatoes. Colour may fade by dilution of anthocyanins in the cooking water. For the white to orange flesh stains more, the cream flesh may turn yellow or even grey or greenish. These changes are due to the degradation of carotenoids.
Sweet potatoes are a good source of energy with an abundance of protein, fibre and minerals as potassium. They are rich in starch, which represents more than 50% of the carbohydrate components. Seasons, crop management and localities affect the starch content. For example, a water deficit during growth reduces the content [9]. During storage, the starch content decreases due to its conversion into sugars. Sugars variations are important between varieties and even within the same cultivar depending on the stage of maturation. Sucrose is usually predominant and is mainly accompanied by fructose and glucose. However, the sweet potato has a low glycemic index, about 50 [14,15] making it a suitable food for diabetic or overweight people. Sweet potatoes are extremely rich in vitamin A and in particular in carotenoids; one of the major constituents is β-carotene. Total carotenoids range from trace to above 9 mg/100g [16]. Anthocyanins, numerous in purple or dark purple varieties, are diluted in the large tubers from the periphery to the centre [17]. Carotenoids are responsible for the orange to cream colour. The colour intensity is correlated with the content of β-carotene [16]. Potassium is the most plentiful mineral and such as anthocyanins [18], its concentration decreases are close to the centre.
We decided to study the physicochemical and nutritional properties of different sweet potatoes cultivars grown in Martinique. We wanted to compare the quality of these different cultivars selected in order to promote their production and create consumer awareness. This study is therefore an evaluation of sweet potatoes characteristics, and focuses on: 1) a phenotypic comparison of the cultivars, 2) a sensorial analysis of the eight sweet potatoes, 3) the physicochemical and nutritional characteristics of these eight tubers 4) and a statistical comparison of the eight sweet potatoes varieties.
2. Materials and Method
2.1. Plant Material
Eight varieties selected are representative of the varieties found in Martinique. A minimum of 30 tubers were collected from each variety of sweet potatoes. The experimental sample was representative of the population. A set of physical parameters was recorded on each tuber (size and weight). They were then cleaned, peeled, cut into pieces and steamed. Physicochemical analyses were carried out on a cooked slice (texture, colour) or on a crushed cooked pulp (energy, fibres, starch, polyphenols, sugars, minerals and vitamin C contents).
2.2. Morphology and Composition of Sweet Potato@NolistTemp# 1) Morphological and physical characterizationThe proximate analyses of cultivar size were carried out using a caliper for fruit length and width and a precision balance for sweet potato weight (Shimadzu UW4200 HV).
Texture parameters were measured with a LLOYD Instruments TA plus texture analyser, using a piston 4 mm in diameter and a 30 mm/min speed.
Tubers colours were determined with a Minolta CR- 200 chromameter using the 3 parameters (L*, a*, b) established by the International Commission on Illumination: “L” for lightness to distinguish light colours from dark colours, “a” used to classify red to green colours, and “b” used to classify yellow to blue colours.
2) Physicochemical characterization of the tuberpH. About 25 g of flesh (cooked or not) was blended with about 250 ml deionised water (10% w/w) for 30 min using a magnetic stirrer. The pH of the blended solution was determined at ambient temperature with a Sentix 81 (WTW) probe.
Dry Matter content (DM). Flesh samples (2 g of crushed, homogenized flesh) were collected from each sweet potato for DM determination in triplicate, using a ventilated oven at 70˚C for 5 hours at reduced pressure (−1 bar).
Starch Content. The starch content was measured using the the K-TSTA 11/05 Megazyme enzymatic kit (Megazyme, Wicklow, Ireland). The samples were crushed cooked flesh. The absorbance at 334 nm, proportional to the amount of glucose released by the hydrolysis of starch, was read using a spectrophotometer (JENWAY 7305).
Polyphenol Content. Total polyphenols were determined using Folin and Ciocalteu’s method described in Georgé et al. 2005 [19]. Only the measure of raw extracts was considered.
Ash Content. Sweet potato ash content was calculated from a crushed sample (1 g) following heating to 525˚C for 5 h as per the AOAC official method 923.03 (1996).
Lipid Content. Lipids were extracted from the sample (2 g) after acid hydrolysis with 50 ml of 8 N HCl, at 80˚C. The mixture was filtered and rinsed with boiling water until neutral pH. The filters were dried. The residues were placed in glass cartridges with 140 ml petroleum benzene and some pumice stones to extract the lipids in a Soxtherm extractor (Gerhardt Laboratory Systems, Königswinter, Germany). After extraction, the cartridges were oven dried at 101˚C.
Protein Content. The protein content was determined through the quantification of total nitrogen using Kjeldahll’s method. After mineralization of the sample (2 g) in 25 ml of 95% H2SO4 in the presence of a catalyst in a Turbotherm mineralizator (Gerhardt Laboratory Systems, Königswinter, Germany). The mineralizate was distilled, in the presence of soda, in a Vapodest distiller (Gerhardt Laboratory Systems, Königswinter, Germany). The distillate was collected in 40 ml of boric acid 40 g.l-1 in the presence of some drops of Tashiro’s indicator. The distillate was titrated by hydrochloric acid HCl (0.1 N).
Carbohydrate Content. This was obtained by finding the difference (dry extract – (ash + lipids + proteins)). Carbohydrates represent the total fibre, starch and sugars content.
Energy Value. Energy value was determined by adding lipid, carbohydrate and protein contents.
Fibre Content. Fibre contents were determined with the AOAC 985.29 method.
K, Cu and Mn. Sweet potato samples were incinerated and ashes were put in chlorhydric acid solution. K, Cu and Mn rates were determined by atomic absorption spectrometry respectively at 766.5, 324.8 and 279.5 nm.
Glucose, Fructose and Sucrose. Sugar content was determined using the K-SURFG 12/05 Megazyme enzymatic kit) (Megazyme, Wicklow, Ireland). Sugars were extracted from dried samples by homogenizing and boiling in 80% ethanol. After centrifugation, the ethanol extract containing free sugars was kept at −20˚C until sugar analysis was performed according to the manual.
Enzymology. Measures were done on raw and cooked sweet potato. 2 g of sample were dissolved in 0.5 mM ascorbic acid, 1 M NaCl. Peroxidases reacted with gaiacol 55 mM and its enzymatic activity was measured by absorption spectrometry at 470 nm every second for 20 seconds using a spectrophotometer (JENWAY 7305). 2 g of sample were dissolved in 0.18 mM citric acid, 16 mM Na2HPO4, PVPP 10%. Polyphenoloxidase reacted with catechol and its enzymatic activity was measured by absorption spectrometry at 400 nm every second for 30 seconds using a spectrophotometer (JENWAY 7305).
β-carotene of samples were extracted with a ternary mixture of solvent (hexane/acetone/ethanol, 50/25/25). Analysis is performed by HPLC/DAD (AGILENT 1100).
Total Carotenoid. Samples were extracted with a ternary solvent (hexane) and the absorbance at 450 nm was determined using a spectrophotometer (JENWAY 7305).
Vitamins. Vitamin C was measured using the K-ASCO 11/05 Megazyme kit. This is a colourimetric method and the absorbance at 578 nm was read using a spectrophotometer (JENWAY 7305). Vitamin B1 was determined with the EN 14122 method. Vitamin B2 was determined with the EN 14152 method. Vitamin B5 was determined with the AOAC 945.74/42.2.05 method. Vitamin B6 was determined with the EN 14164 method. Vitamin B9 was determined with the AOAC 944.12/ 45.2.03 method. Vitamin PP was determined with the AOAC 944.13/45.2.04 method.
2.3. Sensorial Analyses
Sweet potato samples were cleaned, peeled, bleached and placed in plastic bags. They were frozen and warmed just before the sensorial analyses. For the profile analysis, selection of panel members began with twelve inexperienced individuals. Five 2-h training sessions were carried out until they were able to recognize and rate the characteristics of different sweet potatoes varieties according to the AFNOR 8586-1 and 8586-2 standards. Fifteen attributes represented the sensory profile according to AFNOR 13299 standard. Significant differences (p < 0.05) were found for the fifteen sensory features. Homogeneity in the group was also tested by two-way analyses of variance for each attribute, and the training was considered to be concluded when no panelists × samples interaction was found. Variance analyses (ANOVA) were done with FIZZÒ 2005 v1.0, UNIWIN PlusÒ 2005 v6.1 and StatGraphics CENTURIONÒ XV 2005 software with a confidence interval of 5%.
2.4. Data Statistical Analyses
The physical and chemical mean values of triplicate measurements or analysis were statistically analysed. Analysis of variance (ANOVA) based on Student Test, Principal Component Analysis (PCA) and Duncans multiple range test (DMRT) were performed using the software StatGraphics CENTURIONÒ XV 2005 and Uniwin PLUSÒ 2005 v6.1.
3. Results
3.1. Sweet Potatoes Phenotypic Aspect
Eight cultivars of sweet potatoes were grown on the same plot, and in the same agro-climatic conditions. This study was carried out with two batches, the first harvested in 2009 and the second in 2011. Cropping system data, provided for each cultivar using a delivery sheet, supplied by the local agricultural department of Martinique, are summarized in Table1 Varieties were harvested after a four to five month cycle. Cycle times achieved here are in accordance with the practices described in articles [3,5,6]. Table 2 shows the phenotypic characteristics of the eight cultivars of sweet potato. These descriptions were realized according to Huaman 1991. CAM/09/006 is the only one to present a small vegetative development. CAM/09/002 development is average while for the other 6 cultivars it is important. At the aerial part, the cultivars have formed different shaped leaves, more or less elongated, broader or pointed. Tuber shapes are also very different. All these characteristics will allow classifying the cultivars in the gender Ipomoea batatas.
Phenotypic differences in tubers are also observed among cultivars (colour and texture of the skin, flesh colour, tuber shape, Table 2). Tubers also modify during cooking. Flesh colour varies in the cultivars, from white, purple through to salmon. The CAM/09/004 cultivar has a peculiarity with the presence of small purple spots in the central position of the tuber visible when cutting. When cut, the flesh was observed as rather white. The specificity of this sweet potato could have a favourable impact on consumers. CAM/11/008 cultivar also has a flesh coloured, dark purple remarkably. This feature can also impact on consumer reviews. The colour of the skin is mainly purple for each cultivar. The difference lies mainly in the texture and thickness thereof. Only the CAM/11/006 cultivar has a clear skin colour in shades of beige. After cooking, there is a systematic loss of skin colour when not completely detached from the wafer. Significant changes in the flesh were also noticed, especially for CAM/09/02 cultivar which changes colour from salmon to deep orange. For other cultivars, the colour beCAMe duller and darker.

Table 1. Cropping system data of the eight sweet potatoes studied.
Table 2. Phenotypic characteristics of eight cultivars of sweet potato.
3.2. Sensorial Analysis
A sensorial analysis was done with the eight sweet potatoes. Twelve descriptors were selected. Table 3 shows the results with the average scores for these descriptors. The statistical analysis (analysis of variance, Duncan test) of these data revealed that 7 of the 12 descriptors evaluated were significant.
For the criteria evaluated, such as the criteria olfactory, bitter taste, the compact and firm texture in the mouth, no significant difference was found between the eight cultivars of sweet potato. They had specific odours, similar bitterness and firm mouth feel. They also had a compact appearance, (score > 4.5/7) and a moderately fibrous texture, a uniform colour, an overall marked odour with a very intense earthy note.
Figure 1 represents the scoring averages of the sensorial analysis. Sweet potato CAM/09/002 differed significantly from the other seven cultivars, with a more homogeneous colour on the side and a slightly pasty mouthfeel. The cultivar CAM/09/001 was statistically comparable to CAM/09/002, both cultivars being in the same statistical groups, with the exception of the homogeneity of colour and pasty mouthfeel. CAM/09/001 cultivar had the distinction of having a very homogeneous visual. CAM/09/004 cultivar was characterized by a significant non-homogeneous and non-fibrous visual appearance. Sweet potato CAM/09/005 differed from other cultivars by its non-fibrous appearance, an overall and slighty intense sweet taste and a more melting and grainy mouthfeel. In contrast, sweet potato CAM/09/006 was distinguished by its slight melting and grainy mouthfeel. CAM/11/006 cultivar was distinguished from other cultivars by its intense overall sweet taste and more creamy and pasty mouthfeel. Sweet potato CAM/11/007 was statistically comparable to CAM/11/006 with an intense sweet flavour and a more melting and pasty mouthfeel. Finally, the sweet potato CAM/11/008 was statistically comparable to CAM/11/006 and CAM/11/007 (intense overall taste and melting and pasty more mouthfeel), with a specificity on the visual aspect significantly more fibrous.
3.3. Technological Abilities
The caliber of the eight cultivars was determined and data are presented in Table4 An analysis of variance (ANOVA) was performed on the data obtained to highlight the features and significant caliber differences observed for each sample. Analysis of the results revealed that only one parameter out of three measured was significant. This is the diameter for which there was a statistically significant 5% difference between samples. Multiple range tests (minimum significant difference method
Table 3 . Average scores for the descriptors in the sensorial analysis. All scores were out of 7.
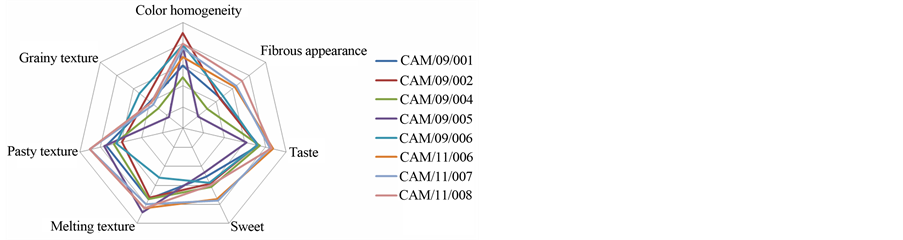
Figure 1. Sensorial cartography with the analysis scoring averages (only significant descriptors, p < 0.05).
Table 4. Average caliber data for the eight sweet potatoes.
of Fisher, 95% confidence level) brought out four groups. Cultivars CAM/11/007, CAM/09/006 and CAM/11/006 had the smallest diameter and were significantly narrower than CAM/11/008. CAM/11/008 was distinguished by a larger diameter but belonged to the same statistical group as CAM/09/002 and CAM/09/005. CAM/09/001 and CAM/09/004 were in an intermediate position.
Texture analyses were performed on cooked slices of the eight sweet potato samples. The results of the five texture parameters studied are presented in Table5 An analysis of variance (ANOVA) was performed to highlight the characteristics and significant texture differences observed for each sample. This analysis revealed that the five texture parameters evaluated were significant for the variety effect.
CAM/09/005 differed from other cultivars by the highest cohesion and chewiness. It belongs to the same statistical group as CAM/09/004 for hardness and held the most important value. As for elasticity, it also held the highest value and did not present significant differences with CAM/09/006 and CAM/11/007 cultivars. It belongs to the latter statistical group only for the tensile strength for which CAM/11/008 had the highest value. Conversely, CAM/09/002 presented the lowest values for all parameters. It is opposed to CAM/09/005 except for the tensile strength.
The colour of a product according to the parameters L × a × b result of positioning the intersection of these three parameters in three-dimensional space. The measured values for the characterization of eight varieties of sweet potato are presented in Table5 This analysis was performed on cooked slices of the eight sweet potato cultivars. An analysis of variance (ANOVA) was performed to underscore the features and statistical differences in colour observed for each sample. This analysis revealed that the three colour parameters were significant
Table 5 . Texture and colour analyses of the eight sweet potatoes.
(5%) for the variety effect. CAM/09/001 cultivar was moderately brighter. It was characterized by a less intense saturation and a more intense tint. The CAM/09/002 cultivar was distinguished from CAM/09/001 by a lower brightness and higher saturation. Visually this cultivar had a rather orange tint while CAM/09/001 was yellow. The cultivar CAM/11/006 was the brightest. CAM/11/008 cultivar was distinguished from other varieties by a lower brightness, a less intense colour and higher saturation. Its purple colour made this cultivar specificity.
3.4. Nutritional Characteristics
Table 6 shows the nutritional composition of the eight cultivars. The eight cultivars had higher energy values than the sweet potato studied globally (96.99 kcal/100g on average, Table 7). CAM/09/005 was the least caloric with 113.9 kcal/100g. CAM/11/007 and CAM/09/006 were the most caloric with an energy value with respectively 150.6 and 151.6 kcal/100g. CAM/09/001 and CAM/09/002 were in an intermediate position. CAM/09/ 004, CAM/11/008 and CAM/11/006 were also in an intermediate position but were more caloric than CAM/09/ 001 and CAM/09/002.
Carbohydrate contents of the eight cultivars were similar (mean 31.66 ± 2.97 g/100g). CAM/09/005 had nevertheless the lowest carbohydrate contents. Carbohydrate contents of these eight cultivars were slightly higher (<1.5 times) than that of sweet potatoes studied globally (21.56 g/100g on average).
The starch content of the variety CAM/09/001 was highest with 31 g/100g. The values obtained for the other cultivars were close and between 20 and 24.5 g/100g.
Sweet potato cultivars studied can be divided into four groups for dry matter. CAM/09/005 had the lowest content with 29.6%. CAM/11/007 and CAM/09/006 had the highest contents with respectively 38.5% and 39.3%. CAM/09/001 and CAM/09/002 were in an intermediate position. CAM/09/004, CAM/11/008 and CAM/11/006 were also in an intermediate position, but with higher contents than CAM/09/001 and CAM/09/002. The dry matter content of the 8 varieties of sweet potato was slightly higher than that of sweet potatoes studied globally (26% on average).
All cultivars studied were rich in fibre with contents between 3.3 and 5.4 g/100g. CAM/11/008, CAM/09/005 and CAM/09/001 had the highest contents. CAM/11/006 was the least rich in fibre. CAM/09/002, CAM/09/004 and CAM/11/007 had fibre contents close to 4 g/100g. Cultivars studied here were about 1.5 richer in fibre than sweet potatoes globally studied.
The cultivar CAM/09/002 contained total carotenoid contents significantly higher than the other cultivars. This content could be correlated with the colour of the sweet potato. Indeed, CAM/09/002 cultivar had the most intense orange colour. Sweet potato CAM/09/006 was in second place with a content 1.7 times smaller. Cultivars CAM/11/006, CAM/11/007 and CAM/11/008 had the lowest contents of total carotenoid. CAM/11/006 and CAM/11/007 had rather whitish colour. CAM/09/001, CAM/09/004 and CAM/09/005 were in an intermediate position.
All cultivars of sweet potatoes had polyphenols contents exceeding 76.00 mg/100g and an average value of 119.09 mg/100g. Three groups can be distinguished. With values between 76.00 and 88.90 mg/100g, cultivars CAM/09/005, CAM/11/006, CAM09/004 and CAM/09/ 001 were less rich in total polyphenols. CAM/11/008 was the cultivar that had the highest content of total polyphenols with 256.85 mg/100g, purple colour indicating a high content of anthocyanins (Hagenimana et al., 1999). CAM/09/002, CAM/09/006 and CAM/11/007 were in middle position with total polyphenols contents relatives with respectively 115.70, 109.15 and 133.15 mg/100g.
CAM/09/002 cultivar had the highest β-carotene content and the brightest orange colour. Varieties CAM/09/
Table 6. Nutritional composition of the eight sweet potatoes.
001 and CAM/09/006 were yellow coloured and had lower β-carotene content than other cultivars. Other grey coloured varieties did not contain any β-carotene. The cultivar CAM/11/008 also did not contain β-carotene. Its characteristic purple colour was attributed to its anthocyanins content.
CAM/09/002 had the highest content of vitamin C. A 100 g portion covered 48% of the recommended daily allowance (RDA) of the World Health Organisation [20]. This variety could be enhanced by the claim “very rich in vitamin C”. CAM/09/004, CAM/09/001 and CAM/09/ 006 were in middle position and cover respectively 35%, 34% and 30% of the recommended daily allowance. They were also rich in vitamin C. CAM/11/006 and
Table 7 . Comparison between the average nutritional composition of the eight sweet potato cultivars studied here, and the average sweet potato globally studied.
CAM/11/008 held lower contents of vitamin C. A portion of 100 g covered respectively 7% and 9% of the recommended daily allowance.
The cultivar CAM/09/001 was richer in vitamins B1 and B9. A portion of 100 g covered respectively 21% and 24% of the RDA of vitamin B1 and B9. CAM/09/001 was a source of vitamin B1 and B9. CAM/11/006 cultivar was the richer in vitamin B6 (11% RDA). Other varieties cover less than 8% of the RDA. CAM/09/002 was the poorest in vitamin B1, CAM/09/005 and CAM/11/008 were the poorest in vitamin B6 and CAM/11/008 the poorest in folate. The eight sweet potato varieties studied here had low vitamin B2 contents. Only CAM/09/002 cultivar covered 6% of the RDA. The eight varieties niacin contents were relatively low. Indeed, CAM/09/006 which had the highest content covers only 12% of the RDA. CAM/09/001 was in an intermediate position. The lower contents were for CAM/11/006, CAM/11/007 and CAM/11/08. CAM/09/005 had the highest content of vitamin B5 with 0.836 mg/100g. CAM/09/001 and CAM/ 09/004 had values 2 times less important than CAM/09/ 005, with respectively 0.427 and 0.464 mg/100g. CAM/ 09/002, CAM/09/006 and CAM/11/007 were in middle position with respectively 0.581, 0.549 and 0.619 mg/ 100g.
With potassium content higher than 669 mg/100g, the variety CAM/09/006 was the richest. Variety CAM/11/ 006 contained the lowest potassium content. It was followed by the variety CAM/11/008. Other cultivars were in middle position.
For copper contents, varieties CAM/09/001, CAM/09/ 002 and CAM/09/005 had similar contents. Varieties CAM/09/004 and CAM/09/006 were richer in copper with contents higher than 0.30 mg/100g. There was no copper in the CAM/11/007 cultivar.
The manganese contents of the eight varieties of sweet potatoes were relatively low. With contents lower than 0.30 mg/100g, they covered less than 11% of the RDA. The highest manganese content was that of the variety CAM09/001 (0.21 mg/100g). CAM/09/002 and CAM/09/ 006 had the lowest contents.
3.5. Comparison of the Eight Sweet Potatoes
We wanted to visualize the positioning of each cultivar from each other at sensory, nutritional, physicochemical and technological levels. Hierarchical Classification
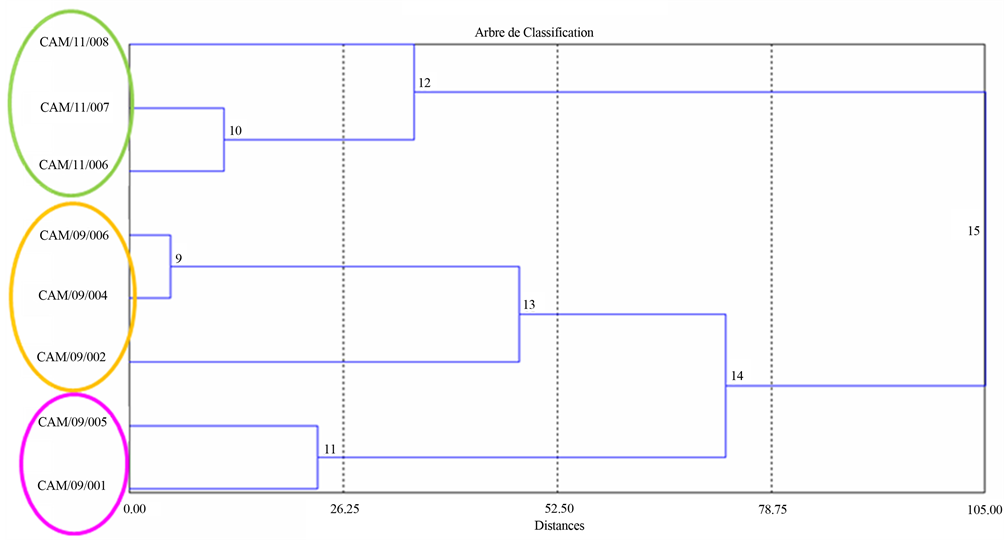
(AHC) provides the following dendrogram establishing the classification of the eight cultivars of sweet potato and highlighting the organoleptic groups (Figure 2(a)). The statistical treatment of all results by CAH allowed classifying the eight cultivars of sweet potato into 3 groups. CAM/09/005 is isolated in a statistical group, which differs from the other seven cultivars. CAM/09/ 001, CAM/09/002, CAM/09/004 and CAM/09/006 are
 (a)
(a)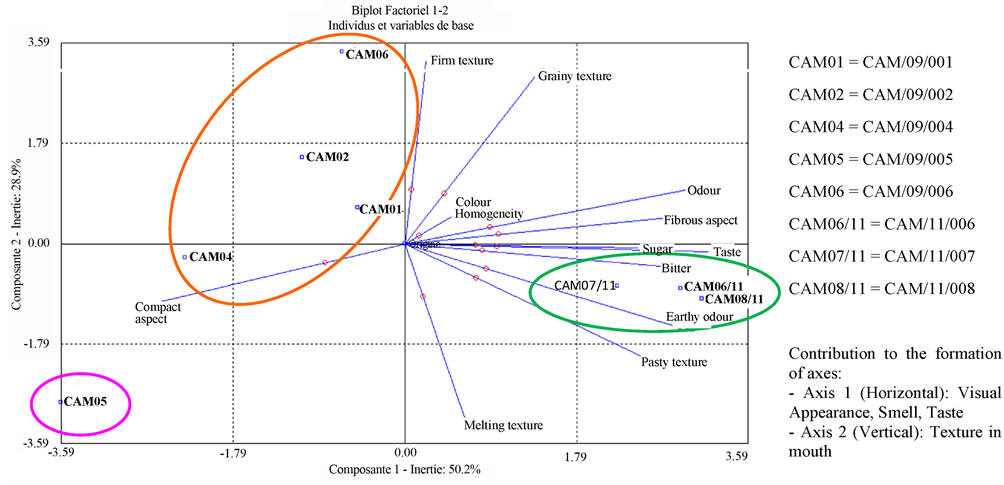 (b)
(b)
Figure 2. (a) Sensorial data dendogram of the eight sweet potatoes varieties; (b) Sensorial data biplot of the eight varieties of sweet potatoes.
grouped in the second statistical group. CAM/11/006, CAM/11/007 and CAM/11/008 are assembled in the third statistical group. Overall, the CAH confirms the findings of the analysis of variance on the effect of visual criteria and mouthfeel of cultivars on the organoleptic characteristics of sweet potato cultivars. It is however important to note that the third group also included cultivars that have been steamed unlike the other five samples. This may in part explain the formation of the third class, in addition to the specific organoleptic statistically identified for these three cultivars. The principal component analysis (PCA) provides graphical representation for correlations and differences between the organoleptic characteristics of sweet potato cultivars (see Figure 2(b)). This graphical representation PCA confirms the results obtained by analysis of variance and by the AHC. Sweet potato CAM/09/005 is anti-correlated (opposite position along axis 1) to other cultivars. It is distinguished by its non-fibrous appearance, its overall slightly sweet taste, with a meltable and grainy texture and mouthfeel. Cultivars CAM/11/006, CAM/11/007 and CAM/11/008 are statistically comparable due to their overall taste, their intense sweet flavour and a creamy, pasty texture.
Hierarchical Classification Analysis (HCA) provides the following dendrogram establishing the classification of the eight cultivars of sweet potato and highlighting the groups in terms of colour, texture and size (diameter, length, weight) (Figure 3(a)). The statistical treatment of all results by HCA allowed classifying the eight cultivars of sweet potato into four groups differentiated by their colours. CAM/11/008 was isolated in a statistical group, and differed from other cultivars by its purple colour. The sweet potatoes CAM/09/005 and CAM/09/0004 assembled in the second group had a statistical greyish colour and were heavier than the other cultivars. CAM/11/ 007, CAM/11/006 and CAM/09/006 are gathered in the third group with a statistically lower weight. CAM/09/ 002 and CAM/09/001 had orange tints and were in the fourth statistical group. The PCA provides graphical representation for correlations and differences between the sweet potato cultivars physical and technological parameters (Figure 3(b)). This graphical representation PCA confirms the results obtained by analysis of variance and by the HCA in terms of colour and texture. Sweet potato CAM/11/008 was anti-correlated (opposite position along axis 1) to other cultivars, and was distinguished by its darker colour (anti-correlated to L), its largest diameter and higher tensile strength. CAM/09/005 was characterized by its cohesion, its hardness and chewiness higher than other varieties. It was anti-correlated with the sweet potato CAM/09/002. Sweet potatoes CAM/09/001 and CAM/11/007 differed from other cultivars in hue (pretty clear, parameter b).
HCA provides the following dendrogram establishing the classification of the eight cultivars of sweet potato and highlighting the groups in terms of nutritional composition (Figure 4(a)). The statistical treatment of all results by CAH allowed classifying the eight cultivars of sweet potato into 3 groups. CAM/11/006, CAM/11/007 and CAM/11/008 were in the first statistical group. They were distinguished by high contents of total polyphenols and low potassium. CAM/09/002, CAM/09/004 and CAM/09/006 were distinguished by their high levels of β-carotene and potassium. CAM/09/001 and CAM/09/ 005 stood out from the other 2 groups by their low levels of total polyphenols. Overall, the CAH reinforces the nutritional outcomes for the eight cultivars of sweet potato. The principal component analysis (PCA) provides graphical representation for correlations and differences between nutritional parameters sweet potato cultivars (Figure 4(b)). This graphical representation PCA confirms the results obtained in terms of nutrition. CAM/11/ 006, CAM/11/007 and CAM/11/008 differed from other cultivars by their high polyphenols and carbohydrates contents, high energy value and low levels of vitamins and minerals. CAM/09/001 and CAM/09/005 were characterized by their high starch content and low levels of total polyphenols. CAM/09/002, CAM/09/004 and CAM/ 09/006 differed from other cultivars by their high levels of total carotenoids, β-carotene, vitamin C and potassium. They were anti-correlated with CAM/11/006, CAM/11/ 007 and CAM/11/008.
4. Discussion
The first differences observed for the eight cultivars of sweet potato were in their phenotypic appearance (flesh colour, leaf shape) and vegetative development more or less important. Cultivars CAM/09/004 and CAM/11/008 have a specific flesh colour that could have a favourable impact on consumers. After cooking, there is a systematic colour loss in the skin when not completely detached from the wafer. In fact, anthocyanins responsible for the colouration are eliminated by dilution in water (Degras 1998). For other cultivars, the colour beCAMe duller and darker. These changes were due to degradation of carotenoids (Degras 1998). Varieties were statistically different with respect to their colour. CAM/09/002 was distinguished by its intense orange colour. CAM/11/008 was distinguished by its intense violet colour and due to the presence of anthocyanins. CAM/11/006 cultivar was the whitish. Cultivars showed no significant difference in the length and weight.
The texture was statistically different between the eight cultivars. CAM/09/005 was distinguished by higher elasticity, hardness, chewiness and cohesion. Conversely, CAM/09/002 was characterized by elasticity, hardness,
 (a)
(a)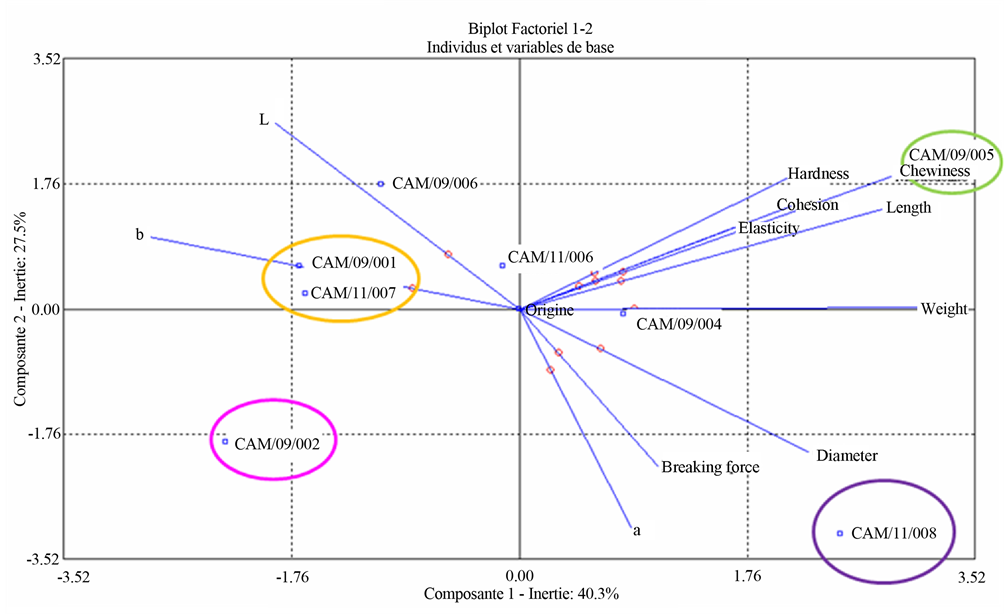 (b)
(b)
Figure 3. (a) Technological and physical data dendogram of the eight varieties of sweet potatoes. Aggregation criteria were variance (ward method) and calculation of distances was distance from Chi-Two; (b) Sensorial data biplot of the eight varieties of sweet potatoes. Contribution to the formation of axes were weight, b, chewiness and length for axis 1 (horizontal); L, a, tensile strength and diameter for axis 2 (vertical) and elasticity, tensile strength and cohesion for axis 3.
 (a)
(a)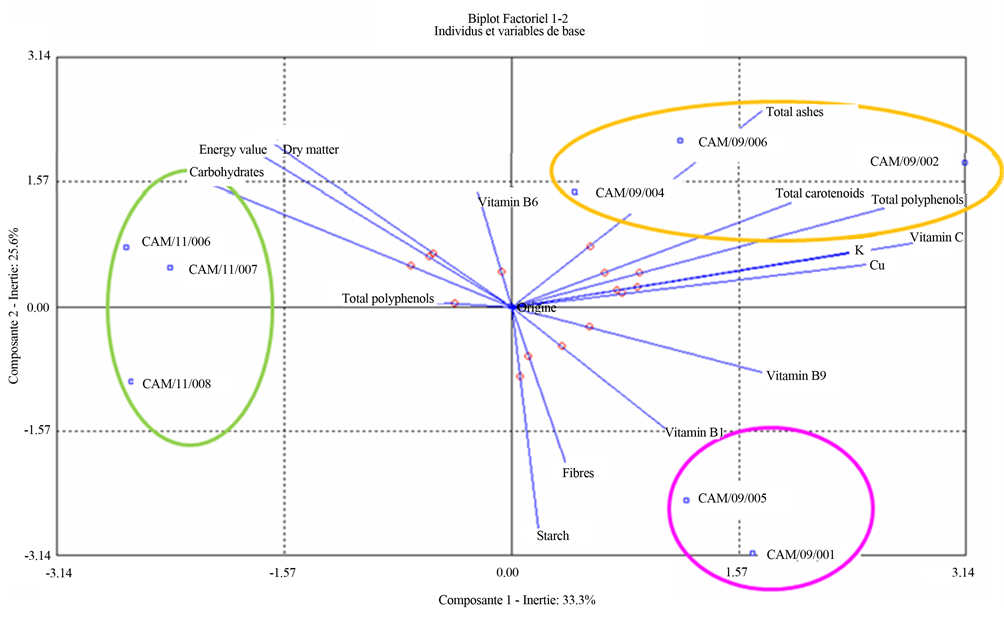 (b)
(b)
Figure 4. (a) Nutritional data dendogram of the eight varieties of sweet potatoes. Aggregation criteria were variance (ward method) and calculation of distances was distance from Chi-Two; (b) Nutritional data biplot of the eight varieties of sweet potatoes. Contribution to the formation of axes were total carotenoids and vitamin C for axis 1 (horizontal) and starch for axis 2 (vertical).
chewiness, breaking strength and cohesion lower than other cultivars. The results obtained at the sensory characterization were not in agreement with those found here. For example, CAM/09/005 was characterized by a very melting texture whereas here this cultivar had the highest hardness, cohesion and chewiness. While CAM/ 11/006 and CAM/11/007 were characterized by average hardness and chewiness, they were perceived by the expert panel as very melting. Laboratory temperature was 20˚C and the samples remained in the air. For sensory analysis, samples were kept at 30˚C - 40˚C in water before serving. This could explain the different textures observed between samples remained in the open air (and harder) and those kept in water and at higher temperature (and therefore melting).
All cultivars of sweet potatoes had polyphenols contents exceeding 76.00 mg/100g. Although there are no allegations to date, these eight cultivars can be considered source of polyphenols. Indeed, in a study conducted by CIRAD on fruits and vegetables rich in polyphenols [21], potato is in the nineteenth position with a polyphenols content of 23.1 mg/100g. With an average of 119.09 mg/100g, sweet potatoes studied here had 5 times more polyphenols than potato, and would be placed at the fourth position in this ranking, just ahead shallot with 104.1 mg/100g. Studies have indicated that polyphenols have high free-radical scavenging activity, which helps to reduce the risk of chronic diseases, such as cardiovascular disease, cancer and age-related neuronal degeneration [22]. These results on the sweet potatoes are interesting from the scope of polyphenols in the field of health. Now it would be very interesting to determine the antioxidant activity of sweet potato extract and quantify specific polyphenols to conclude.
Table 7 compares the average nutritional composition of the eight cultivars studied to nutritional composition of averaged sweet potato on the basis of international tables of compositions (USA, Argentina, France, Germany, South Africa, Denmark, Finland, Australia, Pacific and Brazil) [23-30]. The eight cultivars grown in Martinique were advantageously positioned in relation to the globally identified data for their fibre, starch, potassium and copper, vitamin B1, B3 and folate (vitamin B9) contents. Conversely, their β-carotene and manganese contents were lower than the average sweet potato worldwide studied.
Compared to the ordinary potato, Martinique sweet potatoes have better nutritional potential. Their energy value was almost twice as much as found in potatoes. Sweet potatoes also had twice as much vitamin C, 2.7 times more vitamin B9 and 63 times more beta-carotene as potato. Sweet potato cultivars grown in Martinique were also richer in minerals and vitamins. Vitamin C is known for its antioxidant properties [31]. CAM/09/002 was really rich in vitamin C while CAM/09/001, CAM/ 09/004, CAM/09/005, CAM/09/006 and CAM/11/007 were sources of vitamin C. The role of vitamin B1 is located in the metabolism and assimilation of nutrients. This is a key element of the energy production in the body [32]. Vitamin B9 (folic acid) is mainly present in vegetables, liver and eggs. Its main actions are at the level of cell growth and in the synthesis of DNA and some amino acids [33]. By their high contents of vitamin C, B1 and B9, CAM/09/006 and CAM/09/001 varieties had the best “vitamin potential”. Because of its high levels of potassium and copper CAM/09/006 had the best “mineral potential”. Based on these results and the presence of many vitamins and minerals, Martinique sweet potatoes are of interest to human health.
The eight sweet potato cultivars were noticeably diverse with sensory, physicochemical and nutritional characteristics very varied. Overall, CAM/11/006, CAM/11/ 007 and CAM/11/008 had similarities to sensory and nutritional levels. CAM/11/008 had specificity to two other cultivars because of its intense violet colour. These are varieties with outstanding taste and texture but nutritionally poor. CAM/09/002 and CAM/09/006 were close on all the criteria studied (sensory, nutritional and technological). These sweet potatoes are distinguished by their nutritional quality.
We tried to show different ways and methods in using those eight varieties of sweet potatoes (fresh and processed). We selected specific criteria to conduct this analysis (size/shape, sensory profile, nutritional value, average yield of transformation). Sweet potatoes with small caliber and regular shape are best for selling to consumers (purchase volume, ease of cutting and peeling). Cultivars with uniform colour, firm and/or melting textures and interesting nutritional potential are also recommended for direct selling to consumers. Conversely, sweet potatoes with large bore, irregularly shaped, fibrous appearance, granular or powdery texture and/or low nutritional properties are recommended more for industrial use (flour, mashed, flake). Finally, when cultivars are characterized by intermediate criteria, they can be used in both fresh and processed. Thus, CAM/09/002 is interesting for a fresh valorization because of its small size and regular shape, its colour, soft texture and nutritional properties: high vitamins, minerals, carotenoids and total polyphenols contents. In contrast, CAM/09/005 is suggested more for processed products because of its large size, its slightly firmer texture and low nutritional potential: levels of vitamins and lower polyphenols. CAM/09/001 is recommended for industrial use, such as in flour because of its irregular forms, non-homogeneous colour, fibrous appearance, richness in starch and sugar. CAM/09/004, CAM/09/006 and CAM/11/006 have criteria more or less advantageous for use in fresh or processed. The regular form of CAM/09/004, its texture and mineral wealth are an asset to its valuation fees. However its very inhomogeneous colour may be a disadvantage. In the same way, CAM/09/006 caliber and nutritional criteria can make a variety of mouth but its mealy and grainy texture can be a disadvantage. Finally, its shape, uniform colour, its taste and sweetness are an asset to the cultivar CAM/11/006 although its mineral and vitamin potentials are low. CAM/11/007 has advantages for fresh vegetable consumption (small size, uniform colour, intense flavour and texture). However, its irregular shape and low nutritional potential can be a disadvantage. Precooked frozen slices or mashed pieces could be used as an alternative. Finally, CAM/11/008 has the distinction of having an intense violet colour which makes a separate variety. Despite its large size and a fibrous aspect, its specificity makes it an asset for selling costs. However, transformations into puree, crips or precooked frozen slices may also be recommended because of its high fibre content, its low mineral and vitamin potential. The realization of a consumer test on these cultivars will decide on the acceptability criteria of these sweet potatoes with consumers in Martinique.
5. Conclusion
This study is the first to investigate varietal characterizations of sweet potatoes in Martinique. The eight cultivars were differentiated by their phenotypic, sensory, physicochemical and nutritional characteristics. Martinique sweet potatoes are richer in nutritional compounds, minerals and vitamins than ordinary potatoes. Sweet potatoes also have a lower glycemic index which opens perspectives to treat diabetes and obesity. Fact sheets were developed for each studied cultivars combining all data obtained as well as recommendations in terms of ways of valorization. Their sensory specificity, high nutritional value and industrial processing adaptabilities have also been highlighted. In view of this potential and processability of these plants, further investigations into their qualities are needed. This would enhance their strengths and thus encourage the development of these productions within agricultural professional organizations and agribusiness associations. This work is especially helpful for optimal management of harvesting in Martinique.
Acknowledgements
We would like to express our gratitude to the Regional Council of Martinique (France) and the FEDER for its financial support. We also like to thank the local agricultural department which provided the tubers. Ms Carolyn Milienne who provided language help is also thanked.
REFERENCES
- M. Van den Abeele and R. Vandenput, “Les Principales Cultures du Congo Belge,” 3rd Edition, Direction de l’Agriculture, des Forêts et de l’Elevage, 1956, pp. 113- 121.
- J. Fournet, “Flore Illustrée des Phanérogames de Guadeloupe et de Martinique,” Cirad, Gondwana Editions, Inra Editions, Tome 1, 2002, pp. 1230-1231.
- J. R. Magness, G. M. Markle and C. C. Compton, “Food and Feed Crops of the United States,” Interregional Research Project IR-4, 1971. http://www.hort.purdue.edu/newcrop/Crops/SweetPotato.html
- C. M. Messiaen, “Le Potager Tropical,” 3rd Edition, Presses Universitaires de France, Paris, 1975, pp. 422- 433.
- J. A. Duke, “Handbook of Energy Crops,” 1983. http://www.hort.purdue.edu/newcrop/duke_energy/Ipomoea_batatas.html
- INRA, “Sweet Potato,” 2007. www.antilles.inra.fr/content/download/5597/81887/version/1/file/d%E9p+patate+site.pdf
- L. Huaccho and R. J. Hijmas, “A Geo-Referenced Database of Global Sweet Potato Distribution,” Production Systems and Natural Resource Management Department Working Paper No. 4, International Potato Center, 2000.
- Z. Huaman, “Descriptors for Sweet Potato,” CIP/AVRDC/ IBPGR, 1991, pp. 85-134.
- L. Degras, “Le Technicien d’Agriculture Tropicale, La Patate Douce,” Editions Maisonneuve et Larose, Paris, 1998.
- N. S. Susheelamma, G. C. Reddy, C. S. Rukmani and R. N. Tharanathan, “Studies on Sweet Potatoes. Part I: Changes in the Carbohydrates during Processing,” Starch/Stärke, Vol. 44, No. 5, 1992, pp. 163-166. http://dx.doi.org/10.1002/star.19920440502
- ODEADOM, “Patate Douce,” 2009. http://www.odeadom.fr/?page_id=60
- J. C. Favier, J. Ireland-Ripert, C. Toque and M. Feinberg, “Répertoire Général des Aliments Table de Composition,” Inra Editions, Tec et Doc, Cneva Ciqual, 1995.
- S. W. Souci, W. Fachmann and H. Kraut, “La Composition des Aliments Tableaux des Valeurs Nutritives,” MedPharm Scientific Publishers, Taylor et Francis CRC, 2008.
- H. Joseph, “La Patate Douce a Démontré ses Vertus Santé,” 2006. http://www.lanutrition.fr/communaute/opinions/interviews/henry-joseph-la-patate-douce-a-demontre-ses-vertus-sante.html
- FAOSTAT, 2007. http://faostat.fao.org/site/567/DesktopDefault.aspx?PageID=567#ancor
- V. Hagenimana, E. E. Carey, S. T. Gichuki, M. A. Oyunga and J. K. Imungi, “Carotenoid Contents in Fresh, Dried and Processed Sweet Potato Products,” Ecology of Food and Nutrition, Vol. 37, No. 3, 1999, pp. 455-473.
- M. A. Lemos, M. M. Aliyua and G. Hungerfordb, “Observation of the Location and Form of Anthocyanin in Purple Potato Using Time-Resolved Fluorescence,” Innovative Food Science & Emerging Technologies, Vol. 16, 2012, pp. 61-68. http://dx.doi.org/10.1016/j.ifset.2012.04.008
- S. M. Laurie, P. J. Van Jaarsveld, M. Faber, M. F. Philpott and M. T. Labuschagne, “Trans-β-Carotene, Selected Mineral Content and Potential Nutritional Contribution of 12 Sweet Potato Varieties,” Journal of Food Composition and Analysis, Vol. 27, No. 2, 2012, pp. 151-159. http://dx.doi.org/10.1016/j.jfca.2012.05.005
- S. Georgé, P. Brat, P. Alter and M. J. Amiot, “Rapid Determination of Polyphenols and Vitamin C in Plant-Derived Products,” Journal of Agricultural and Food Chemistry, Vol. 53, No. 5, 2005, pp. 1370-1373. http://dx.doi.org/10.1021/jf048396b
- World Health Organization, Food and Agricultural Organization of the United Nations, WHO/FAO, “Vitamin and Mineral Requirements in Human Nutrition,” 2nd Edition, WHO, 2004.
- P. Brat, S. Georgé, A. Bellamy, L. Du Chaffaut, L. Mennen, A. Scalbert and M. J. Amiot, “Polyphenol Fruits and Vegetables Database: Determination of the French Polyphenol Intake,” Fruit, Vegetable and Health Congress, Québec, 2005.
- B. M. Ames, M. K. Shigena and T. M. Hagen, “Oxidants, Antioxidant and the Degenerative Diseases of Aging,” Proceedings of the National Academy of Sciences, Vol. 90, 1993, pp. 7915-7922. http://dx.doi.org/10.1073/pnas.90.17.7915
- Nutrient Data Laboratory, “USDA National Nutrient Database for Standard Reference,” 2008. http://www.nal.usda.gov/fnic/foodcomp/search/
- S. J. Closa and M. C. De Landeta, “Tabla de Composición de Alimenta,” Universidad National de Luján, Buenos Aires, 2002. http://www.unlu.edu.ar/~argenfoods/Tablas/Tabla.htm
- NMRC South Africa, “South Africa Food Composition Table,” 2008. http://databases.mrc.ac.za/FoodComp/
- National Food Institute, Technical University Danemark, “Danish Food Composition Databank,” 2008. http://www.foodcomp.dk
- National Institute for Health and Welfare, Nutrition Unit, “Fineli Food Composition Database Release 9,” 2008. http://www.fineli.fi/index.php?lang=en
- NUTTAB, “Australian Food Composition Tables,” Food Standard, 2006. http://www.foodstandards.gov.au/monitoringandsurveillance/nuttab2006/foodcompositiontable3466.cfm
- C. Dignan, B. Burlingame, S. Kumar and W. Aalbersberg, “Pacific Islands Food Composition Table,” 2nd Edition, 2004. http://www.fao.org/docrep/007/y5432e/y5432e00.htm
- Departamento de Alimentos e Nutrição Experimental, FCF/USP, “Tabela Brasileira de Composição de Alimentos USP,” 2008. http://www.fcf.usp.br/tabela/
- S. J. Padayatty, A. Katz, Y. Wang, P. Eck, O. Kwon, J. H. Lee, S. Chen, C. Corpe, A. Dutta, S. K. Dutta and M. Levine, “Vitamin C as an Antioxidant: Evaluation of Its Role in Disease Prevention,” The Journal of the American College of Nutrition, Vol. 22, No. 1, 2003, pp. 18-35. http://dx.doi.org/10.1080/07315724.2003.10719272
- A. Fattal-Valevski, “Thiamin (Vitamin B1),” Journal of Evidence-Based Complementary & Alternative Medicine, Vol. 16, No. 1, 2011, pp. 12-20. http://dx.doi.org/10.1177/1533210110392941
- National Academy of Sciences, Institute of Medicine, Food and Nutrition Board, Ed., “Chapter 8—Folate. Dietary Reference Intakes for Thiamine, Riboflavin, Niacin, Vitamin B6, Folate, Vitamin B12, Pantothenic Acid, Biotin and Choline,” National Academy Press, Washington DC, 1998.
NOTES
*Corresponding author.