Food and Nutrition Sciences
Vol.4 No.8A(2013), Article ID:35282,8 pages DOI:10.4236/fns.2013.48A013
Effect of Homogenization Temperature and Pressure on Lipoprotein Lipase Activity and Free Fatty Acids Accumulation in Milk
![]()
Department of Food Science, Aarhus University, Aarhus, Denmark.
Email: #lars.wiking@agrsci.dk
Copyright © 2013 Lars Wiking, Jonatan A. Dickow. This is an open access article distributed under the Creative Commons Attribution License, which permits unrestricted use, distribution, and reproduction in any medium, provided the original work is properly cited.
Received May 16th, 2013; revised June 16th, 2013; accepted June 23rd, 2013
Keywords: Homogenization; Lipoprotein Lipase; Milk Fat Globules; BDI; NEFA; FFA
ABSTRACT
This study demonstrated that homogenization did not increase the activity of lipoprotein lipase (LPL) in spite of a fast accumulation of free fatty acids (FFA). Two homogenization pressures (100 and 170 bar) and two temperatures (40˚C and 50˚C) were examined. The activity of LPL was analyzed and the formation of FFA was measured with two different methods, the B.D.I.-method and a nonesterified fatty acids (NEFA) method. A homogenization temperature of 50˚C resulted in a decreased LPL activity compared to 40˚C. No effect of homogenization pressure was found. Analyzing FFA concentration with the B.D.I.-method resulted in significant effect of homogenization temperature and no effect of pressure. The largest formation of FFA was found in milk homogenized at 40˚C. Using the NEFA method, another result was obtained, indicating no effect of homogenization temperature and a larger FFA accumulation at 100 bar than at 170 bar. Both analytic methods demonstrated significant production of FFA during 60 min incubation at homogenization temperature after treatment. The level of FFA in the milk samples immediately after homogenization was very high, demonstrating that LPL cleaves the triglycerides very rapidly when the native membrane was damaged. The regression between the B.D.I.-method and the NEFA was fair in the interval between 4 and 14 mmol/100 g fat, whereas at higher concentrations, the correlation was poor.
1. Introduction
The majority of fluid dairy products are homogenized in order to avoid creaming of fat globules or to improve rheological properties. Homogenization of milk reduces the average milk fat globule (MFG) diameter to < 1 µm which results in a 5 - 10 fold increase in surface area. The new surface layer is covered by proteins with caseins as a dominant (~93%) [1]. The original membrane material is still present. Recently, confocal laser scanning microscopy analysis of homogenized cream indicated that the phospholipids were organized in a similar way as on native MFG even though much more protein surrounded the surface [2].
The new membrane formed after homogenization is not strong enough to protect the triglycerides in the core of the globules from lipolysis which is undesirable due to development of rancid off-flavours. The classic division of lipolysis in milk is between spontaneous and induced lipolysis. The factors affecting spontaneous lipolysis include milking frequencies, udder health and stage of lactation. Induced lipolysis is caused by homogenization, pumping and temperature fluctuations. Lipoprotein lipase (LPL), EC 3.1.1.34, is the main enzyme responsible for hydrolysis of the glycerol ester of fatty acids. In freshly drawn milk, LPL is primarily associated (~75%) to the casein micelles [3]. Cooling of milk causes the casein micelles, and therefore the LPL, to associate to the MFG [4]. Homogenization also results in a severe attraction of casein to the milk fat globules. LPL is inactivated or reduced to almost zero activity by HTST heat treatment of 72˚C for 15 s [5]. The products of the hydrolysis of the triglycerides, the free fatty acids (FFA), inhibit the LPL enzyme presumably due to FFA binding to the active sites of LPL.
LPL preferentially hydrolyses fatty acids in position sn-1 and sn-3. The fatty acids placed with high frequencies on positions sn-1 and sn-3 are C4, C6, C18 and C18:1 [6]. In accordance with this, it has been demonstrated that C4, C6 and C18:1 were the most frequent FFA in a mixture of raw and pasteurized milk stored at 4˚C [7]. It is mainly the fatty acids with chain length from 4 to 12 that contribute to the rancid flavor, for example Duncan & Christen [8] reported that the flavor threshold in milk for added C4 is 0.20 µM compared to 0.55 µM for C18:1. Quantifying FFA in milk is a challenge due to the span in hydrophobicity which causes low recovery of certain FFA [9]. The widely used methods, such as the B.D.I.-method [9] based on milk fat separation by use of a detergent, or the copper soap method [10] based on organic solvent extraction, both loose the short chain FFA to the aqueous phase. The advantage of these methods is that several studies have evaluated the sensory threshold for rancidity. However, the threshold scores in these studies vary from 1.25 to 2.0 mmol/100 g fat [11-13]. More qualitative and quantitative information can be obtained from HPLCand GC-based methods, for example by using solid phase microextraction-GC. Gonzalez-Cordova & Vallejo-Cordoba [14] found a high correlation between short-chain FFA determined quantitatively and sensory scores. A fast and cheap way to estimate the FFA content in milk is by use of Fourier transform infrared spectroscopy, used for example by Rasmussen, Wiking, Bjerring and Larsen [15]. However, the correlation between this method and the B.D.I.-method is only r2 = 0.6 [16].
The process variables that can be changes at homogenization of milk are pressure and temperature. Increasing pressure results in decreasing MFG size, whereas the effect of homogenization temperature is expected to be minor on MFG size [17]. Recent literature does not describe the initial effect of homogenization on lipolysis, and especially lipase activity, but has focused more on storage effects after pasteurization [18]. Studies dealing with induced lipolysis have traditionally not used more than one method to quantify FFA and have neither at the same time analyzed for LPL activity. The objective of the present study was to examine theeffect of homogenization temperature and pressure on LPL activity and concentration of FFA in milk. Furthermore, two methods for FFA determination were used and correlation between these is discussed.
2. Materials and Methods.
2.1. Materials
NEFA-C kit (Wako Pure Chemical Industries Ltd., Osaka, Japan) was obtained from Tri-Chem aps, Skanderborg, Denmark. Heparin was from LEO Pharma A/S, Ballerup, Denmark. All chemicals used were of analytical grade.
2.2. Homogenization Treatment
Raw milk (3.89% fat and 3.43% protein) collected from the dairy herd at Research Centre Foulum (Tjele, Denmark) was pumped from the balance tank to the regenerative section in the plate heat exchanger, heated to either 40˚C or 50˚C, and hereafter continued to the single-stage homogenizer (Rannier type, APV, Silkeborg, Denmark). Two homogenization pressures were tested: 100 and 170 bar. Homogenization temperature was monitored by a Tinytag 2 Temperature Logger (Metric A/S, Smoerum, Denmark) placed on the pipe surface at the inlet. Milk samples were collected from the pipe between the homogenizer and the plate heat exchanger immediately after homogenization. Samples were incubated in water bath at temperatures identical to the homogenization temperatures for 0, 10, 30, 60 and 120 min. After incubation, samples for FFA measurement by NEFA-C kit were heated 80˚C for 10 min, whereas 340 mL of 15% H2O2 was added to the 250 mL samples for FFA measurement by B.D.I.-method, thereby obtaining a final concentration of 0.02% H2O2 to deactivate LPL. Samples for LPL measurement were cooled in ice water immediately after incubation at homogenization temperature. All samples were stored at −20˚C until analysis. Each homogenization treatment was repeated three times.
2.3. Determination of the Particle Size Distribution of Milk Fat Globules
Particle size distributions were determined by integrated light scattering using a Mastersizer 2000 (Malvern Instruments Ltd., Malvern, UK). Similar refractive indices as in [19] were used. The average volume-weighted diameter,  was calculated by the software
(where Ni is the number of globules in a size class of diameter di).
2.4. Analysis of LPL Activity in Milk
The LPL activity was measured by applying a method developed for lipase activity analysis in clinical and purified systems as described in [20]. The assay was optimized with regard to milk concentration and incubation time to ensure a linear response as described in [4]. Briefly, incubation buffer (12% bovine serum albumin, 33.3 U/mL heparin, 0.2 M NaCl, 0.3 M Tris-HCl, pH 8.5)
was mixed with phospholipid-stabilised emulsion of soy bean triacylglycerols with the same composition as Intralipid (10%) into which 3H-labeled triolein had been incorporated on manufacture (kind gift from Prof. GunillaOlivecrona, Umeå University, Sweden; courtesy of Pharmacia-Upjohn and Fresenius-KABI, Uppsala Sweden), heat inactivated rat serum and Millipore water (Millipore, Billerica, MA, USA). The reaction was initiated by the addition of sample (i.e. milk or cream diluted 1:1 with 5 mM Na-deoxycholate, 0.1 mM SDS, 20 mMTris, pH 8.5) and stopped by addition of organic solvents. All reactions were carried out for 20 min in a 25˚C water bath, n = 6. FFA were extracted and counted in a liquid scintillation counter (Wallac, Turku, Finland). Lipase activity was calculated in milliunits (mU) which corresponds to the amount of enzyme that produces 1 nmol of FFAs min−1.
2.5. Concentration of FFA in Milk Analysed by NEFA
FFA was analysed using a Wako NEFA-C kit essentially as described in [21] with a few modifications. Briefly, 3 mL diluted milk sample (1:20 with 5 mM Na-deoxycholate, 0.1 mM SDS, 20 mMTris pH 8.5) was mixed in a microtiterplate with 20 mL Reagent A (acyl-CoA synthetase, 0.53 U·mL−1; ascorbate oxidase, 2.6 U·mL−1; Coenzyme A, 0.31 mM; ATP, 4.3 mM; 4-aminoantipyrine 1.5 mM; phosphate buffer, pH 7.0, 50 mM; Sodium azide, 0.05%) and incubated 10 min at 25˚C with gentle shaking. 40 mL Reagent B (acyl-CoA oxidase, 12 U·mL−1; peroxidase, 14 U·mL−1, 3-methyl-N-ethyl-N-(β- hydroxyethyl)-aniline, 2.4 mM) was added followed by another incubation for 10 min at 25˚C with gentle shaking. Absorbance was read at 546 nm and calibrated against a standard curve of oleic acid. All samples were analyzed in triplicates.
2.6. Concentration of FFA in Milk Analysed by B.D.I.
FFA was analyzed using the B.D.I.-method [9]. The method involves an extraction of milk with the B.D.I. reagent (Triton X-100 and sodium tetraphosphate) to separate the fat. The released fat is dissolved in 2-propanol/ethanol and titrated with ethanolic KOH under nitrogen.
2.7. Statistical Analysis
The effects of homogenization temperature, pressure and incubation time were analysed using the PROC GLM procedure (SAS Institute, Cary, NC). P < 0.05 was used as the significant threshold.
3. Result and Discussion
Increasing the homogenization pressure from 100 bar to 170 bar significantly (P = 0.0004) decreased the average diameter of the MFG (Table 1). Increasing the homogenization temperature only significantly (P = 0.03) affected the average diameter of the MFG negatively at a pressure of 100 bar. The obtained reduction in MFG diameter upon homogenization pressure is within range of previously reported studies [22]. In milk, small effects of homogenization temperature are expected: 2% - 6% decrease in average diameter per 10˚C increase [17] which is in accordance with the present study at 170 bar. However, at 100 bar our decrease was ~14% in fat globule diameter from 40˚C to 50˚C. In cream, the final globule size is more affected by homogenizing temperature which is explained by a faster covering of the new interface at higher temperature, hence, a lower coalescence rate [22]. The decrease in viscosity will presumably also have an impact.
Lipase activity in the milk was significantly (P < 0.001) reduced by increasing homogenization temperature (Figure 1). No effect of homogenization pressure was observed. During the incubation after homogenization, the lipase activity significantly (P < 0.001) decreased, however the greatest incubation time effect was found in milk homogenized and incubated at 50˚C. The results clearly show that homogenization pressure alone does not affect lipase activity. The homogenization temperature and the following similar incubation temperature have an impact, as the enzyme is sensitive to heat treatment even at 50˚C [5]. The lipoprotein lipase is mainly associated to the casein fraction in fresh warm milk, but adhering to the milk fat globules during cooling [4]. At higher homogenization temperatures, casein micelles spread more rapidly over the fat-water interface which causes a lower surface excess of protein [1]. This distribution and configuration factor could also have some effect on the LPL activity. Likewise, a two-stage high pressure homogenization (200 MPa) has shown a decrease in lipase activity when homogenization temperature increases [23]. Earlier,

Table 1. Effect of homogenization on the diameter of MFG, means and SE (n = 3). Whole milk was homogenized at 40 or 50˚C with pressures of 100 and 170 bar, respectively.

Figure 1. Lipase activity in whole milk after homogenization at 40˚C (A) or 50˚C (B) with pressures of 100 (black circle) or 170 (open circle) bar, respectively. Error bars are SE.
it has been speculated that homogenization could activate LPL presumably due to a release from the casein micelles, however, our result based on a clear LPL activity measurement does not support this speculation.
It is well-known that mechanical damage of the MFG such as homogenization accelerates lipolysis. The concentration of FFA in milk increased significantly during time after homogenization when measured by the NEFA method (Figure 2). The accumulation of FFA was significantly (P < 0.05) higher in milk homogenized at 100 bar than at 170 bar and unaffected by homogenization temperature. In contrast, analysis of the FFA concentration by the B.D.I.-method demonstrated a significant (P < 0.001) effect of homogenization temperature with highest accumulation of FFA at 40˚C, and no effect of homogenization pressure was observed (Figure 3). The development during incubation time was significant (P < 0.001) and the starting concentration was very large, ~9 and 5 mmol/100 g fat at 40˚C and 50˚C, respectively, which is well over the thresholds for rancid flavor. By use of the B.D.I.-method, studies have evaluated the sensory threshold for lipolytic rancidity to be between 1.3 and 2.7 mmol/100 g fat (for review, see [24]). It is predominantly the short chain FFA that contributes to the rancid flavor in milk [8]. A previous study has shown that the sensory threshold for rancidity in milk was reached five minutes after homogenization at 37˚C [21]. Our results demonstrated that the development of FFA is much faster and that the sensory threshold is reached rapidly.
The lower production of FFA at 50˚C homogenization temperature measured by the B.D.I.-method is in agreement with the observed lower LPL activity at this temperature. However, similar observations were not made when using the NEFA analysis. In a storage experiment with milk subjected to ultra-high pressure homogenization, greater accumulation of FFA was found using homogenization temperature of 30˚C compared to using 40˚C [18].
Both analyses for FFA concentration showed fast development of FFA after homogenization, and FFA levels reached a critical level before first sampling was possible.
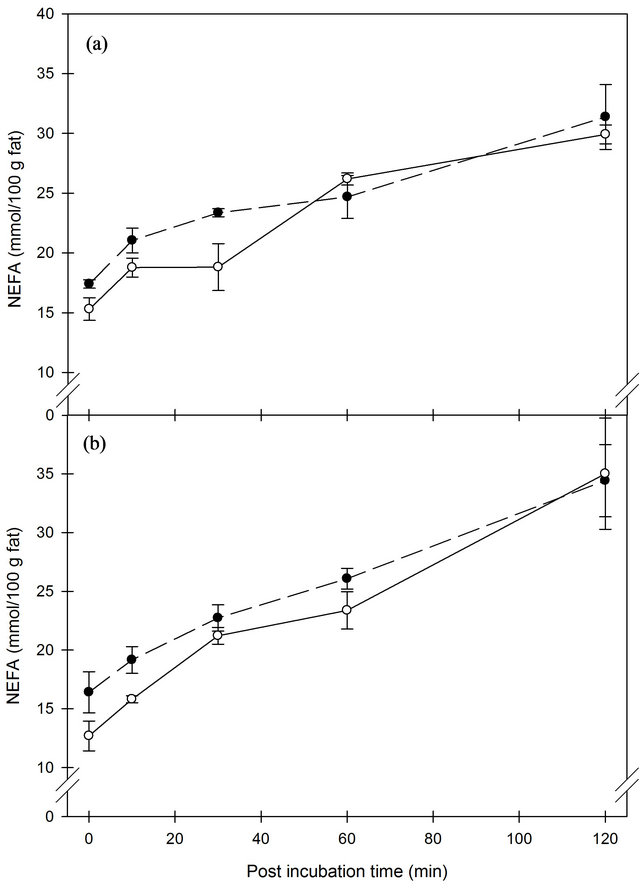
Figure 2. Concentration of FFA measured by NEFA method in whole milk after homogenization at 40˚C (a) or 50˚C (b) with pressures of 100 (black circle) or 170 (open circle ) bar, respectively. Error bars are SE.
Therefore, the time interval to the following pasteurization is crucial to avoid rancid flavor in homogenized drinking milk. Datta, Hayes, Deeth and Kelly [23] also reported very rapid action of lipase immediately after homogenization. Manufacturers of cheeses could potentially benefit from this knowledge to accelerate FFA production in cheese milk for products where rancidity is desired, e.g. Danish blue and feta, and maybe reduce addition of starter culture instead.
The faster formation of NEFA at 100 bar versus 170 bar might be ascribed to changes in composition of the new surface layer since the smaller globules obtained from 170 bar homogenization are expected to have a thicker protein layer which is richer in whey proteins [1]. Hereby, the access of LPL to triglycerides in the MFG core is potentially hindered causing lower lipolysis. A previous study has demonstrated that increasing the homogenization pressure further from 70 bar has no additive effect on lipolysis [25]. This is in agreement with our results based on B.D.I.-measurements which indicate that the available substrate surface is not the decisive factor for lipolysis in homogenized milk.
Figure 4 shows the correlation between FFA analyzed by the NEFA and B.D.I.-methods. Up to a concentration of 14 mmol/100 g fat, based on the B.D.I.-method, a fair correlation (R2 = 0.78) was found. For higher values of FFA, the correlation was poor (R2 = 0.51). The FFA values obtained from the NEFA analysis are higher than those obtained by the B.D.I.-method, which to some extent can be ascribed to the way of calculation and expression of the concentration of FFA. The B.D.I.-values are based on the mass of the fat used in the titration procedure. The unit of the output from the NEFA analysis is mM, and converting this to mmol/100 g fat implies an overestimation of the value since it will include the FFA from the plasma phase.
The use of a NEFA method in milk has also been conducted by Koops, Klomp and van Hembert [26]. They used a continuous-flow set-up based on the same enzymatic color reaction as used by the NEFA method.
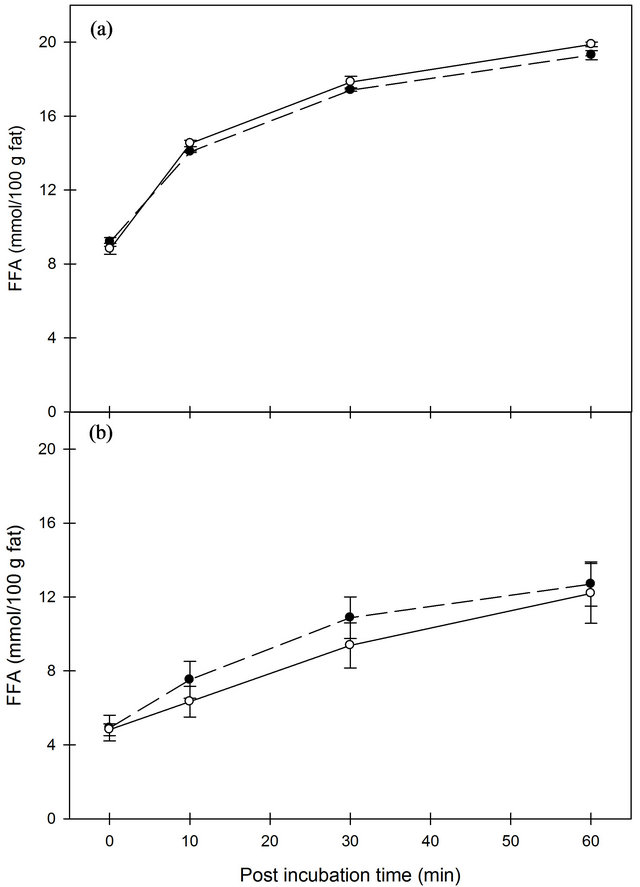
Figure 3. Concentration of free fatty acids measured by B.D.I.-method in whole milk after homogenization at 40˚C (A) or at 50˚C (b) with pressures of 100 (black circle) or 170 (open circle) bar, respectively. Error bars are SE.
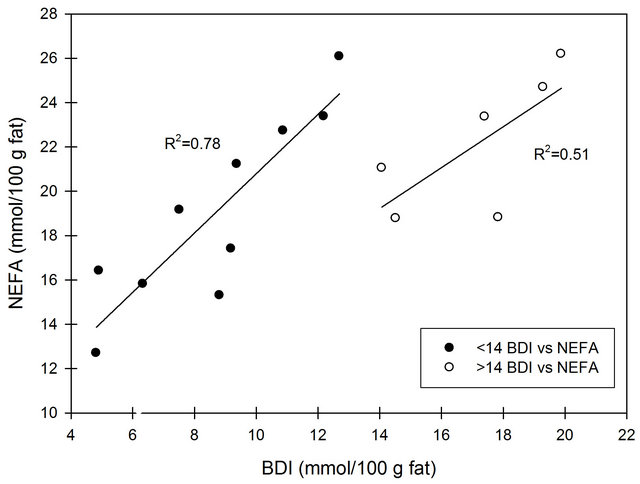
Figure 4. Correlation between FFA concentration analysis by NEFA and B.D.I., respectively. Regression is made for values lower than 14 mmol/100 g fat and for values larger than 14 mmol/100 g fat by the B.D.I.-method.
However, it makes use of a clarification solution (Triton X-100) to clear the reaction product before absorbance measurement. Likewise, Koops, Klomp and van Hembert [26] compared the NEFA method to the B.D.I.-method and reported a slope of 1.72, intercept close to zero and no information of correlation. The slope in the present study was 1.34 for the regression < 14 mmol/100 g fat with a high intercept 7.4. As opposed to our study with homogenized milk, Koops, Klomp and van Hembert [26] analyzed raw milk, and the discrepancy between intercepts might be explained by this fact. Shipe, Senyk and Fountain [10] compared the B.D.I.-method and a modified version of the copper soap method for both non-homogenized and homogenized milk samples and observed a lower recovery of FFA in homogenized milk for the latter method compared to B.D.I. This indicates that homogenization affects the solvent extraction of FFA more than detergent extraction does. In the present study, both methods are detergent-based. However, the NEFA method uses SDS and deoxycholate which might explain the higher yield observed by the NEFA method. In conclusion, a good correlation was found between the two FFA measurement methods at FFA concentrations of less than of 14 mmol/100 g fat (measured by the B.D.I.-method) even though the intercept was high. It has to be taken into consideration that the very used B.D.I.-method is only an estimate of the FFA concentration as it has poor recovery of short chain fatty acids.
4. Conclusion
Summarizing the study, LPL activity was not affected by homogenization pressure. However, lower LPL activity was observed at homogenization temperature of 50˚C as compared to 40˚C. FFA formation showed a pattern similar to that of the LPL activity when analyzed by the B.D.I.-method. Opposite results were found by the NEFA analysis. However, both methods indicated that lipolysis is rapidly and severely ongoing in the early time after homogenization.
5. Acknowledgements
The funding for PhD student J. A. Dickow is gratefully received from the Danish Dairy Research Foundation and the Ministry of Food, Agriculture and Fisheries, Denmark.
REFERENCES
- P. Walstra, T. J. Geurts, A. Noomen, A. Jellema and M. A. J. S van Boekel, “Dairy Technology—Principles of Milk Properties and Processes,” Marcel Dekker, New York, 1999.
- S. Gallier, D. Gragson, R. Jimenez-Flores and D. Everett, “Using Confocal Laser Scanning Microscopy to Probe the Milk Fat Globule Membrane and Associated Proteins,” Journal of Agricultural and Food Chemistry, Vol. 58, No. 7, 2010, pp. 4250-4257. doi:10.1021/jf9032409
- K. A. Hohe, P. S. Dimick and A. Kilara, “Milk Lipoprotein Lipase Distribution in the Major Fractions of Bovine Milk,” Journal of Dairy Science, Vol. 68, No. 5, 1985, pp. 1067-1073. doi:10.3168/jds.S0022-0302(85)80930-9
- J. A. Dickow, L. B. Larsen, M. Hammershøj and L. Wiking, “Cooling Causes Changes in the Distribution of Lipoprotein Lipase and Milk Fat Globule Membrane Proteins between the Skim Milk and Cream Phase,” Journal of Dairy Science, Vol. 94, No. 2, 2011, pp. 646-656. doi:10.3168/jds.2010-3549
- F. M. Driessen, “Inactivation of Lipases and Proteinases (Indigenous and Bacterial),” Bulletin of the International Dairy Federation 238, International Dairy Federation, Brussels, 1989, pp. 71-93.
- R. G. Jensen, “The Composition of Bovine Milk Lipids, Invited Review,” Journal of Dairy Science, Vol. 85, No. 2, 2002, pp. 295-350. doi:10.3168/jds.S0022-0302(02)74079-4
- G. C Ouattara, J. L. Jeon, R. A. Hart-Thakur and K. A. Schmidt, “Fatty Acids Released from Milk Fat by Lipoprotein Lipase and Lipolyticpsychrotrophs,” Journal of Food Science, Vol. 69, No. 8, 2004, pp. 659-664. doi:10.1111/j.1750-3841.2004.tb18014.x
- S. E. Duncan and G. L. Christen, “Sensory Detection and Recovery by Acid Degree Value of Fatty Acids Added to Milk,” Journal of Dairy Science, Vol. 74, No. 9, 1991, pp. 2855-2859. doi:10.3168/jds.S0022-0302(91)78466-X
- International Dairy Federation, “Determination of Free Fatty Acids in Milk and Milk Products,” Bulletin 265, International Dairy Federation, Brussel, 1991
- W. F. Shipe, G. F. Senyk, and K. B. Fountain, “Modified Copper Soap Solvent-Extraction Method for Measuring Free Fatty-Acids in Milk,” Journal of Dairy Science, Vol. 63, No. 2, 1980, pp. 193-198. doi:10.3168/jds.S0022-0302(80)82913-4
- Government Research Institute for Dairy Industry, Hillerød, Denmark, Report No. 136, 1962.
- S. L. Tuckey and J. Stadhoud, “Increase in Sensitivity of Organoleptic Detection of Lipolysis in Cows Milk by Culturing or Direct Acidification,” Netherlands Milk and Dairy Journal, Vol. 21, 1967, pp. 158-162.
- V. T. Pillay, A. N. Myhr and J. L. Gray, “Lipolysis in Milk 1 Determination of Free Fatty-Acid and Threshold Value for Lipolyzed Flavor Detection,” Journal of Dairy Science, Vol. 63, No. 8, 1980, pp. 1213-1218. doi:10.3168/jds.S0022-0302(80)83070-0
- A. F. Gonzalez-Cordova and B. Vallejo-Cordoba, “Detection and Prediction of Hydrolytic Rancidity in Milk by Multiple Regression Analysis of Short-Chain Free Fatty Acids Determined by Solid Phase Microextraction Gas Chromatography and Quantitative Flavor Intensity Assessment,” Journal of Agricultural and Food Chemistry, Vol. 51, No. 24, 2003, pp. 7127-7131. doi:10.1021/jf030347w
- M. D. Rasmussen, L. Wiking, M. Bjerring and H. C. Larsen, “The Influence of Air Intake on the Level of Free Fatty Acids and Vacuum Fluctuations during Automatic Milking,” Journal of Dairy Science, Vol. 89, No. 12, 2006, pp. 4596-4605. doi:10.3168/jds.S0022-0302(06)72509-7
- J. H. Nielsen, “Udvikling af Metodikker til Rutinemæssig Evaluering af Smagsfejl i Mælk,” Research Report, Danish Dairy Research Foundation, Aarhus, 2005.
- P. Walstra, “Effects of Homogenization on the Fat Globule Size Distribution in Milk,” Netherlands Milk and Dairy Journal, Vol. 29, 1975, pp. 279-294.
- J. Pereda, V. Ferragut, J. M. Quevedo, B. Guamis and A. J. Trujillo, “Effects of Ultra-High-Pressure Homogenization Treatment on the Lipolysis and Lipid Oxidation of Milk during Refrigerated Storage,” Journal of Agricultural and Food Chemistry, Vol. 56, No. 16, 2008, pp. 7125- 7130. doi:10.1021/jf800972m
- L. Wiking, L. Björck and J. H. Nielsen, “The Influence of Feed on Stability of Fat Globules during Pumping of Raw Milk,” International Dairy Journal, Vol. 13, No. 10, 2003, pp. 797-803. doi:10.1016/S0958-6946(03)00110-9
- T. Olivecrona and G. Olivecrona, “Determination and Clinical Significance of Lipoprotein Lipase and Hepatic Lipase,” In: N. Rifai, G. Warnick and M. Dominiczak, Eds., Handbook of Lipoprotein Testing, AACC Press, Washington DC, 2000, pp. 479-498.
- M. M. Johnson and J. P. Peters, “An Improved Method to Quantify Nonesterified Fatty-Acids in Bovine Plasma,” Journal of Animal Science, Vol. 71, 1993, pp. 753-756.
- H. Mulder and P. Walstra, “The Milk Fat Globule Emulsion Science as Applied to Milk Products and Comparable Foods,” Bucks: Commonwealth Agricultural Bureaux, Farnham Royal, 1974.
- N. Datta, G. H. Hayes, H. C. Deeth and A. L. Kelly, “Significance of Frictional Heating for Effects of High Pressure Homogenisation on Milk,” Journal of Dairy Research, Vol. 72, 2005, pp. 393-399. doi:10.1017/S0022029905001056
- L. Wiking, “Milk Fat Globule Stability—Lipolysis with Special Reference to Automatic Milking Systems,” Ph.D. Dissertation, Swedish University of Agricultural Sciences, Uppsala, 2005.
- Z. Saito, “Effects of Homogenization on the Rennet Coagulation of Milk and Cream,” In: Protein and Fat Globule Modifications by Heat Treatment, Homogenization and Other Technological Means for High Quality Dairy Products, International Dairy Federation, No. 9303, Brussels, 1994, pp. 343-335.
- J. Koops, H. Klomp and H. van Hemert, “Rapid Enzymatic Assay of Free Fatty Acids (Lipolysis) in Farm Tank Milk by a Segmented Continous-Flow Method. Comparison of the Results with Those Obtained by the BDI Procedure,” Netherland Milk and Dairy Journal, Vol. 44, 1990, pp. 3-19.
NOTES
*Present address: Hamlet Protein, P.O. Box 130, DK-8700 Horsens, Denmark.
#Corresponding author.