Food and Nutrition Sciences
Vol.4 No.5(2013), Article ID:31640,8 pages DOI:10.4236/fns.2013.45074
Comparison between High-PUFA and Low-PUFA Fats on Lipid Peroxidation and LDL Oxidation
![]()
Department of Food Science and Nutrition, University of Minnesota, Minneapolis and St. Paul, USA.
Email: ascsalla@umn.edu
Copyright © 2013 Christine M. Seppanen et al. This is an open access article distributed under the Creative Commons Attribution License, which permits unrestricted use, distribution, and reproduction in any medium, provided the original work is properly cited.
Received September 17th, 2011; revised October 22nd, 2012; accepted October 29th, 2012
Keywords: Lipid Peroxidation; Oxidized LDL; Beef Tallow; Rats; Soybean Oil; TBARS
ABSTRACT
This study was conducted to determine the effects of a low polyunsaturated fatty acid (PUFA) 21 diet versus a highPUFA diet on lipid peroxidation and on low density and very low density lipoprotein (LDL + VLDL) oxidation in vivo. Rats were fed 10% beef tallow (BT) or 10% soybean oil (SO) diet for 21 weeks. Lipid peroxidation was measured by assessing urinary 24 excretions of secondary lipid peroxidation products, by HPLC and by measuring thiobarbituric acid reactive substances (TBARS) in liver tissue. Plasma LDL + VLDL in vivo oxidation was measured by conjugated diene concentration and TBARS; ex vivo resistance to copper-induced oxidation was also assessed. Total urinary aldehydes, twelve individual urinary aldehydes, and TBARS in the liver were significantly lower in the BT group compared to the SO group. Plasma LDL + VLDL was significantly more resistant to copper-induced ex vivo oxidation to the BT group compared to the SO group. However, in vivo plasma LDL + VLDL oxidation levels measured as conjugated dienes and by TBARS were not significantly different. In general, the low-PUFA BT diet appears to have a protective effect on in vivo lipid peroxidation compared to the high-PUFA diet, but not on in vivo plasma LDL + VLDL oxidation.
1. Introduction
Lipid peroxidation, the oxidative deterioration of polyunsaturated fatty acids (PUFA), proceeds through an autocatalytic free radical induced chain reaction [1-3], and this is associated with the loss of membrane PUFA and the formation of hydroperoxides, free radical intermediates, and numerous secondary lipid peroxidation products such as aldehydes and related carbonyl compounds [4]. Lipid peroxidation can impair cell functions by altering macromolecules including proteins and nucleic acids [5]. Increased in lipid peroxidation in vivo is associated with several human diseases (heart disease, diabetes, cancer, cataract, and others) and is of considerable interest from a public health point of view [6]. The release of toxic aldehydic degradation products, byproducts of PUFA metabolism, could result in significant damage to cells present in the arterial walls and may be related to atherosclerotic lesions. Oxidative modification of low-density lipoprotein (LDL), which results in the formation of oxidized-LDL particles, has been implicated in the pathogenesis of atherosclerosis and heart disease [7-11]. During the process of LDL oxidation, PUFA undergo peroxidative decomposition, resulting in the formation of secondary lipid oxidation products such as aldehydes and ketones [12]. Aldehydes may conjugate to apo B and phospholipids of LDL and these changes result in a shift in the metabolic fate of LDL, causing it to be recognized by scavenger receptors on macrophages rather than by LDL-specific receptors [13-15]. Since scavenger receptors are not down regulated by an increase in the intracellular cholesterol content, cholesterol accumulation and foam cell formation can result [10,11]. Factors that have been reported to affect the susceptibility of LDL to oxidation include antioxidant concentration [16-21] and fatty acid composition [22-30].
Dietary factors which have been shown to influence the susceptibility of LDL particles to oxidation relate to the level of consumption of various types of fatty acids. In general, it appears that diets rich in monounsaturated fatty acids are associated with the inhibition of the oxidation of LDL particles, while diets rich in PUFA, specifically w-6 fatty acids, appear to promote LDL oxidation [31]. To date, the relative effects of low-PUFA containing dietary fats, such as beef tallow, which contains about 20% stearic acid and 42% monounsaturated fatty acid isomers (mostly oleic acid), on LDL oxidation have not been thoroughly investigated. Stearic acid has not been shown to increase plasma cholesterol as other saturated fatty acids do [32]. Thus, beef tallow is an ideal low-PUFA dietary fat to compare to a high-PUFA fat such as soybean oil because it is expected to decrease the susceptibility of LDL to oxidation and it should have no effect on plasma cholesterol.
Previous investigations in our laboratory have shown the beneficial effects of dietary beef fat [33], as compared to a high-PUFA soybean oil diet with respect to general in vivo lipid peroxidation. Dietary consumption of beef fat resulted in reduced susceptibility of serum to oxidation and also reduced whole body oxidation as measured by urinary excretion of secondary lipid oxidation products, without increased serum cholesterol or triglyceride levels in rats.
The focus of the current investigation was on LDL oxidation. The purpose of this research was to determine if consumption of a low-PUFA beef tallow diet would provide a protective effect against LDL oxidation and in vivo lipid peroxidation as compared to a high-PUFA soybean oil containing diet.
2. Materials and Methods
2.1. Animals and Diets
Weanling Sprague-Dawley female rats (Harlan Sprague Dawley, Indianapolis, IN) were divided into two groups of ten animals each and received either of two dietary treatments that differed only in the fat source (Table 1) for 21 weeks. The beef tallow diet (BT) contained low polyunsaturated fatty acids (PUFA) (~4%) and the soybean oil diet (SO) contained high PUFA (~58% [all 2- or 3-double bonded]) [33]. Total dietary fat was 10% by weight of diet corresponding to consumption of 20% of calories from fat, which represented a moderate to lowfat diet. The diets were equalized for vitamin E content to produce results based on fatty acid difference and not
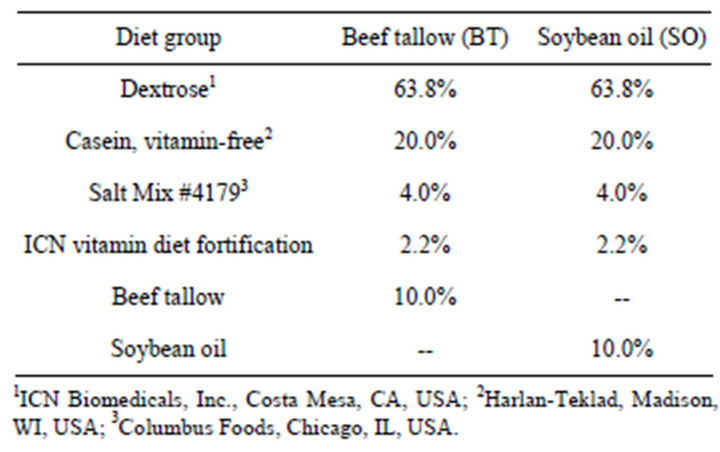
Table 1. Composition of experimental diets fed to rats for 21 weeks.
antioxidant consumption.
During the 21-week feeding period, food and water were provided ad libitum and body weight and 24-hr food intake were measured weekly. At the end of the feeding period, the animals were placed in metabolic cages, fasted for 48 hrs with access to water ad libitum during which time the urine was collected in the second 24-hr period. After fasting, the rats were anesthetized with isoflurane and blood was collected by cardiac puncture. Blood was collected into tubes containing anticoagulant (EDTA Disodium salt, Fisher Biotech, Fair Lawn, NJ) (~1 mg/mL blood), and then centrifuged (6 min at 2200× g, room temperature) to separate the plasma. The plasma was collected and 10 µL per mL plasma of 600 g/L sucrose was added to prevent LDL aggregation [34]. Liver tissue was also collected. Plasma, liver tissue, and urine were all stored at −70˚C until use. The University of Minnesota Institutional Animal Care and Use Committee (IACUC) approved all protocols used in this study.
2.2. Urinary Aldehydes
Urine analysis was conducted using the method developed in this laboratory for the excretion of lipophilic aldehydes which are secondary lipid peroxidation products [35-37]. Three mL of urine sample was combined with an equal volume of freshly prepared dinitrophenylhydrazine (DNPH) reagent [37]. The urine and DNPH mixture was incubated overnight at room temperature in the dark to form hydrazone derivatives of aldehydes (DNP-hydrazones) and related carbonyl compounds. The DNPhydrazones were extracted with CH2Cl2. The polar and nonpolar DNP-hydrazones, and osozones (sugar DNPH derivatives) were separated by thin-layer chromatography on silica gel plates developed with CH2Cl2 and the corresponding aldehyde bands were eluted with methanol. The polar and nonpolar DNP-hydrazone fractions were each separately chromatographed on a reverse phase C18 HPLC column (Ultrasphere ODS C18, 25 cm × 4.6 mm i.d., 5 µm) with gradient elution. The polar compounds (PC) were eluted with an initial isocratic mobile phase of 50:50 methanol:water (v/v) for 10 min followed by a linear gradient to 100% methanol. The nonpolar compounds (NPC) were eluted with initial isocratic mobile phase of 75:25 methanol:water (v/v) for 10 min followed by a linear gradient to 100% 112 methanol and the UV detection wavelength was 378 nm. All solvents used were HPLC grade. The method sensitivity was less than 1 ng for the individual derivatives per 10 μl injection to the HPLC column.
2.3. Urinary Creatinine
Urinary creatinine was analyzed by the method of Heinegard and Tiderstrom [38]. Creatinine was reacted with picric acid under alkaline conditions and the absorbance was determined at 500 nm. The absorbance was translated to concentration based on the absorbance of a known concentration of creatinine.
2.4. Thiobarbituric Acid Reactive Substances (TBARS)
The method of Uchiyama and Mikasa [39] was used to determine the thiobarbituric acid reactive (TBARS) products of in vivo lipid peroxidation in the liver. Results are expressed as malondialdehyde (MDA) equivalents.
2.5. Lipoprotein Assays
2.5.1. Lipoprotein Isolation
Plasma low-density lipoproteins (LDL) plus the very low density lipoproteins (VLDL) were isolated by a short-run density-gradient ultracentrifugation method [40]. Plasma (2 mL) was placed in a polycarbonate centrifuge tube (Beckman Instruments, Inc., Palo Alto, CA) and 4 mL saline (d = 1.1416 g/mL) containing 0.1 g/mL EDTA was added to adjust the density of the solution to 1.053 g/mL. The tubes were centrifuged 8 hrs at 150,000× g at 15˚C. After centrifugation, the LDL + VLDL containing fraction at the top of the tube was collected. EDTA was removed from the samples by rapid filtration through disposable Sephadex G-25 desalting columns (PD-10, Amersham Biosciences, Piscataway, NJ). Samples were stored at 4˚C until further analysis. All analyses were completed in <1 week.
2.5.2. Protein Concentration of Lipoproteins
The protein content of the LDL + VLDL fraction was determined by the Bradford method [34]. Aliquots (100 µL) of EDTA-free lipoprotein were incubated with 2 mL of Bradford reagent containing Coomassie brilliant blue (100 mg/L) for 10 min. The absorbance was read at 595 nm. Protein concentration was based on bovine serum albumin (35 mg/dL) standard.
2.5.3. In Vivo Oxidation of Lipoproteins
The method of Ahutopa et al. [41] was used to determine the extent of in vivo LDL + VLDL oxidation by measuring the amount of conjugated dienes in the isolated LDL + VLDL fraction. Lipids were extracted from the LDL + VLDL samples with chloroform:methanol (2:1 v/v). Aliquots of LDL + VLDL solution (250 µL) were combined with 4 mL water, then washed three times with 2 mL chloroform:methanol (2:1 v/v). The solvent phases were collected and further washed two more times with 8 mL water. The solvent was evaporated under N2 gas and the lipids were redissolved in 1.5 mL cyclohexane. The absorbance of each sample was determined at 234 nm and absorbance units were converted to molar units using the molar extinction coefficient of 2.95 × 10⁴ M−1·cm−1. Results are reported as nmol conjugated dienes in the LDL + VLDL fraction per mg LDL + VLDL protein.
2.5.4. Copper-Induced ex Vivo Oxidation of Lipoproteins
A modified method of Kleinveld et al. [40] was used to complete the copper-induced ex vivo oxidation of LDL + VLDL and the response to this oxidation was measured. Aliquots of the plasma LDL + VLDL fractions (200 µL) were placed in a cuvette with 0.6 mL phosphate-buffered saline (0.01 M, pH 7.4). Oxidation was initiated by the addition of CuSO4·5H2O solution (final concentration of 20 µmol/L). The formation of conjugated dienes was monitored by measuring the absorbance at 234 nm at 37˚C every 2 min for 6 hrs. The lag time was defined as the time before the onset of rapid oxidation and conjugated diene formation. This value is reported in minutes. The maximal rate of oxidation was calculated from the slope of the absorbance curve during the time of rapid formation of conjugated dienes. The maximum concentration of conjugated dienes was also determined and is reported as nmol dienes per mg LDL + VLDL protein.
2.5.5. Cholesterol and Triglyceride Concentration in Lipoproteins
The amount of cholesterol and triglycerides in the LDL + VLDL fraction were determined using commercially available test kits (cholesterol, Roche Diagnostics, Indianapolis, IN; triglycerides, Wako Chemicals USA, Inc. Richmond, VA). The results are expressed as mg LDL + VLDL cholesterol or triglyceride per mg LDL + VLDL protein.
2.6. Statistical Analyses
All statistical analyses were performed using GraphPad Prism version 4.00 for Windows (GraphPad Software, San Diego, CA). The Student’s t-test was used to determine statistically significant differences between the dietary treatment groups for all analyses. Differences were considered significant when p < 0.05.
3. Results
In this experiment, 20 rats were fed either a 10% beef tallow (BT) or 10% soybean oil (SO) containing diet for 21 weeks, while all other dietary ingredients were identical. Table 1 shows the composition of the diets. The fatty acid composition of the dietary fats was previously reported [35]. Figure 1 represents the average body weight of the animals, as monitored weekly during the feeding period. Average daily food intake was also monitored weekly. There was no significant difference between the two diet groups in either body weight (p = 0.0907) or food intake (p = 0.1128).
Figure 2 presents the summary of the urinary excretion of non-polar carbonyl compounds (NPC) by rats fed BT or SO diets. The bars represent duplicate measurements of the individually separated and quantified carbonyl compounds. The following aldehydes and ketones were identified in the urine and are in good agreement in our previously published results [37,38]; butanal, 2-butanone, pentanal, 2-pentanone, 2-hexenal, hexanal, 2,4- heptadienal, 2-heptenal, octanal, 2,4-decadieanal, and decanal. Two of the measured compounds are not yet identified. The results are expressed as µg hexanal equivalents per mg urinary creatinine and are reported in the order of elution from the HPLC column. In general, increased excretion of aldehydes was observed in most cases due to increased in vivo oxidation in response to the SO diet as compared to the BT diet and statistical significances were observed for three compounds: decanal and the unidentified compounds E and L.
Figure 3 shows the summary of excretion of polar carbonyl compounds (PC) by rats fed BT or SO diets. The bars represent duplicate measurements of the individually separated and quantified carbonyl compounds. All of the eighteen excreted PC were increased as a result of consuming the SO diet and nine of the PC were significantly higher in the SO diet group than in the BT diet group.
The total urinary excretion of all of the individually measured NPC and PC is summarized in Table 2. The SO diet group excreted a higher amount of urinary carbonyl compounds than did the BT diet group. The difference was statistically significant for the polar compounds (p = 0.0332) and both the nonpolar and polar compounds together (p = 0.0365), but not for the nonpolar compounds (p = 0.0608).
The TBARS in the liver tissues were significantly higher in the SO diet group than in the BT diet group (18.19 ± 1.04 and 13.55 ± 0.81 mg MDA equivalents/mg
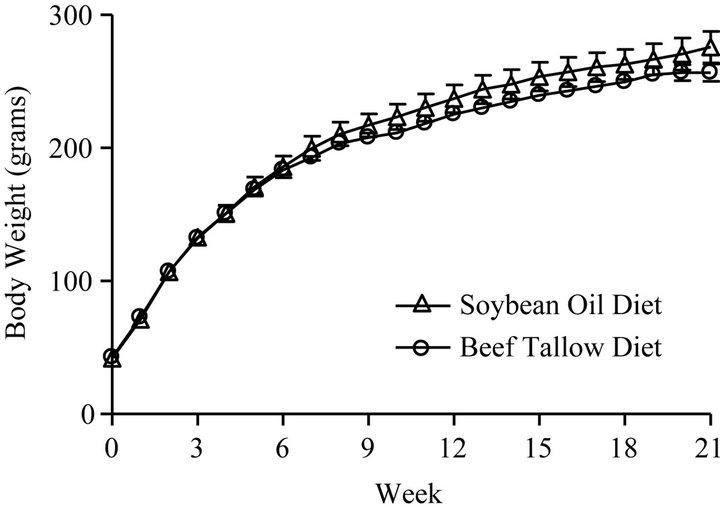
Figure 1. Body weights of rats fed diets beef tallow or soybean oil for 21 weeks.
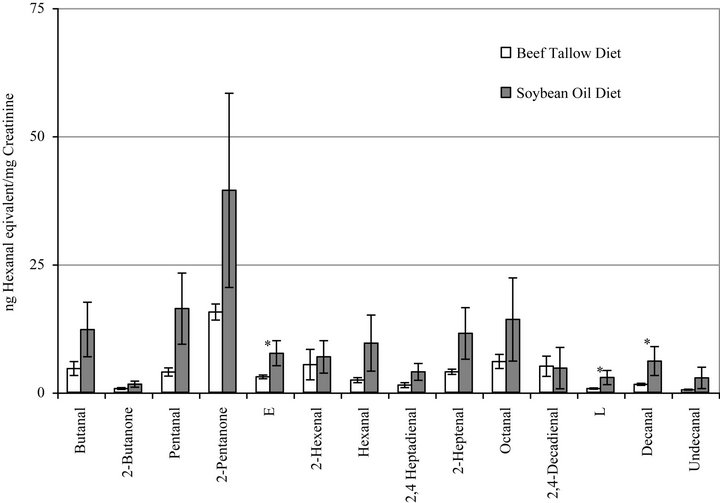
Figure 2. Urinary excretion of individual nonpolar aldehydes and carbonyl compounds by rats fed diets containing beef tallow or soybean oil measured by HPLC. Bars represent mean ± SEM. *Indicates a statistically significant difference between diet groups (p < 0.05) for that compound. Identified compounds are indicated; compounds E and L have not yet been identified.
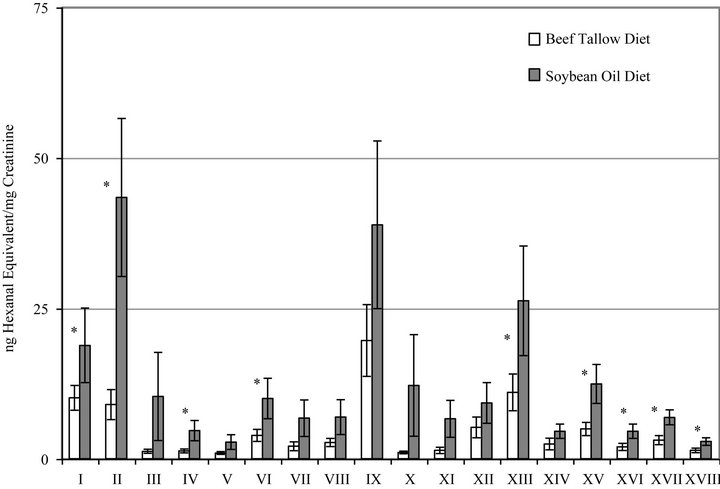
Figure 3. Urinary excretion of individual polar aldehydes and carbonyl compounds by rats fed diets containing beef tallow or soybean oil measured by HPLC. Bars represent mean ± SEM, n = 0. *Indicates a statistically significant difference between diet groups (p < 0.05) for that compound. Each Roman numeral represents one unknown not yet identified compound.
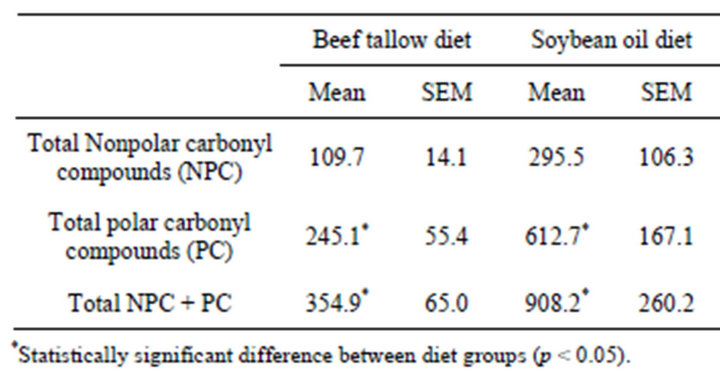
Table 2. Urinary excretion of nonpolar and polar lipophilic aldehydes and carbonyl compounds (ng hexanal equivalents/mg creatinine) by rats fed diets containing 10% beef tallow or soybean oil for 21 weeks.
tissue, respectively) (p = 0.0012). There was no difference between diet groups in the LDL + VLDL TBARS (p = 0.4718).
In the LDL + VLDL plasma fraction that was subjected to copper-induced oxidation, the rate of formation of conjugated dienes and the amount of dienes formed was greater for the SO group than for the BT group (Figure 4), however, there were no significant differences in maximum diene production (p = 0.1475), rate of conjugated diene production (p = 0.3402), or the lag phase (p = 0.0612) due to the different dietary fats (Table 3). There was no significant difference between the dietary treatments in the native conjugated diene concentrations (p = 0.3451).
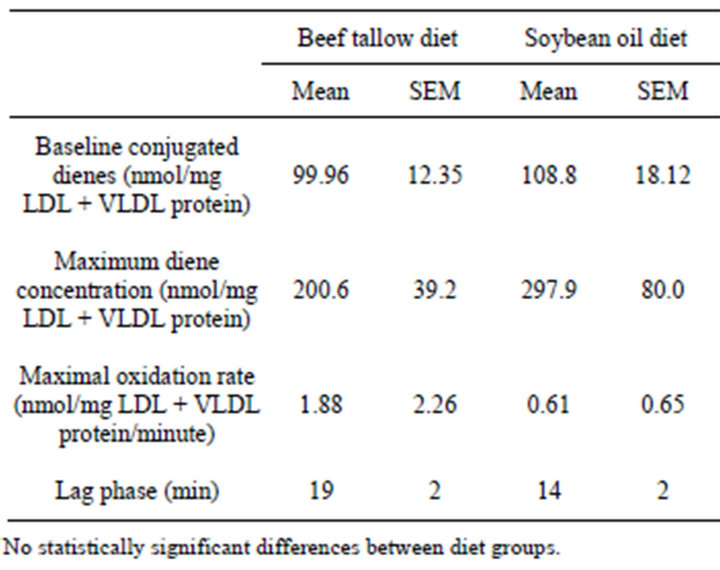
Table 3. Baseline conjugated dienes in LDL + VLDL and maximum diene conjugation, lag phase before rapid onset of conjugated diene production, and maximal oxidation rate in copper-oxidized LDL + VLDL from rats fed diets containing 10% beef tallow or soybean oil for 21 weeks.
There was no difference between the triglyceride levels of the plasma LDL + VLDL fraction from the BT fed animals (3.06 ± 0.22 mg/dL) and the SO fed animals (2.72 ± 0.31 mg/dL) (p = 0.1904). However, the SO diet group did have a significantly lower level of LDL + VLDL cholesterol than did the BT diet group (2.00 ± 0.24 mg/dL and 2.95 ± 0.12 mg/dL respectively; p = 0.0014).
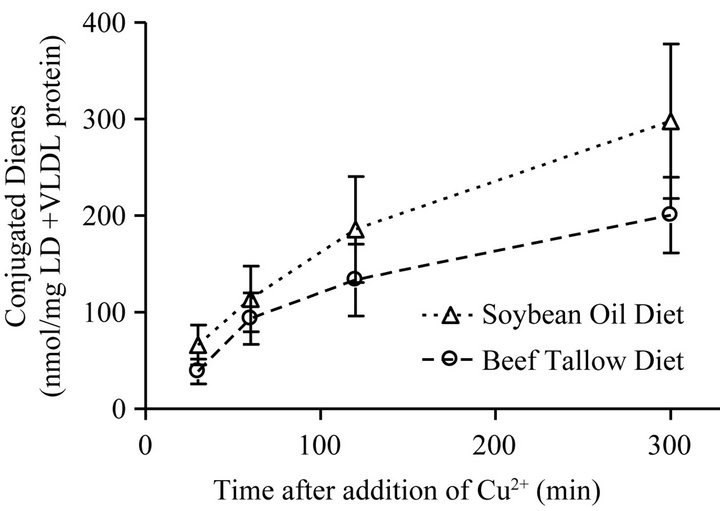
Figure 4. Oxidative resistance measured by conjugated diene concentration following the copper-induced oxidation of the VLDL + LDL fraction of plasma from rats fed diets containing 10% beef tallow or soybean oil diets. Points represent mean ± SEM, n = 10. No statistically significant difference between diet groups at any time point (p < 0.05).
4. Discussion
The purpose of the present study was to use multiple markers for measuring lipid peroxidation and LDL + VLDL oxidation in vivo due to dietary differences between low-PUFA beef tallow (BT) and high-PUFA containing soybean oil (SO) diets. The overall results indicate that the low-PUFA diet reduced in vivo lipid peroxidation as compared to the high-PUFA diet measured by urinary aldehydes excretion and TBARS in the liver. These results are in good agreement with our previous findings [33] that the consumption of a relatively high level of stearic acid from low-PUFA BT resulted in the reduction of in vivo lipid peroxidation, as compared to consumption of a high level of linoleic acid from highPUFA SO. The extent of whole body lipid peroxidation that occurs in vivo can be assessed by measuring the urinary excretion of lipophilic secondary lipid peroxidization products, as this has been demonstrated previously [35,37]. In the present experiments, increased excretion of aldehydes was observed in most cases in the individually measured NPC and PC due to increased in vivo oxidation in the SO diet group compared to the BT diet group, however only three NPC and nine PC reached significant levels. The sum of the individual NPC and PC and the combined sum of total NPC + PC clearly demonstrated significant differences between the SO and BT diet groups. This data shows increased in vivo lipid peroxidation due to the consumption of the high-PUFA SO diet compared to the low-PUFA BT diet. The formation of these aldehydes and related carbonyl compounds excreted in the urine clearly relate to the difference between the fatty acid compositions of the diets. Previous experiments in this laboratory have also shown significant increases in the excretion of urinary aldehydes due to increased in vivo lipid peroxidation caused by an increase in dietary PUFA [33], in vitamin E deficiency and carbontetrachloride toxicity [37], and in diabetes [35].
Thiobarbituric acid reactive substances (TBARS) were measured in liver tissues and the results were in good agreement with the results of the urinary excretion of secondary lipid peroxidation products. Both measurements indicated that in vivo lipid peroxidation was increased in the body due to the high-PUFA SO diet.
A positive relationship was found between low-PUFA BT consumption and reduced susceptibility to ex vivo plasma LDL + VLDL oxidation as measured by the lagtime preceding the formation of conjugated dienes. The ex vivo assay showed consistently that the plasma LDL + VLDL fraction from animals which were fed the lowPUFA BT diet had lower amounts of copper-induced conjugated diene formation than did animals fed the high-PUFA SO diet. In a previous experiment we found that a BT diet resulted in significantly lower level of ex vivo copper-induced oxidation of the serum as compared to a similar SO diet [33]. The addition of copper ions to lipoproteins or to serum in this assay quickly causes oxidative damage to fatty acids. These results suggest that the BT diet provided some protection against this type of damage.
Results for the in vivo lipid peroxidation measured by conjugated diene concentration of native plasma LDL + VLDL showed somewhat lower concentrations for the BT diet group than the SO diet group, but it did not reach statistically significant levels. The measurement of TBARS in the plasma LDL + VLDL, another assay of in vivo lipoprotein oxidation, indicated that there was no difference in formation of these lipid peroxidation products in the plasma LDL + VLDL fraction due the dietary fat consumption. These results and those of the ex vivo oxidation assay suggest that other mechanisms may be in place within the body to minimize oxidative damage to lipoproteins.
The triglyceride concentrations did not show statistically significant differences for LDL + VLDL between the BT and SO diet groups, which seems to indicate that no change in total fat accumulation took place in the lipoproteins. The cholesterol concentration of LDL + VLDL was significantly lower in the SO diet group than the BT diet group. This finding contradicts previous results from our own laboratory [33] as well as results reported by others [32], but it may be a factor of the size and duration of the feeding study.
In summary, the comparison between low-PUFA and high-PUFA diets, on several markers for in vivo lipid peroxidation and LDL + VLDL oxidation, resulted in the following: decreased urinary excretion of secondary lipid peroxidation products, decreased levels of TBARS in the liver tissue but not in plasma LDL + VLDL, increased ex vivo resistance of plasma LDL + VLDL to copper-induced oxidation, and no statistical difference in in vivo plasma LDL + VLDL oxidation. This experiment demonstrates that the consumption of a low-PUFA beef tallow diet had a protective effect against general in vivo lipid peroxidation and provided increased resistance to LDL + VLDL oxidation as compared to the consumption of a high-PUFA soybean oil diet.
5. Acknowledgements
The authors express their appreciation to Dr. D. W. Shoeman for assistance with sample analysis and many technical innovations. This research was supported in part by the Minnesota Agricultural Experiment Station and the Minnesota Beef Council, Minneapolis, MN. The authors have declared no conflict of interest.
REFERENCES
- K. H. Cheeseman, “Mechanisms and Effects of Lipid Peroxidation,” Molecular Aspects of Medicine, Vol. 14, No. 3, 1993, pp. 191-197.
- B. Halliwell and J. M. C. Gutteridge, “Lipid Peroxidation a Radical Chain Reaction,” In: B. Halliwell and J. M. C. Gutteridge, Eds., Free Radicals in Biology and Medicine, 2nd Edition, Oxford University Press, Oxford, 1985, pp. 188-276. doi:10.1016/0098-2997(93)90005-X
- J. Kanner, J. B. German and J. E. Kinsella, “Initiation of Lipid Peroxidation in Biological Systems,” Critical Reviews in Food Science and Nutrition, Vol. 25, No. 4, 1987, pp. 317-364. doi:10.1080/10408398709527457
- J. Terao, “Reactions of Lipid Hydroperoxides,” In: C. Vigo-Pelfrey, Ed., Membrane Lipid Peroxidation, CRC Press, Boca Raton, 1990, pp. 219-238.
- C. Rice-Evans and R. Burdon, “Free Radial-Lipid Interactions and Their Pathological Consequences,” Progress in Lipid Research, Vol. 32, No. 1, 1993, pp. 71-110. doi:10.1016/0163-7827(93)90006-I
- K. Yagi, “Lipid Peroxides and Human Diseases,” Chemistry and Physics of Lipids, Vol. 45, No. 2-4, 1987, pp. 337-351. doi:10.1016/0009-3084(87)90071-5
- C. Meisinger, J. Baumert, N. Khuseyinova, H. Loewel and W. Koenig, “Plasma Oxidized Low-Density Lipoprotein, a Strong Predictor for Acute Coronary Heart Disease Events in Apparently Healthy, Middle-Aged Men from the General Population,” Circulation, Vol. 112, 2005, pp. 651-657. doi:10.1161/CIRCULATIONAHA.104.529297
- K. Shimida, H. Mokuno, E. Matsunaga, T. Miyazaki, K. Sumiyoshi, K. Miyauchi and H. Daida, “Circulating Oxidized Low-Density Lipoprotein Is an Independent Predictor for Cardiac Events in Patients with Coronary Artery Disease,” Atheroscelrosis, Vol. 174, No. 2, 2004, pp. 343-347. doi:10.1016/j.atherosclerosis.2004.01.029
- S. Toshima, A. Hasegawa, M. Kurabayashi, H. Itabe, T. Tankano, J. Sugano, K. Shimamura, J. Kimura, I. Michishita, T. Suzuki and R. Nagai, “Circulating Oxidized Low Density Lipoprotein Levels. A Biochemical Risk Marker for Coronary Heart Disease,” Arteriosclerosis, Thrombosis, and Vascular Biology, Vol. 20, 2000, pp. 2243-2247. doi:10.1161/01.ATV.20.10.2243
- H. Esterbauer, M. Dieber-Rothender, G. Waeg, G. Striegl and G. Jurgens, “Biochemical, Structural, and Functional Properties of Oxidized Low-Density Lipoprotein,” Chemical Research in Toxicology, Vol. 3, No. 2, 1990, pp. 77-92. doi:10.1021/tx00014a001
- D. Steinberg, S. Parthasarathy, T. E. Carew, J. C. Khoo and J. L. Witzum, “Beyond Cholesterol: Modification of Low-Density Lipoprotein That Increases Its Atherogenicity,” New England Journal of Medicine, Vol. 320, 1989, pp. 915-924. doi:10.1056/NEJM198904063201407
- J. L. Witzum and D. Steinberg, “Role of Oxidized Low Density Lipoprotein in Atherogenesis,” Journal of Clinical Investigation, Vol. 88, No. 6, 1991, pp. 1785-1792. doi:10.1172/JCI115499
- S. Parthasarathy, “Oxidation of Low-Density Lipoprotein by Thiol Compounds Leads to Its Recognition by the Acetyl LDL Receptor,” Biochimica et Biophysica Acta, Vol. 917, No. 2, 1987, pp. 337-340. doi:10.1016/0005-2760(87)90139-1
- L. Rohrer, M. Freeman, T. Kodama, M. Penman and M. Krieger, “Coiled-Coil Fibrous Domains Mediate Ligand Binding by Macrophage Scavenger Receptor Type II,” Nature, Vol. 434, 1990, pp. 570-572. doi:10.1038/343570a0
- C. P. Sparrow, S. Parthasarathy and D. Steinberg, “A Macrophage Receptor That Recognizes Oxidized Low Density Lipoprotein but Not Acetylated Low Density Lipoprotein,” Journal of Biological Chemistry, Vol. 264, No. , 1989, pp. 2599-2604.
- F. G. de Waart, U. Moser and F. J. Kok, “Vitamin E Supplementation in Elderly Lowers the Oxidation Rate of Linoleic Acid in LDL,” Artherosclerosis, Vol. 133, No. 2, 1997, pp. 255-263. doi:10.1016/S0021-9150(97)00137-8
- H. Esterbauer, M. Dieber-Rothender, G. Striegl and G. Waeg, “Role of Vitamin E in Preventing the Oxidation of Low-Density Lipoprotein,” American Journal of Clinical Nutrition, Vol. 53, 1991, pp. 314S-321S.
- I. Jialal, C. J. Fuller and B. A. Huet, “The Effect of α-Tocopherol Supplementation on LDL Oxidation. A Dose-Response Study,” Arteriosclerosis, Thrombosis, and Vascular Biology, Vol. 15, 1995, pp. 109-108. doi:10.1161/01.ATV.15.2.190
- I. Jialal and S. M. Grundy, “Effect of Dietary Supplementation with Apha-Tocopherol on the Oxidative Modification of Low-Density Lipoprotein,” Journal of Lipid Research, Vol. 33, No. , 1992, pp. 899-906.
- H. M. G. Princen, W. van Duyvenhoorde, R. Buytenhek, A. van derLaarse, G. van Poppel, J. A. Guvers Leuven and V. W. van Hinsbergh, “Supplementation with Low Doses of Vitamin E Protects LDL from Lipid Peroxidation in Men and Women,” Arteriosclerosis, Thrombosis, and Vascular Biology, Vol. 15, 1995, pp. 325-333. doi:10.1161/01.ATV.15.3.325
- P. D. Reaven and J. L. Witzum, “Comparison of Supplementation of Rrr-α-Tocopherol and Racemic α-Tocopherol in Humans. Effects on Lipid Levels and Lipoprotein Susceptibility to Oxidation,” Arteriosclerosis, Thrombosis, and Vascular Biology, Vol. 13, 1993, pp. 601-608. doi:10.1161/01.ATV.13.4.601
- M. Abbey, G. B. Belling, M. Noakes, F. Hirata and P. J. Nestel, “Oxidation of Low-Density Lipoproteins: Intraindividual Variability and the Effect of Dietary Linoleate Supplementation,” American Journal of Clinical Nutrition, Vol. 57, 1993, pp. 391-398.
- A. Bonanome, A. Pagnan, S. Biffanti, A. Opportuno, F. Sorgato, M. Dorella, M. Maiorino and F. Ursini, “Effect of Dietary Monosaturated and Polyunsaturated Fatty Acids on the Susceptibility of Plasma Low Density Lipoproteins to Oxidative Modifications,” Arteriosclerosis, Thrombosis, and Vascular Biology, Vol. 12, 1992, pp. 529-533. doi:10.1161/01.ATV.12.4.529
- A. Chait, R. L. Brazg and D. L. Tribble, “Susceptibility of Small, Dense, Low-Density Lipoproteins to Oxidative Modification in Subjects with the Atherogenic Lipoprotein Phenotype Pattern B,” American Journal of Medicine, Vol. 94, No. 4, 1993, pp. 350-356. doi:10.1016/0002-9343(93)90144-E
- J. de Graaf, H. L. M. Hak-Lemmers, M. P. C. Hectors, P. N. M. Demacker, J. C. M. Hendriks and A. F. H. Stalenhoef, “Enhanced Susceptibility to in Vitro Oxidation of the Dense Low Density Lipoprotein Subfraction in Healthy Subjects,” Arteriosclerosis, Thrombosis, and Vascular Biology, Vol. 11, 1991, pp. 298-306. doi:10.1161/01.ATV.11.2.298
- S. Dejager, E. Bruckert and M. J. Chapman, “Dense Low Density Lipoprotein Subspecies with Diminished Oxidative Resistance Redominate in Combined Hyperlipidemia,” Journal of Lipid Research, Vol. 34, 1993, pp. 295- 308.
- S. Parthasarathy, J. C. Khoo, E. Miller, J. Barnett, J. L. Witzum and D. Steinberg, “Low Density Lipoprotein Rich in Oleic Acid Is Protected against Oxidative Modification: Implications for Dietary Prevention of Atherosclerosis,” Proceedings of the National Academy of Sciences of the United States of America, Vol. 87, No. 10, 1990, pp. 3894-3989. doi:10.1073/pnas.87.10.3894
- P. D. Reaven, B. J. Grasse and D. L. Tribble, “Effects of Linoleate-Enriched and Oleate-Enriched Diets in Combination with α-Tocopherol on the Susceptibility of LDL and LDL Subfractions to Oxidative Modification in Humans,” Arteriosclerosis, Thrombosis, and Vascular Biology, Vol. 14, 1994, pp. 557-566. doi:10.1161/01.ATV.14.4.557
- P. D. Reaven, S. Parthasarathy, B. J. Grasse, E. Miller, F. Almazan, F. H. Mattson, J. C. Khoo, D. Steinberg and J. L. Witzum, “Feasibility of Using an Oleate-Rich Diet to Reduce the Susceptibility of Low Density Lipoprotein to Oxidative Modification in Humans,” American Journal of Clinical Nutrition, Vol. 54, 1991, pp. 701-706.
- D. L. Tribble, L. G. Holl, P. D. Wood and R. M. Krauss, “Variations in Oxidative Susceptibility among Six Low Density Lipoprotein Subfractions of Differing Density and Particle Size,” Atherosclerosis, Vol. 93, No. 3, 1992, pp. 189-199. doi:10.1016/0021-9150(92)90255-F
- A. Lapointe, C. Couillard and S. Lemieux, “Effects of Dietary Factors on Oxidation of Low-Density Lipoprotein Particles,” Journal of Nutritional Biochemistry, Vol. 17, No. 10, 2006, pp. 645-658. doi:10.1016/j.jnutbio.2006.01.001
- D. M. Hegsted, R. B. McGandy, M. L. Myers and F. J. Stare, “Quantitative Effects of Dietary Fat on Serum Cholesterol in Man,” American Journal of Clinical Nutrition, Vol. 17, 1965, pp. 281-295.
- A. S. Csallany, C. M. Seppanen and K. L. Fritz, “Effect of High Stearic Acid Containing Fat on Markers for in Vivo Lipid Protection,” International Journal of Food Sciences and Nutrition, Vol. 56, No. 8, 2005, pp. 567-579. doi:10.1080/09637480500458019
- M. Bradford, “A Rapid and Sensitive Method for the Quantification of Microgram Quantities of Protein Utilizing the Principle of Protein-Dye Binding,” Analytical Biochemistry, Vol. 72, No. 1-2, 1976, pp. 248-254. doi:10.1016/0003-2697(76)90527-3
- S. S. Kim, D. D. Gallaher and A. S. Csallany, “Vitamin E and Probucol Reduce Urinary Lipophilic Aldehydes and Renal Enlargement in Streptozotocin-Induced Diabetic Rats,” Lipids, Vol. 35, No. 11, 2000, pp. 1225-1237. doi:10.1007/s11745-000-0639-2
- S. S. Kim, D. D. Gallaher and A. S. Csallany, “Lipophilic Aldehydes and Related Carbonyl Compounds in Rat and Human Urine,” Lipids, Vol. 34, No. 5, 1999, pp. 489-496. doi:10.1007/s11745-999-0389-1
- A. S. Csallany, S. S. Kim and D. D. Gallaher, “Response of Urinary Lipophilic Aldehydes and Related Carbonyl Compounds to Factors That Stimulate Lipid Peroxidation in Vivo,” Lipids, Vol. 35, No. 8, 2000, pp. 855-862. doi:10.1007/S11745-000-0594-y
- D. Heinegard and T. G, “Determination of Serum Creatinine by a Direct Colorimetric Method,” Clinica Chimica Acta, Vol. 43, No. 3, 1973, pp. 305-310. doi:10.1016/0009-8981(73)90466-X
- M. Uchiyama and M. Mikasa, “Determination of Malondialdehyde Precursor in Tissues by Thiobarbituric Acid Test,” Analytical Biochemistry, Vol. 86, No. 1, 1978, pp. 271-278. doi:10.1016/0003-2697(78)90342-1
- H. A. Kleinveld, H. L. M. Hak-Lemmers, A. F. H. Stalenhoef and P. N. M. Demacker, “Improved Measurement of Low-Density-Lipoprotein Susceptibility to Copper-Induced Oxidation: Application of a Short Procedure for Isolating Low-Density Lipoprotein,” Clinical Chemistry, Vol. 38, No. 10, 1992, pp. 2066-2072.
- J. Ahotupa, J. Marniemi, T. Lehtimaki, K. Talvinen, O. T. Raitakari, T. Vasankari, J. Viikari, J. Luoma and S. YlaHerruala, “Baseline Diene Conjugation in LDL Lipids as a Direct Measure of in Vivo LDL Oxidation,” Clinical Chemistry, Vol. 31, No. 4, 1998, pp. 257-261.