American Journal of Plant Sciences
Vol.5 No.15(2014), Article
ID:47676,11
pages
DOI:10.4236/ajps.2014.515245
Chemical Composition of the Essential Oil and Nitrogen Metabolism of Menthol Mint under Different Phosphorus Levels
Marco A. A. Souza1, Osmário J. L. Araújo1, Diego M. C. Brito1*, Manlio S. Fernandes2, Rosane N. Castro1, Sonia R. Souza1
1Department of Chemistry, Universidade Federal Rural do Rio de Janeiro, Seropédica, Brazil
2Soil Department, Universidade Federal Rural do Rio de Janeiro, Seropédica, Brazil
Email: *diegobioquimica@hotmail.com
Copyright © 2014 by authors and Scientific Research Publishing Inc.
This work is licensed under the Creative Commons Attribution International License (CC BY).
http://creativecommons.org/licenses/by/4.0/


Received 13 May 2014; revised 15 June 2014; accepted 3 July 2014
ABSTRACT
The purpose of this work was to evaluate the effects of different phosphorus levels (0.05, 0.5, 1 and 2 mM) under nitrogen metabolism and the essential oil profile of menthol mint (Mentha arvensis L.). The relationship between the leaf maturity and the essential oil profile was also explored. The experiment was conducted in a hydroponic system located in a grow chamber during 41 days and after the harvest, nitrate reductase activity, and the  -N, amino-N, and soluble sugars levels of each plant part were evaluated. Also the essential oil from young leaves (6th to 8th node) and adult leaves (3rd to the 5th node) was analyzed. An uptake mechanism related to the increase in fresh weight of the roots was promoted with the use of low P levels (0.05 and 0.50 mmol∙L−1). With 1 mmol∙L−1 P plants showed in all parts an increased nitrate reductase activity and high levels of nitrate and amino-N in leaves. Plants submitted to the lowest P level (0.05 mmol∙L−1) presented high levels of menthol. In leaves from 6th to 8th node (mature leaves) menthol level was approximately 87% of the essential oil however leaves from the 3rd to the 5th node (young leaves) showed high levels of pulegone, that can be toxic for humans. The results indicate that the essential oil quality in menthol mint is influenced by the leaf maturity and the P levels. Also it was showed that the oil extracted from mature leaves of plants under low P levels has the best commercial profile.
Keywords:Mentha arvensis L., Lamiaceae, Gas Chromatography, Hydropony, Menthol

1. Introduction
The production of essential oil from menthol mint (Mentha arvensis L.) is the second largest of the world, reaching 18,000 tonnes by year [1] . Chemically, the essential oils of plants are composed mainly of terpenoids and also phenylpropanoids such as the monoterpenes that are generally the most abundant [2] . In menthol mint monoterpenes constitutes approximately 90% of the essential oil and menthol represents 70% - 95% of the monoterpenes (Figure 1) [3] .
In vegetal nutrition studies hydropony is a high utility tool since it allows that the nutrient supply be provided in an almost constant tax and an easier manipulation of nutrients compared with the conventional method [4] . Furthermore the use of nutrient solutions excludes some influence factors in metabolism, as soil-associated diseases and weeds [5] . Accordingly, the use of hydroponic system allows a more precise evaluation about interactions between nutrients and metabolic processes in plants.
Phosphorus is a nutrient largely used in energy transfer processes in cells, mainly as a component of ATP [6] . In plant nutrition, phosphorus (P) has been shown to be related with dry and fresh weight production and also in variations in the quality of essential oils of various aromatic species [7] . Thus, the aim of this study was to evaluate the effects of different levels of P in the nutrient solution in nitrogen metabolism and in the composition of essential oils of menthol mint plants.
2. Materials and Methods
2.1. General Informations and Seedling Production
Seedlings of menthol mint (Mentha arvensis L.) were propagated in a greenhouse at the Chemistry Department of Universidade Federal Rural do Rio de Janeiro (UFRRJ). Also, samples of the plants used in this experiment were subjected to herborization and registered in the herbarium (RBR) of the Botany Department of UFRRJ under number (RBR)-32886. The plants were produced from cuttings with approximately 15 cm in length of the middle third of the shoots treated with 2% sodium hypochlorite (10 min), washed with distilled water and fixed on polystyrene support. Two-thirds of the bottom of the cuttings were immersed in a nutrient solution modified with 15 mmol∙L−1  -N at 1/2 strength under constant aeration [8] . After two weeks, the seedlings were standardized by root size and number of leaves.
2.2. Description of the Hydroponic System and Treatments
The seedlings were placed in 2-cm Styrofoam plates thick with the help of synthetic foam and then placed on pots (1.8 L) connected by caliber flexible tubes to an electromagnetic air compressor (Resun, model OC-003) with a flow rate of 65 L∙min−1, programmed to 15 min of activity per hour. This hydroponic system was placed on benches of a growth chamber with photosynthetic photon density of 200 μmol∙m−2∙s−1 and a 12 h photoperiod at 25˚C. The plants were cultivated for 41 days in a nutrient solution modified with 15 mmol∙L−1  -N at 1/2 strength with different P doses, as described in Table 1 [8] . Every day, the pH of the nutrient solution was measured and adjusted to 5.8 and the volume was adjusted to 1.6 L per pot. The nutrient solution was replaced weekly.
2.3. Fresh Weight, Soluble Fractions and Nitrate Reductase Analyses
Roots, stems and leaves were separated and used for fresh weight analysis. Moreover 1 g samples from medianportion of each plant part (3rd and 4th nodes of leaves) were powdered in 10 mL of 80% ethanol, filtered, parti-

Figure 1. Structure of menthol.

Table 1. Composition of the nutrient solutions used for the cultivation of menthol mint (Mentha arvensis L.) during 41 days in growth chamber. A 1/2 strength nutrient solution [8] modified with 15 mmol L−1  -N was used as a source of other nutrients.
aChanges in the concentration of sulfur were produced as a result of variation in the P levels.
tioned with chloroform, and the hydro-alcoholic phase was completed to 50 mL with 80% ethanol. This phase was used for amino-N [9] ,  -N [10] , ammonium [11] and soluble sugar [12] analyses. Also 0.2 g samples from median portion of each plant part (4th node of leaves) were used for the analysis of nitrate reductase activity [13] .
2.4. Essential Oil Extraction and Analysis
Samples (3 g) from the upper leaves (3rd to 5th node) and lower leaves (6th to 8th node) were removed and immersed in 10 mL of dichloromethane for 48 h at 4˚C. After this period the samples were filtered, the organic phase dried with anhydrous Na2SO4 and the extracts stored in a freezer (−20˚C) for further analysis. A gas chromatograph (Hewlett-Packard 5890 Series II CA, USA) equipped with a flame ionization detection and a split/splitless injector, in a split ratio of 1:20 was used to separate and detect the constituents in the essential oil. The substances were separated into the fused silica capillary column CP-Sil-8CB [30 m × 0.25 mm (i.d.) × 0.25 μm (film thickness)]. Helium was used as the carrier gas at a flow rate of 1 mL∙min−1. The column temperature was programmed as follows: 60˚C for 2 min followed by heating at 5˚C∙min−1 to 110˚C, followed by heating at 3˚C∙min−1 to 150˚C and finally followed by heating at 15˚C∙min−1 until 290˚C and holding constant for 15 min. The injector temperature was 220˚C and the detector temperature was 280˚C.
The gas chromatography coupled with mass spectrometry (GC-MS) was used for the essential oil analysis using a Varian Saturn 2000 (Paolo Alto, CA). The flow of the helium gas carrier, the capillary column and the temperature conditions for the GC-MS analysis were the same as described for the GC. The temperature of the injector was 220˚C and the temperature of the interface was 250˚. Mass spectra were obtained with an ion trap detector operating at 70 eV, with 40 - 400 m/z mass range and scanning rate equal to 0.5 scan∙s−1. The identification of the oil constituents was based on comparisons of their GC retention indexes and their mass spectra with authentic standards [(−)-pulegone, (−)-menthone, (+)-neomenthol and (−)-menthol] from Sigma-Aldrich (USA), NIST database (2008) and retention index (RI) [14] . The RI was obtained from the co-injection of an alkane standard solution C8-C40 (Fluka, USA).
2.5. Experimental Design and Statistical
In the experiment each treatment was composed of four replicates arranged in a completely randomized experimental design and in each pot two plants were placed. The analysis of variance, standard deviation and the significance test (Fisher LSD, 5%) of the data were performed in SigmaStat 2.03 (Inc, Chicago, IL, USA). The Unscrambler® X version 0.0.0.42 was used for the principal component analysis (PCA) (©CAMO Software AS 2010, USA). The graphics were created in SigmaPlot 8.0 (Systat Software Inc., California, USA).
3. Results and Discussion
3.1. pH of the Nutrient Solutions
The variations in the pH of the nutrient solutions during the experiment showed two distinct phases (Figure 2(A)). In the first phase (from the 1st to 15th day) when the absorption of nutrients was not intense, an alkalinization of the nutrient solution was observed, always higher than the daily adjustment to pH 5.8. In the second phase (from the 16th to 41st) a strong variation in pH was observed, shifting from acid to alkaline depending on the elapsed time between the replacement of the nutrient solution. This unstable behavior may be associated with an increased influx of nutrients related to the growth of the root system.
The pH range which is suitable for a better development of crops generally lies between 5.5 and 5.8 and is mainly related to the availability of nutrients in the solution [15] . The pH of the nutrient solution undergoes con-
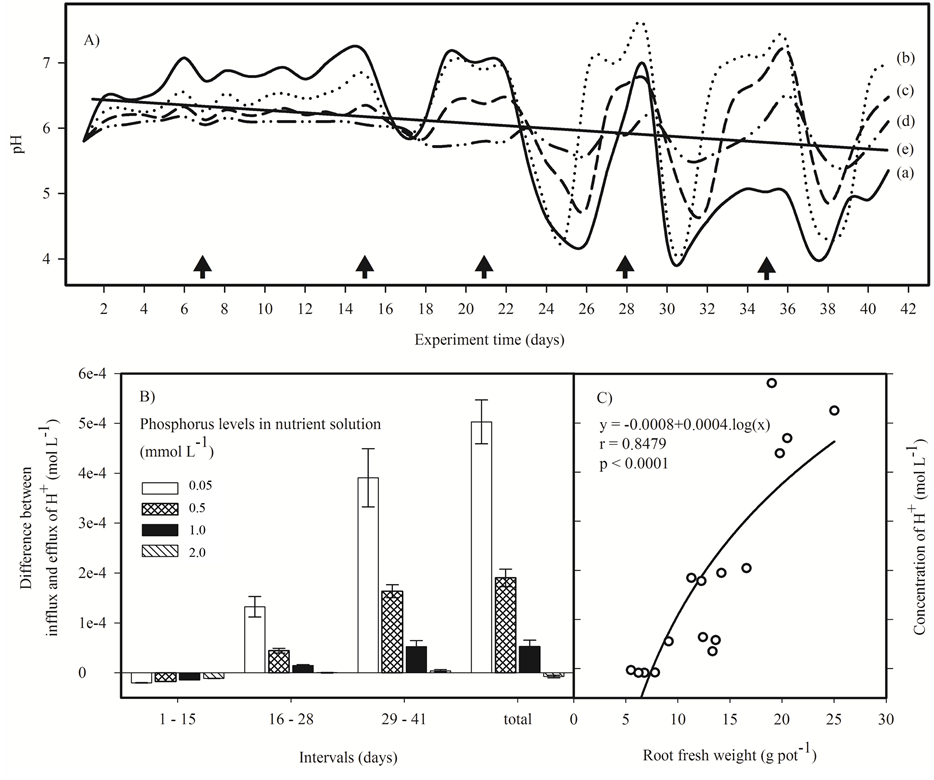
Figure 2. (A) pH values of the nutrient solutions with different levels of P during the cultivation of menthol mint (Mentha arvensis L.) for 41 days; lines (a) solid; (b) dotted; (c) dashed; (d) dotted-dashed respectively for 0.05, 0.50, 1.00 and 2.00 mmol∙L−1 of P in nutrient solutions and (e) linear regression of all points with r = 0.46 and P < 0.0001. Days when the nutrient solution was replaced are represented by ; (B) Difference between the infflux and efflux of H+; (C) Logarithmic correlation between the molar concentration of H+ in the nutrient solution and root production of menthol mint.
stant changes in response to the availability and influx of nutrients (symport or antiport) and the extrusion of H+ [16] . Thus, the early absorption of phosphate and nitrate anions, caused the alkalinization of the nutrient solution, while later the lower levels of nutrients induces a second phase of extrusion of H+ to the nutrient solution, leading to acidification of the nutrient solution. The intensity in which this pH oscillation occurs is the response of the plant to the availability of nutrients in the nutrient solution, as well as the demand that the plant exerts on them, as shown in Figure 2(A).
Nutrient solutions with lower P doses (0.05 and 0.50 mmol∙L−1), especially the 0.05 mmol∙L−1, showed a high variation in pH with a great tendency to acidification in the course the experiment (Figure 2(B)). Since P is a macronutrient highly demanded the plant uses mechanisms to increase its uptake as increasing the production of roots and the extrusion of H+, causing the acidification of the nutrient solution (Figure 2(C)) [16] .
3.2. Biomass Production
A negative correlation between the P levels in the nutrient solution and the mass production of the roots was also observed (Figure 3). This result can be related to the fact that plants under low P doses are stimulated to produce more roots increasing the absorption area [17] .
However, in studies with Mentha piperita L. an increase in roots production with the lower P dose in the nu-
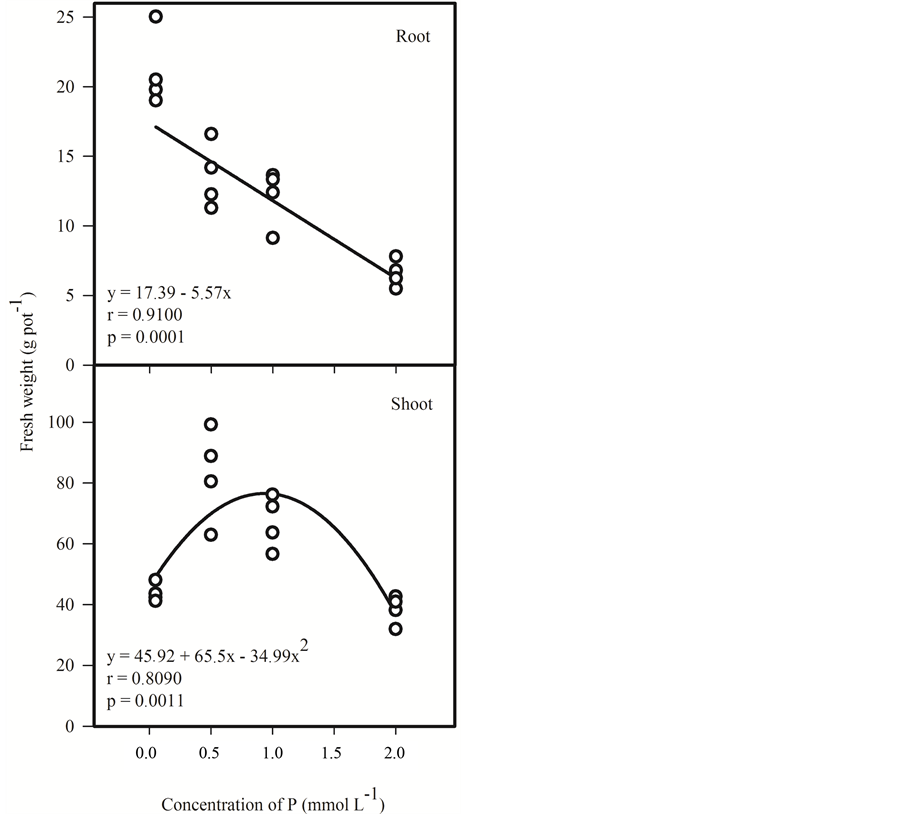
Figure 3. Correlation between fresh weight of roots and shoots of menthol mint (Mentha arvensis L.) under different levels of P (0.05, 0.5, 1 and 2 mmol∙L−1) in nutrient solution used in cultivation for 41 days.
trient solution was not observed [18] . It should be noted that the P dose at which the plants produced more shoot mass corresponds to only half of the higher P dose (2 mmol∙L−1) used in this research nutrient solution and in other solutions used in hydroponics for most crops [7] [19] -[21] .
The plants grown in nutrient solution with 2 mmol∙L−1 P had lower production of shoot weight and also showed early flowering and symptoms of toxicity (data not shown). Symptoms of toxicity caused by the excess in P are not well known [22] . However, it is known that above certain levels, this element causes nutritional antagonism [23] . Thus, the symptoms observed in plants under 2 mmol∙L−1 P may be associated with the deficiency of other nutrients or also by influence of pH in the uptake of other nutrients.
3.3. Nitrogen Metabolism
The lowest percentage of soluble sugars was found in roots, stems and leaves of plants under 0.5 mmol∙L−1 P (Figure 4(A)). However, the roots and leaves of these plants showed high contents of nitrate (Figure 4(B)). The leaves of plants under 0.5 and 1 mmol∙L−1 P showed high levels of nitrate and amino-N (Figure 4(B) and Figure 4(C)).
The stem was the main site of nitrate accumulation in menthol mint (Figure 4(B)). In a previous study with plants of Mentha piperita was also observed that stem is the preferential organ for storage of this nutrient [7] . The nitrate accumulation in stem may be a plant evolutionary strategy to prevent the excess of nitrate in the leaves and to maintain the N supply for biochemical activities in low availability periods [15] [24] [25] .
A higher nitrate reductase activity was detected in leaves of menthol mint plants. Plants under 0.5 and 1 mmol∙L−1 P showed high nitrate reductase activity in roots and leaves (Figure 4(D)). Moreover, plants submitted to 1 and 2 mmol∙L−1 P showed the highest activities of nitrate reductase in stem.
3.4. Essential Oil Composition and Principal Components Analysis (PCA)
Results showed in Table 2 indicate that high levels of menthol were obtained from menthol mint plants submitted to the lowest P level (0.05 mmol∙L−1). To a better evaluation of the effect of the different P levels and position of the leaves over the chemical profile of the essential oil, a principal components analysis (PCA) was performed based on the percentages of the substances identified by GC-MS. This analysis provided a doublegraphic of scores and loadings where the formation of clusters can be observed (Figure 5).
The analysis of the principal components revealed that the difference in maturity of the leaves is mainly represent for PC-1, with 48% of the total variability found in the chemical composition of the essential oils, while PC-2 with 22% of the variability, discriminate mainly the effect of different levels of P on essential oil composition (Figure 5).
Considering the distribution of the samples as a function of PC-1, it was found that the samples of essential oils extracted from young leaves in the left of the quadrant and extracted from mature leaves were grouped together in the right of the quadrant in Figure 5, between menthol and p-cymene, which contributed to the formation of this larger grouping. The PC-2 discriminated between the formation of cluster 1 with the higher levels of menthol and cluster 2 with the higher content of p-cymene.
In the left quadrant of Figure 5 the samples were grouped only as a function of PC-2. In the upper left a greater presence of pulegone and menthone contributed to the formation of cluster 4, while in the lower left quadrant the presence of isomenthone contributed to the formation of clusters 3 and 5. However, cluster 5 showed lower contents of menthone and menthol and cluster 6 presented intermediate levels of substances that constitute the oil from menthol mint.
Also can be observed that the leaves from the 6th to the 8th node (mature leaves) showed an essential oil profile with more menthol than the essential oil from leaves from the 3rd to the 5th node (young leaves) (Figure 5 and Table 3). This result indicates that the essential oil for mature leaves have the best commercial quality [3] . On the other hand, higher levels of ketone monoterpenes (pulegone, menthone and isomenthone) in the leaves from the 3rd to the 5th node (young leaves) is an indication that the essential oil has not matured, since those substances are intermediates in the biosynthesis of menthol [26] . In addition, a higher level of pulegone in the essential oil of leaves from the 3rd to the 5th node (young leaves) decreases the oil quality [27] .
The leaves of plants in the genus Mentha have an age difference between the nodes of about 2.4 days [28] . Since the mature leaves are shaded, there may be a synergism caused by age and light intensity on the quality of essential oils. However, the age of the leaves seems to be a more plausible answer to explain the increase in the
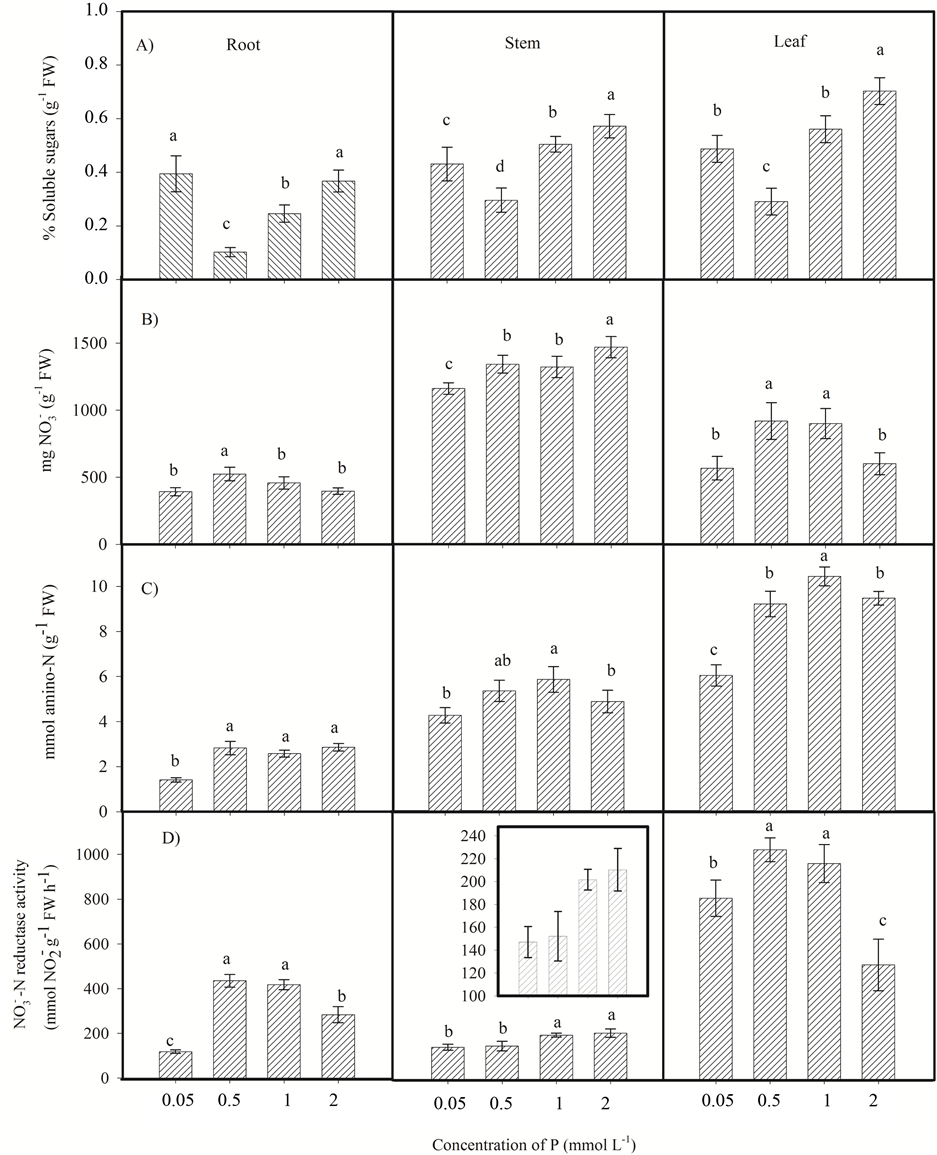
Figure 4. Soluble sugars (A); nitrate (B); amino-N (C); and nitrate reductase activity (D) in roots, stems and leaves of menthol mint (Mentha arvensis L.) cultivated for 41 days in nutrient solution with different P levels (0.05, 0.5, 1 and 2 mmol∙L−1). Different letters in the same plant part indicate significant difference (Fisher LSD, 5%). The bars represent the standard deviation.
concentration of menthol in the mature leaves observed in Figure 5, since that a significant production of menthol occurs late, at around 40 days after initiation of leaves and with a maximum increase of 2% menthol per day
Table 2 . Percentages of the substances in the essential oil extracted from leaves of menthol mint (Mentha arvensis L.) plants cultivated under different P levels (0.05, 0.5, 1 and 2 mmol∙L−1) during 41 days in hydroponic system.
aα = 0.95. bRT = retention time. cKI = Kovats retention index (Adams, 1995). dRI = retention index.
Table 3. Percentages of the substances in the essential oil extracted from leaves at different positions of menthol mint (Mentha arvensis L.) plants cultivated under different P levels (0.05, 0.5, 1 and 2 mmol∙L−1) during 41 days in hydroponic system.
aα = 0.95. bRT = retention time. cKI = Kovats retention index (Adams, 1995). dRI = retention index.
after 30 days of leaf emergence [29] .
4. Conclusion
Results showed that low P levels (0.05 and 0.50 mmol∙L−1) stimulated an uptake mechanism related to the increase in fresh weight of the roots and H+ extrusion in menthol mint plants. With 1 mmol∙L−1 P plants showed high levels of nitrate and amino-N in leaves and an increased nitrate reductase activity in all plant parts. This activity presented a negative correlation with the soluble sugars levels. High levels of menthol were obtained from plants submitted to the lowest P level (0.05 mmol∙L−1). In fact, menthol was the main component of the menthol mint oil, with approximately 87% in leaves from 6th to 8th node (mature leaves). However, leaves from the 3rd to the 5th node (young leaves) presented high levels of pulegone which presents a potential for toxicity to humans. Therefore, these results indicate that the harvesting period of menthol mint has a significant influence on its quality and that the essential oil from mature leaves has the best commercial profile.
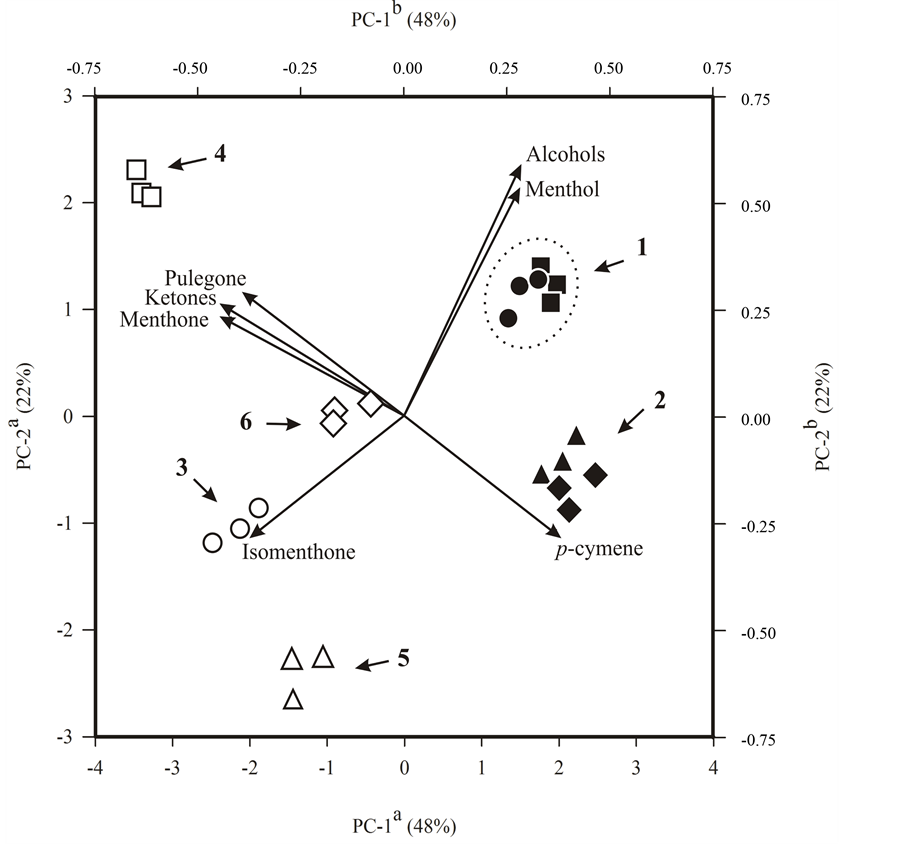
Figure 5. Principal component scatterplot of menthol mint (Mentha arvensis L.) cultivated for 41 days in hydroponic system with different P levels in nutrient solution. aAxes referring to 24 essential oil samples divided into four treatments with two cutting heights (scores) and represented by symbols as follows: nutrient solution with 0.05, 0.5, 1 and 2 mmol∙L−1 P, respectively for (š, ˜); (£, ¢); (r, ▲) and (¯, ◆) of which the white and black symbols represent, respectively, leaves of 3rd to the 5th node and leaves of 6rd to the 8th node; bAxes referring to nine discriminant variables related to chromatographic profile (loadings) and represented as vectors from the origin. Arrows show the different clusters and the dotted line highlights the cluster with higher content of menthol in the essential oil. PC-1 and PC-2 represent respectively 48% and 22% of the total explained variance.
Acknowledgements
The authors acknowledge the financial support provided by Conselho Nacional de Desenvolvimento Científico e Tecnológico (CNPq), FAPERJ and CAPES. Technical support was provided by the Programa de Pós-Graduação em Química-UFRRJ.
References
- Sanganeria, S. (2005) Vibrant India—Opportunities for the Flavor and Fragrance Industry. Perfumer and Flavorist, 30, 24-34.
- Sangwan, N.S., Farooqi, A.H.A., Shabih, F. and Sangwan, R.S. (2001) Regulation of Essential Oil Production in Plants. Plant Growth Regulation, 34, 3-21. http://dx.doi.org/10.1023/A:1013386921596
- Srivastava, R.K., Singh, A.K., Kalra, A.V., Tomar, K.S.R., Bansal, P., Patra, D.D., Chand, S., Naqvi, A.A., Sharma, S. and Kumar, S. (2002) Characteristics of Mentha arvensis Cultivated on Industrial Scale in the Indo-Gangetic Plains. Industrial Crops and Products, 15, 189-198. http://dx.doi.org/10.1016/S0926-6690(01)00113-3
- Baligar, V.C. (1986) Interrelationships between Growth and Nutrient Uptake in Alfafa and Corn. Journal of Plant Nutrition, 9, 1391-1404. http://dx.doi.org/10.1080/01904168609363536
- Sheikh, B.A. (2006) Hydroponics: Key to Sustain Agriculture in Water Stressed and Urban Environment. Pakistan Journal of Agriculture, Agricultural Engineering and Veterinary Sciences, 22, 53-57.
- Araújo, A.P. and Machado, C.T.T. (2006) Fósforo. In: Fernandes, M.S., Ed., Nutriç ão Mineral de Plantas, Sociedade Brasileira de Ciência do Solo, Viç osa, 215-252.
- Souza, M.A.A., Araújo, O.J.L., Ferreira, M.A., Stark, E.M.L.M., Fernandes, M.S. and Souza, S.R. (2007) Produç ão de Biomassa e óleo Essencial de Hortelã em Hidroponia em Funç ão de Nitrogênio e Fósforo. Horticultura Brasileira, 25, 41-48. http://dx.doi.org/10.1590/S0102-05362007000100009
- Hoagland, D.R. and Arnon, D.I. (1950) The Water-Culture Method for Growing Plants without Soil. California Agricultural of Experimental, 347, 1-32.
- Yemm, E.W.E. and Cocking, E.C. (1955) The Determination of Amino-Acid with Ninhydrin. Analytical Biochemistry, 80, 209-213.
- Cataldo, D., Harron, M., Scharader, L.E.E. and Youngs, V.L. (1975) Rapid Colorimetric Determination of Nitrate in Plant Tissue by Nitration of Salicylic Acid. Communication in Soil Science and Plant Analysis, 6, 853-855. http://dx.doi.org/10.1080/00103627509366547
- Felker, P. (1977) Micro Determination of Nitrogen in Seed Protein Extracts. Analytical Chemistry, 49, 1080-1080. http://dx.doi.org/10.1021/ac50015a053
- Yemm, E.W.E. and Willis, A.J. (1954) The Estimation of Carbohydrate in Plants Extracts by Anthrone. Biochemistry, 57, 508-514.
- Jaworski, E.G. (1971) Nitrate Reductase Assay in Intact Plant Tissues. Biochemical Biophysical Research Communication, 43, 1274-1279. http://dx.doi.org/10.1016/S0006-291X(71)80010-4
- Adams, R.P. (1995) Identification of Essential Oil Components by Gas Chromatography—Mass Spectroscopy. Allured Publishing, New York.
- Cometti, N.N., Furlani, P.R., Ruiz, P.R. and Fernandes, E.I.F. (2006) Soluç ões Nutritivas: Formulaç ão e Aplicaç ões. In: Fernandes, M.S., Ed., Nutriç ão Mineral de Plantas, Sociedade Brasileira de Ciência do Solo, Viç osa, 89-114.
- Fernandes, M.S. and Souza, S.R. (2006) Absorç ão de Nutrientes. In: Fernandes, M.S., Ed., Nutriç ão Mineral de Plantas, Sociedade Brasileira de Ciência do Solo, Viç osa, BR, 115-152.
- Epstein, E. and Bloom, A.J. (2005) Mineral Nutrition of Plants: Principles and Perspectives. Sinauer Associates Inc., Massachusetts.
- Rodrigues, C.R., Faquin, V., Trevisan, D., Pinto, J.E.B.P., Bertolucci, S.K.V., Rodrigues, T.M. (2004) Nutriç ão Mineral, Crescimento e Teor de óleo Essencial da Menta em Soluç ão Nutritiva sob Diferentes Concentraç ões de Fósforo e épocas de Coleta. Horticultura Brasileira, 22, 573-578. http://dx.doi.org/10.1590/S0102-05362004000300014
- Resh, H.M. (2004) Hydroponic Food Production: A Definitive Guidebook for the Advanced Home Gardener and the Commercial Hydroponic Grower. CRC Press, New Jersey.
- Haber, L.L., Luz, J.M.Q., Arvati, L.F.D. and Santos, J.E. (2005) Diferentes Concentraç ões de Soluç ão Nutritiva para o Cultivo de Mentha piperita e Melissa officinalis. Horticultura Brasileira, 23, 1006-1009. http://dx.doi.org/10.1590/S0102-05362005000400029
- Garlet, T.M.B., Santos, O.S., Medeiros, S.L.P., Garcia, D.C., Manfron, P.A. and Apel, M.A. (2007) Produç ão de Folhas, Teor e Qualidade do óleo Essencial de Hortelã-Japonesa (Mentha arvensis L. forma piperascens Holmes) Cultivada em Hidroponia. Revista Brasileira de Plantas Medicinais, 9, 72-79.
- Ceconi, D.E., Poletto, I., Lovato, T. and Muniz, M.F.B. (2007) Exigência Nutricional de Mudas de Erva-Mate (Ilex Paraguariensis A. St.-Hil.) à Adubaç ão Fosfatada. Ciência Florestal, 17, 25-32.
- Mota, J.H., Yuri, J.E., Resende, G.M., Oliveira, C.M., Souza, R.J., Freitas, S.A.C. and Rodrigues, J.C.J. (2003) Produç ão de Alface Americana em Funç ão da Aplicaç ão de Doses e Fontes de Fósforo. Horticultura Brasileira, 21, 620-622. http://dx.doi.org/10.1590/S0102-05362003000400008
- Hirel, B., Le Gouis, J., Ney, B. and Gallais, A. (2007) The Challenge of Improving Nitrogen Use Efficiency in Crop Plants: Towards a More Central Role for Genetic Variability and Quantitative Genetics within Integrated Approaches. Journal of Experimental Botany, 58, 1-19. http://dx.doi.org/10.1093/jxb/erm097
- Fageria, N.K., Baligar, V.C. and Li, Y.C. (2008) The Role of Nutrient Efficient Plants in Improving Crop Yields in the Twenty First Century. Journal of Plant Nutrition, 31, 1121-1157. http://dx.doi.org/10.1080/01904160802116068
- Croteau, R.B., Davis, E.M., Ringer, K.L. and Wildung, E.M. (2005) (-)-Menthol Biosynthesis and Molecular Genetics. Naturwissenschaften, 92, 62-577. http://dx.doi.org/10.1007/s00114-005-0055-0
- Mahmoud, S.S. and Croteau, R.B. (2003) Menthofuran Regulates Essential Oil Biosynthesis in Peppermint by Controlling a Downstream Monoterpene Reductase. Proceedings of the National Academy of Sciences of the United States of America, 100, 14481-14486. http://dx.doi.org/10.1073/pnas.2436325100
- Turner, G.W., Gershenzon, J.E. and Croteau, R.B. (2000) Development of Peltate Glandular Trichomes of Peppermint. Plant Physiology, 124, 665-680. http://dx.doi.org/10.1104/pp.124.2.665
- Davis, E.D., Ringer, K.L., McConkey, M.E. and Croteau, R. (2005) Monoterpene Metabolism. Cloning, Expression and Characterization of Menthone Reductases from Peppermint. Plant Physiology, 137, 873-881. http://dx.doi.org/10.1104/pp.104.053306
NOTES

*Corresponding author.