American Journal of Plant Sciences
Vol.3 No.2(2012), Article ID:17586,7 pages DOI:10.4236/ajps.2012.32033
The Effects of Silvicultural Thinning and Lymantria dispar L. Defoliation on Wood Volume Growth of Quercus spp.
![]()
USDA Forest Service, Northern Research Station, Morgantown, USA.
Email: mfajvan@fs.fed.us
Received October 27th, 2011; revised December 15th, 2011; accepted December 22nd, 2011
Keywords: Wood Volume Increment; Low Thinning; Gypsy Moth; Oaks
ABSTRACT
Preand post-defoliation radial growth rates were used to examine the effects of silvicultural thinning and two consecutive years of gypsy moth (Lymantria dispar L.) defoliation on Quercus spp. wood volume production. In the first phase of the study, tree rings from 65 dissected stems, were used to develop polynomial models to estimate annual cumulative volume (m3) increment for the entire merchantable stem, as a function of dbh (tree diameter at 1.37 m above the ground). In Phase II of the study, 81 additional trees were sampled using only increment cores. Cumulative diameter increments from the cores were used in the polynomial models to compare tree volume growth changes during and after defoliation among the thinning treatments. Even though there was no significant difference in estimated volume lost during defoliation among treatments, post-defoliation growth was enhanced by thinning. Total volume reduction from defoliation ranged from 28,049 (±17,462) cm3 to 25,993 (±16,251) cm3 per tree. The stand receiving the thinning treatment with the lowest residual stocking produced significantly more volume (P = 0.002) after defoliation than the other treatments.
1. Introduction
The gypsy moth (Lymantria dispar L.) annually defoliates millions of forested acres throughout much of the oak (Quercus spp.) range in the eastern United States. The insect is native to Europe and Asia but an accidental introduction to the United States occurred during the late 1860s. Defoliation is caused by feeding of gypsy moth larvae for about 8 weeks during the spring and early summer, and many environmental factors contribute to annual fluctuations in insect densities [1]. During periods of rapid population explosions, several years of complete defoliation of preferred hosts, such as oaks (Quercus spp.), can be expected [2]. Stands with a high proportion of oaks are susceptible to heavy defoliation, localized higher mortality, growth decline, and reductions in wood quality and yield [1-3]. Factors that influence the amount of growth decline or mortality include: the interaction of canopy position and tree vigor before defoliation; the intensity, duration and frequency of defoliation; climatic variables (e.g. drought); and the presence of secondaryaction organisms (e.g. Armillaria spp., Agrilus bilineatus (Weber)) [2,4-11].
Because gypsy moth defoliations reduce foliage an indeterminate amount, the effect of defoliation on cambial production is difficult to quantify, hence the growth potential lost during an outbreak is unknown. The wood of oaks is defined as ring-porous and in many species, earlywood (EW) tends to be less variable in width and less influenced by growing conditions than is latewood (LW) [12-14]. In the spring, developing foliage and EW are supported by photosynthates stored from the previous year. Therefore, declines in annual ring width from defoliation are largely the result of decreased LW formation [15].
The amount of radial increment reduction during the year(s) of defoliation is proportional to defoliation intensity and duration. In order to measure the effect of defoliation on wood volume production, most studies assess changes in the amount of radial or basal area growth at breast height (1.37 m above the ground) [6,9,16-20]. Volume loss during the years of defoliation can then be calculated using standard volume equations based on changes in diameter at breast height (dbh) [21]. However, such an approach overlooks any change in wood distribution throughout the stem that was induced by defoliation. Growth losses also persist from one year following a defoliation event [19,22-25] to up to three years [26-29], which is partly attributable to oaks determinate growth form [30,31], timing of the defoliation event, and depletion of root starch reserves [32,33]. Studies that actually compare volume growth rates of trees before, during and after gypsy moth outbreaks are rare [28,29].
During defoliation, the lower bole of oaks loses a greater proportion of wood volume than do upper stem logs [28,29]. Physiologically, the upper bole shows a lesser decrease because there is an acropetal shift in wood distribution during years of low production; therefore growth does not decrease as much here during defoliation. Both EW and LW increment are reduced during defoliation but LW is reduced equally along the entire stem and EW is more reduced on upper stem sections [29]. The transition to LW cells first occurs at the base of the tree and moves acropetally [34]. Whereas, EW production continues longer into the growing season in upper stem sections within the crown driven by diffusible auxin produced by expanding shoots. Defoliation in early summer disrupts this latter auxin production and reduces EW production in the crown first. Hence, defoliation potentially affects the wood strength properties in upper stem logs more than in the lower (typically more economically valuable) logs.
Silvicultural thinning can be used to improve growing conditions in an attempt to minimize growth loss and mortality during defoliation, and increase site resources and hence growth rate to residual trees after defoliation [3]. In Phase I of our study, we used stem dissection and dendroecological techniques to estimate the total merchantable stem volume lost during gypsy moth defoliation. We devised polynomial models for estimating total merchantable stem volume increment as a function of dbh for red oak (Quercus rubra L.) and white oaks (Quercus alba L., Quercus prinus L. or Quercus montana Willd.) [29]. A total of sixty-five trees with a history of gypsy moth defoliation, were destructively sampled from 3 stands representing two thinning treatments, and a reference stand. In Phase II of the study, reported here, we analyzed data from increment cores, which were collected at the same time as the trees were harvested for Phase I. Hence, the objective of Phase II was to use the increment-core ring measurements in the whole-stem models to perform comparisons of wood volume changes in thinned and reference stands before, during, and after gypsy moth defoliation.
2. Methods
2.1. Study Area
The study area is located on privately owned forestland in Clinton County Pennsylvania near the town of Keating. In 1981, during the height of a gypsy moth defoliation event, a 60 year-old mixed-oak stand received intermediate silvicultural treatments to reduce tree susceptibility to gypsy moth defoliation by removing trees of low vigor. Three 160.9 m × 181.0 m (2.9 ha) treatment areas (referred to as Stands 3, 4, 5) were established adjacent to each other on a southwest aspect. Each stand was 100 percent stocked [35]. Nested within each treatment area was an 80.5 m × 100.6 m (0.81 ha) measurement plot. Prior to treatment, all trees >1.25 cm diameter at breast height (dbh, diameter at 1.37 m above ground) were numbered, tagged and tallied according to species, dbh and crown class [36].
Stand 4 received a low thinning that removed trees from overtopped, intermediate and weak codominant crown classes and left a stand that was 69 percent stocked [35]. Stand 3 received a similar treatment combined with a timber stand improvement (TSI) operation to cut noncommercial-size stems between 5.0 and 11.5 cm dbh. Because of the additional TSI operation, residual stocking was lowered to 58 percent, which is closer to the recommended stocking level (60 percent) for best growth [35]. Stand 5 did not receive a treatment, was overstocked at 103 percent, and served as the reference stand. The stands were defoliated by gypsy moth in 1981 and 1982, during one of the most widespread, severe outbreaks to date, with 106,000 km2 defoliated [37]. During the inventories associated with the outbreak years, tree crowns were visually evaluated and assigned to a defoliation severity class: Class 1 = 0% - 25% defoliation, Class 2 = 26% - 50%, Class 3 = 51% - 75% and Class 4 = 76% - 100%. The percentage of basal area lost to mortality was around 22 percent for both Stands 4 and 5, and 19 percent for Stand 3.
In 1987, single increment cores were collected at breast height from 81 oaks (27 in each stand) that were systematically, randomly selected proportional to the diameters of those trees used in the models developed during Phase I [29]. Sample trees from both phases of the study, ranged in diameter from 25 – 41 cm, with 70 percent of the white oaks, and 50 percent of the red oaks in the 25 cm - 30 cm dbh range. In addition, all trees sampled had to have an original crown class designation (in 1981) of either dominant or codominant, which was representative of the most vigorous trees in each stand. Cores were air-dried and sanded. Ring widths were measured to the nearest 0.001 mm using a dissecting microscope in conjunction with J2X software [38]. EW and LW widths were also qualitatively differentiated by vessel size, density and distribution, and measured on all rings. The basis for distinguishing EW and LW was wood color and change in vessel size. Annual tree-ring date assignments were validated using the COFECHA program [39]. This program estimates a master chronology for each site by cross-dating ring-width patterns of 50-year segments lagged successively by 25 years. All increment cores satisfactorily correlated to the Master chronology ( r < 0.3281, 99% confidence level) for years 1976-1987 (5 years preand post-defoliation). Because the treatment blocks are not replicated, each sample tree is considered an independent observation or replicate, nested within each treatment. The variance associated with each observation describes growth patterns associated only with this particular site.
2.2. Analyses
The whole-tree, polynomial volume models developed for each stand [29] were used to estimate annual cumulative merchantable volume (m3) as a function of the cumulative diameter increments obtained from the increment cores. The annual diameter growth (mm) for years 1976-1980 (5 years pre-defoliation) was averaged for each tree to create an “average annual pre-defoliation growth rate”. This constant rate was then used to annually increase volume for the years 1981-1983, which included the two defoliation years (1981-1982) and the subsequent year (1983), when actual volume growth had been lower than predicted because of slow recovery from defoliation [29]. We then calculated the difference between the predicted and actual volume increment for the years 1981-1983 (defoliation) for each stand to estimate the volume lost to defoliation. General linear model analysis of variance (ANOVA) was used to compare the dependent variable “volume lost to defoliation” according to thinning treatment. We also used ANOVA to compare the post-defoliation (1984-1987) volume produced in each stand to test whether thinning had an effect on growth recovery. Duncan’s multiple range test was used for comparisons if the F-statistic was significant.
A multivariate ANOVA was used to compare mean annual volume increment, EW and LW volume increments, and the proportion of EW to LW volume increment (EW:LW) for three time periods: 1975-1980 = predefoliation, 1981-1983 = defoliation and 1984-1987 = post defoliation. Harvest treatments (Stands 3, 4, 5) and species (red vs white oaks) were viewed as separate, correlated dependent variables. All statistical calculations were performed using Statistical Analysis Systems software [40].
3. Results
Regardless of treatment, total volume produced during defoliation (1981-1983) was significantly lower for both species compared to growth before and after defoliation (Figure 1). Even though growth was significantly reduced for both species, red oak volume increments were higher than white oak during the defoliation years (P < 0.0001). Mean volume loss during defoliation did not differ among the three treatments, averaging around a 63 percent volume reduction for each stand (Table 1). However, significant growth differences were noted during the period after defoliation (1984-1987). Post-defoliation average annual volume growth was over 30 percent higher than pre-defoliation growth for all stands. There was also a growth difference between treatments. Stand 3 produced significantly more volume (P = 0.002), for the post-defoliation period than stands 4 and 5 (Table 1). Untreated stand 5 had higher basal area loss from mortality (5.1 m2/ha) than thinned stand 4 (3.8 m2/ha). Stand 3 had the lowest mortality (2.8 m2/ha) probably because the TSI operation had removed additional, unhealthy trees that were more likely to succumb to the stress of defoliation. Immediately after harvest, the stocking in stand 3 was 58 percent and fluctuated from a low of 51 percent in 1983 to 62 percent in 1986. Stand 4 had a post-harvest stocking of 69 percent, hit a low point of 58
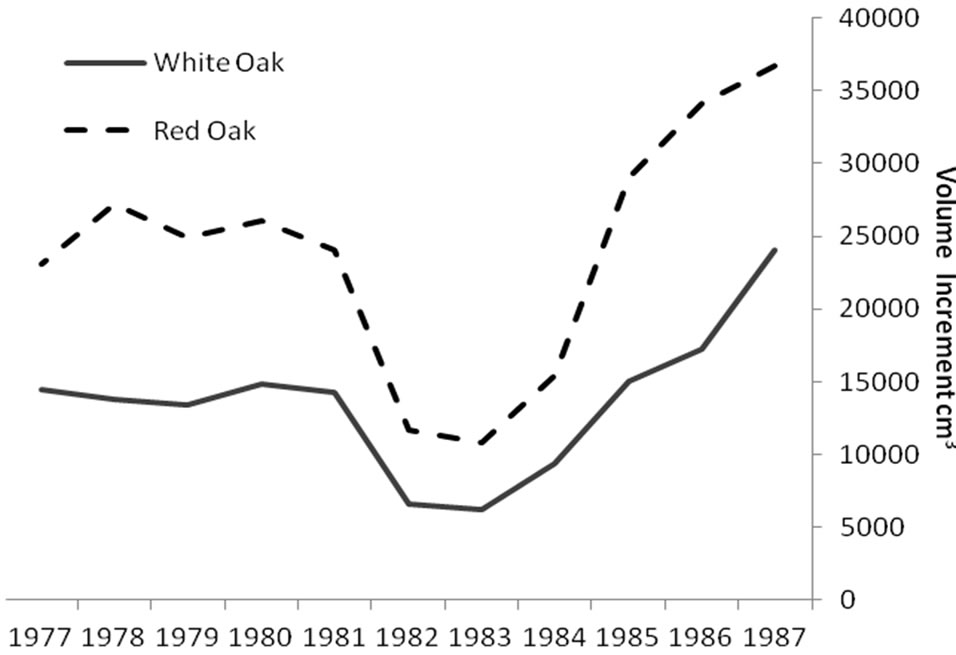
Figure 1. Annual rate of cumulative merchantable volume production for red (n = 33) and white oaks (n = 48): before, during (1981-1983) and after gypsy moth defoliation. During the defoliation period, total volume produced was significantly lower for both species but red oak volume increments were higher than white oak (P < 0.0001).
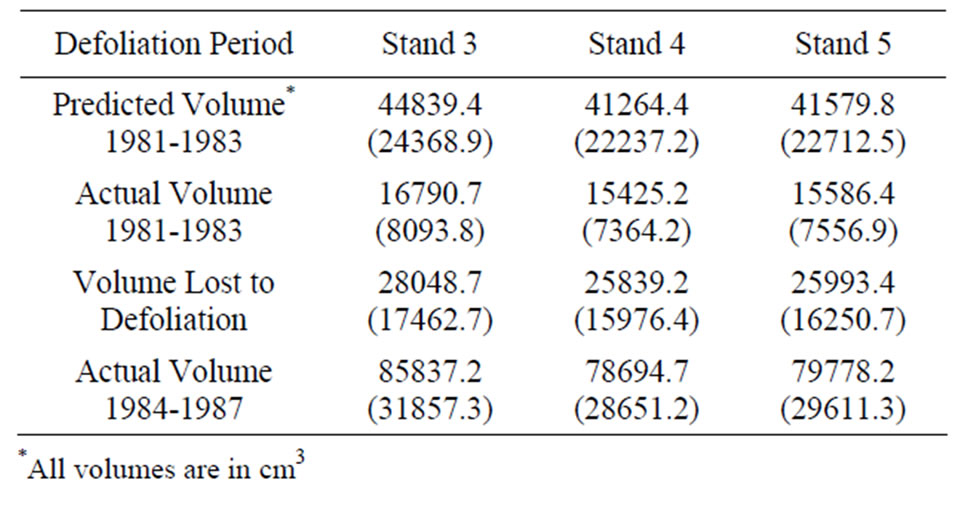
Table 1. The difference between the predicted total mean volume (based on pre-defoliation annual volume increments) and actual total mean volume increment for the years 1981-1983 (defoliation) and 1984-1987 (post-defoliation) for 27 oaks in each stand to estimate the volume lost to defoliation. Standard errors are in parenthesis.
percent in 1983 and quickly reached 71 percent by 1984. By 1986, stand 4 stocking was approaching 80 percent and Stand 5 had been over 100 percent since 1984.
Significant differences were identified in mean total volume increment, and mean volume increment of EW and LW, according to defoliation period and species (P < 0.0001 unless otherwise indicated). Total volume increment, and EW (P = 0.003) and LW volume increments added during defoliation years were always lower than preand post-defoliation. Red oak total volume (Figure 1) and EW volume increments (Figure 2) were higher than white oak. The EW:LW ratio was always higher during defoliation for both species (Figure 3). In 1981, all trees were classified as >75 percent defoliated (Class 4). By the 1982 growing season, 21 trees remained in this class, 10 trees were classified as having 0 - 25 percent defoliation, and the rest had 26 - 75 percent defoliation.
4. Discussion
Silvicultural thinning did not affect the amount of volume lost from surviving trees, during two years of gypsy moth defoliation. However, thinning probably contributed
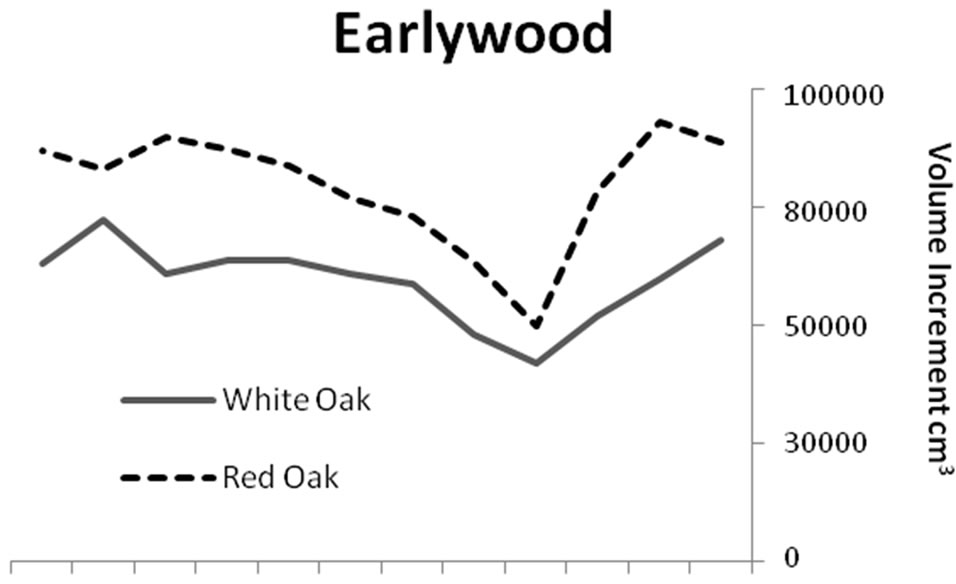
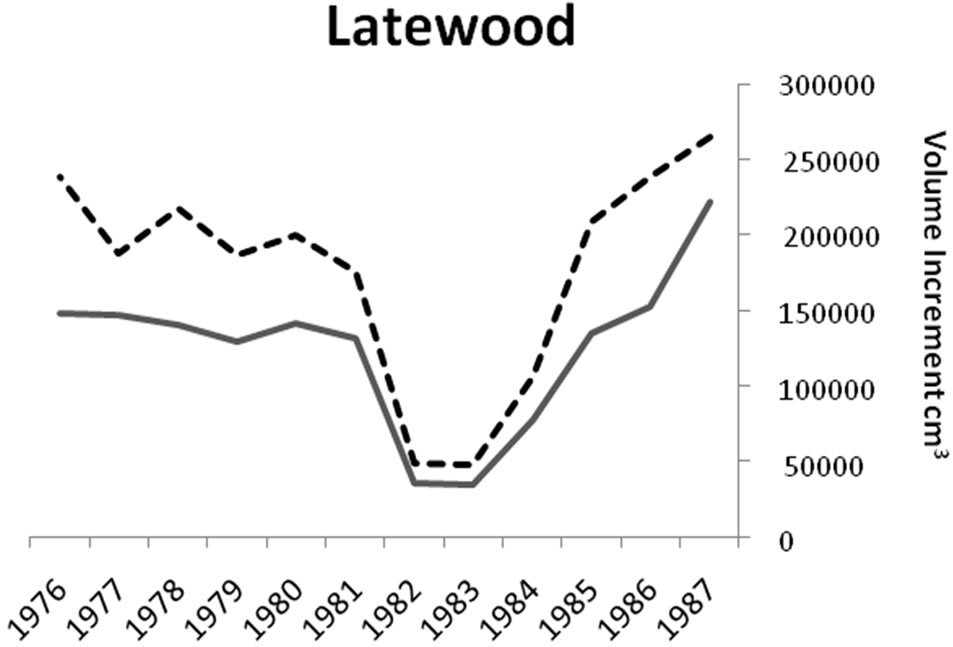
Figure 2. Comparisons of earlywood and latewood volume increments for red (n = 33) and white oaks (n = 48). Red oak total volume and earlywood volume increments were higher (P < 0.0001) than white oak for all time periods.
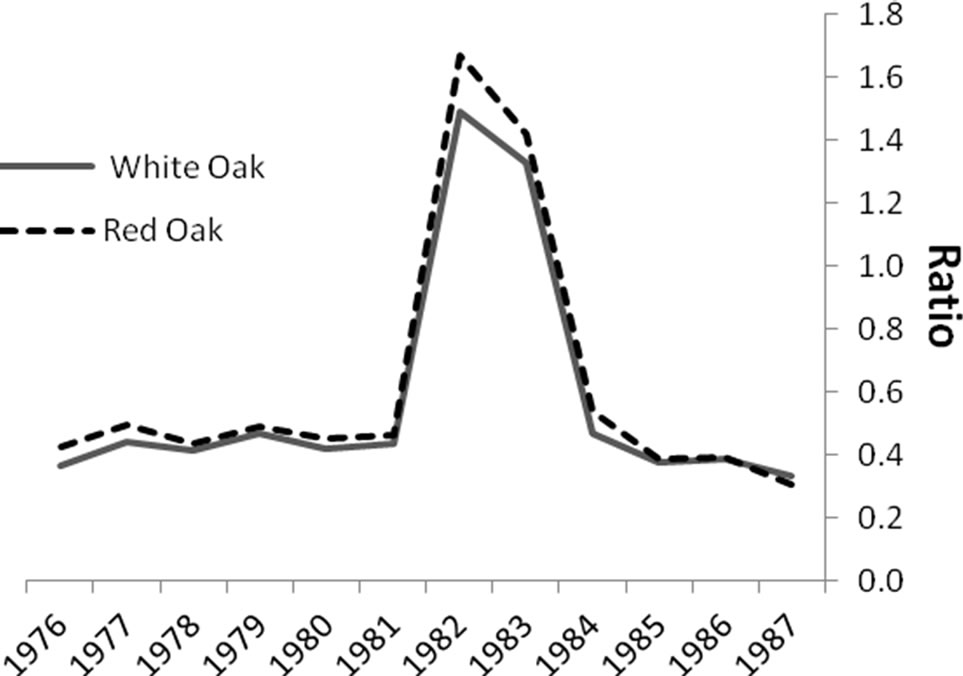
Figure 3. Comparisons of the ratios of earlywood to latewood (EW:LW) volume increment before, during (1981- 1983) and after gypsy moth defoliation. The ratio was always higher (P < 0.0001) during defoliation.
to post-defoliation growth increases in Stands 3 and 4 from reductions in stand density. In Stand 5, approximately 20 percent of the basal area was lost to mortality, which influenced post-defoliation growth increases. The goal of the thinning was to reallocate site resources to fewer stems, improve tree vigor prior to defoliation and decrease growth (volume) loss and mortality [3]. During the thinning operations, the healthiest overstory oaks in Stands 3 and 4 were selected for partial to full crown release. Unfortunately, because the thinning treatments occurred simultaneously with the first year of the outbreak, residual trees could not benefit from the additional site resources and anticipated vigor increases prior to defoliation. It is therefore not surprising that the volume lost during defoliation was similar among the stands/ treatments.
In Stands 3 and 4, the process of thinning removed less vigorous intermediate and overtopped trees. Without thinning, Stand 5 had more, low vigor trees before defoliation and stand density was above 100 percent stocking. During 1983, mortality reduced stocking to 89 percent, which increased to 105 percent by 1984. In Stand 5, most of the mortality occurred in stressed, overtopped and intermediate trees because physiological condition at the time of defoliation is the greatest contributor to mortality [1].
The additional TSI treatment in Stand 3 resulted in 95 fewer trees on the treatment area compared to Stand 4. With approximately equal losses to mortality, this difference still existed in 1986. In hardwood stands in northeastern North America, maximum individual tree growth occurs at about 30 percent stocking and individualtree growth benefits continue to accrue until densities approach 60 percent, or full stocking, where net growth equals gross growth [35]. As densities increase beyond 60 percent, competition begins to limit individual tree diameter growth until mortality becomes substantial above 80 percent stocking, and net growth drops signifycantly. Reductions in stand density from thinning and/or natural mortality increases physical growing space for crown expansion of residual trees, as well as increasing the availability of other site resources (e.g. light, water nutrients) [4-44]. The thinning treatments in this study targeted the removal of low vigor trees with smaller crowns and less stem taper. From 1981-1986, Stand 3 stocking remained at or below the 60 percent threshold for optimum growth. Except for 1983, Stand 4 stocking was always between 70 - 80 percent, possibly explaining why post-defoliation growth was more similar to Stand 5.
Most of the wood product volume and value in a typical Appalachian oak stand is concentrated in the largest, most dominant trees with the best stem form, especially if the stands are thinned [41]. Trees in dominant and codominant crown classes continue cambial activity longer than intermediate and overtopped trees of the same species and on the same site [42]. Both red and white oaks have shown increased diameter growth rates if their crowns are released from direct competition with adjacent trees [41-43]. Significant diameter growth rate increases are possible in crown-released older (50+ years) oaks, especially if the trees are in codominant/dominant canopy positions [44]. Post-thinning and post-defoliation stocking in Stand 3 remained within recommended limits to maximize growth. Stocking in Stand 4 was always higher, even with mortality.
Our study indicated that both EW and LW increment were reduced during defoliation, and red oaks were more affected than white oaks. During an average growing season mean ring widths for red oaks are typically greater than white oaks growing in the same sites [44]. Because EW production seasonally precedes gypsy moth defoliation, reduced starch storage from previous years of defoliation can lead to a reduction in EW production the following spring. Conversely, the effect of defoliation is manifested in reduced LW production during the year of defoliation, especially for white oaks, and during the year of defoliation and as a lag effect the following year, for red oaks [19]. A high positive correlation between EW width and LW width of the preceding year, points to a dependence of EW formation on the previous year’s growing conditions for oaks [45] and ring-porous Fraxinus sp. [46].
The ratio of EW:LW was only significantly affected by defoliation and not by treatment or species, supporting the common use of this metric for reconstructing historic insect outbreaks in ring-porous species. Earlywood width is strongly associated with total vessel areas so under favorable growing conditions earlywood is wider and vessels and total vessel area tend to be larger [47]. There is evidence that earlywood vessel area is reduced when the growing environments becomes less favorable [48]. Therefore, when defoliation causes proportionally more earlywood, with potentially reduced vessel area [25], wood density (specific gravity) and strength may be lower because the latewood vessels also have stiffer cell walls [49].
Gypsy moth defoliation caused major reductions in oak volume production during two years of active feeding and one year following. Data from increment cores were used in our whole-stem models to provide an estimate of the total merchantable stem volume lost for the 3-year period. Defoliation may also affect wood cellular and strength properties because in defoliated oaks, the proportion of earlywood and latewood was altered. Hence, variations in wood strength and appearance of the resulting oak lumber may reduce its potential for production of high value veneer and flooring. Future studies could utilize digital images of increment cores and stem sections to identify and measure earlywood vessel characteristics.
5. Acknowledgements
We thank Dave Feicht, Al Iskra, and Rod Whiteman (deceased) for field data collection and Darlene Mudrick for dendrochronolgy measurements.
REFERENCES
- C. B. Davidson, K. W. Gottschalk and J. E. Johnson, “Tree Mortality Following Defoliation by the European Gypsy Moth (Lymantria dispar L.) in the United States: A Review,” Forest Science, Vol. 45, No. 1, 1999, pp. 74- 84.
- T. Tigner, “Gypsy Moth Impact on Virginia’s Hardwood Forests and Forest Industry,” Virginia Department of Forestry, Charlottesville, 1992.
- K. W. Gottschalk, “Silvicultural Guidelines for Forest Stands Threatened by the Gypsy Moth,” General Technical Report NE-171, USDA Forest Service, Northeastern Forest Experiment Station, Radnor, 1993, p. 49.
- P. M. Wargo and D. R. Houston, “Infection of Defoliated Sugar Maple Trees by Armillaria Mellea,” Phytopathology, Vol. 64, 1974, pp. 817-822. doi:10.1094/Phyto-64-817
- D. M. Dunbar and G. R. Stephens, “Association of TwoLined Chestnut Borer and Shoestring Fungus with Mortality of Defoliated Oaks in Connecticut,” Forest Science, Vol. 21, No. 2, 1975, pp. 169-174.
- R. W. Campbell and R. J. Sloan, “Forest Stand Responses to Defoliation by the Gypsy Moth,” Forest Science, Monograph 19, 1977.
- D. R. Houston, “Oak Decline and Mortality,” In: C. C. Doane and M. L. McManus, Eds., The Gypsy Moth: Research toward Integrated Pest Management, USDA Forest Service, Science and Education Agency, Technical Bulletin, No. 1584, 1981, pp. 217-219.
- J. Parker, “Effects of Defoliation on Red Oak Chemistry,” In: C. C. Doane and M. L. McManus, Eds., The Gypsy Moth: Research toward Integrated Pest Management, USDA Forest Service, Science and Education Agency, Technical Bulletin, No. 1584, 1981, pp. 219-225.
- P. M. Wargo, “Defoliation and Tree Growth,” In: C. C. Doane and M. L. McManus, Eds., The Gypsy Moth: Research toward Integrated Pest Management, USDA Forest Service, Science and Education Agency, Technical Bulletin, No. 1584, 1981, pp. 225-240.
- C. B. Davidson, K. W. Gottschalk and J. E. Johnson, “European Gypsy Moth (Lymantria dispar L.) Outbreaks: A Review of the Literature,” General Technical Report NE-278, USDA Forest Service, Northeastern Research Station, Newtown Square, 2001.
- F.M. Thomas, R. Blank and G. Hartman, “Abiotic and Biotic Factors and Their Interactions as Causes of Oak Decline in Central Europe,” Forest Pathology, Vol. 32, No. 4-5, 2002, pp. 277-307. doi:10.1046/j.1439-0329.2002.00291.x
- R. Rogers and T. M. Hinckley, “Foliar Weight and Area Related to Current Sapwood Area in Oak,” Forest Science, Vol. 25, 1979, pp. 298-303.
- R. L. Phipps, “Comments on Interpretation of Climatic Information from Tree Rings, Eastern North America,” Tree-Ring Bulletin, Vol. 42, 1982, pp. 11-21.
- D. W. Woodcock, “Climate Sensitivity of Wood-Anatomical Features in Ring-Porous Oak (Quercus Macrocarpa),” Canadian Journal of Forest Research, Vol. 19, No. 5, 1989, pp. 639-644. doi:10.1139/x89-100
- G. C. Varley and G. R. Gradwell, “Population Models for the Winter Moth,” In: T. R. E. Southwood Ed., Insect Abundance, Symposium, Royal Entomological Society, London, 1968, pp.132-142.
- A. H. Rose, “The Effect of Defoliation on Foliage Production and Radial Growth of Quaking Aspen,” Forest Science, Vol. 4, 1958, pp. 335-342.
- H. M. Kulman, “Effects of Insect Defoliation on Growth and Mortality of Trees,” Annual Review Entomology, Vol. 16, 1971, pp. 289-324. doi:10.1146/annurev.en.16.010171.001445
- G. R. Stephens, N. C. Turner and H. C. DeRoo, “Some Effects of Defoliation by Gypsy Moth (Porthetria dispar L.) and Elm Spanworm (Ennomos subsignarius Hbn.) on Water Balance and Growth of Deciduous Forest Trees,” Forest Science, Vol. 18, No. 4, 1972, pp. 326-330.
- R. M. Muzika and A. M. Liebhold, “Changes in Radial Increment of Host and Nonhost Tree Species with Gypsy Moth Defoliation,” Canadian Journal of Forest Research, Vol. 29, No. 9, 1999, pp. 1365-1373. doi:10.1139/x99-098
- R. Naidoo and M. J. Lechowicz., “Effects of Gypsy Moth on Radial Growth of Deciduous Trees,” Forest Science, Vol. 47, No. 3, 2001, pp. 338-348.
- D. A. Gansner and O. W. Herrick, “Estimating the Benefits of Gypsy Moth Control on Timberland,” USDA Forest Service Res. Note NE-337, 1987, Northeastern Forest Experiment Station, Broomall, p. 3.
- C. W. Minott and I. T. Guild, “Some Results of the Defoliation of Trees,” Journal of Economic Entomology, Vol. 18, No. 2, 1925, pp. 345-348.
- W. L. Baker, “Effect of Gypsy Moth Defoliation on Certain Trees,” Journal of Forestry, Vol. 39, No. 12, 1941, pp. 1017-1022.
- S. Kucherov, “The Reconstruction of Lymantria dispar Outbreaks by Dendrochronological Methods in the South Urals,” In: Y. N. Baranchikov, W. J. Mattson, F. P. Hain and L. Thomas, Eds., Forest Insect Guilds: Patterns of Interaction with Host Trees, Abakan, Siberia, 13-17 August 1989.
- F. Huber, “Determinisme de la Surface des Vaisseaux du Bois des Chenes Indigenes (Quercus robur L., Quercus petraea Liebl.): Effet Individuel, Effet de l’Appareil Foliaire, des Conditions Climatiques et de l’Age de l’Arbre,” Annals of Forest Science, Vol. 50, No. 5, 1993, pp. 509-524. doi:10.1051/forest:19930507
- A. Fratzian, “Growth and Vitality of Oak Stands after Being Eaten by Gypsy Moths, Lymantria dispar L., in Romania,” Anz. Schaedlingskd., Pflanz. Unweltschutz, Vol. 46, 1973, pp. 122-125.
- A. Magnober and A. Cambini, “Radial Growth of Cork Oak and the Effects of Defoliation Caused by Larvae of Lymantria dispar L. and Malacosoma neustria L. [Portuguese],” Boletin do Instituto dos Produtos Florestals, No. 413, 1973, pp. 53-59.
- M. J. Twery, “Changes in the Vertical Distribution of Xylem Production in Hardwoods Defoliated by Gypsy Moth,” Ph.D. Dissertation, Yale University, New Haven, 1987.
- M. A. Fajvan, J. S. Rentch and K. W. Gottschalk, “The Effects of Thinning and Gypsy Moth Defoliation on Wood Volume Growth in Oaks,” Trees, Vol. 22, No. 2, 2008, pp. 257-268. doi:10.1007/s00468-007-0183-6
- R. Kienholz, “Seasonal Course of Height Growth in Some Hardwoods in Connecticut,” Ecology, Vol. 22, No. 3, 1941, pp. 249-258. doi:10.2307/1929612
- M. H. Zimmerman and C. L. Brown, “Trees: Structure and Function,” Springer-Verlag, New York, 1974
- P. M. Wargo, “Variation of Starch Content among and within Roots of Red and White Oak Trees,” Forest Science, Vol. 22, 1975, pp. 468-471.
- P. M. Wargo, “Consequences of Environmental Stress on Oak: Predisposition to Pathogens,” Annals of Forest Science, Vol. 53, No. 2-3, 1996, pp. 359-368. doi:10.1051/forest:19960218
- P. R. Larson, “Some Indirect Effects of Environment on Wood Formation,” In: M. H. Zimmerman, Ed., Formation of Wood in Forest Trees, Academic Press, New York, 1964.
- S. F. Gingrich, “Measuring and Evaluating Stocking and Stand Density in Upland Hardwood Forests in the Central States,” Forest Science, Vol. 13, No. 1, 1967, pp. 38-53.
- D. M. Smith, B. C. Larson, M. J. Kelty and P. M. S. Ashton, “The Practice of Silviculture Applied Forest Ecology,” 9th Edition, John Wiley and Sons, New York, 1997.
- M. L. McManus, “In the Beginning: Gypsy Moth in the United States,” In: P. C. Tobin and L. M Blackburn Eds. “Slow the Spread: A National Program to Manage the Gypsy Moth,” USDA Forest Service General Technical Report NRS-6. Newtown Square, 2007, pp. 3-13.
- VoorTech Consulting. Measure J2X R. VoorTech Consulting, Northwood, 2000.
- H. D. Grissino-Mayer, R. L. Holmes and H. C. Fritts, “The International Tree-Ring Data Bank Program Library Version 2.1 User’s Manual,” Laboratory of Tree-Ring Research, University of Arizona, Tucson, 1997.
- SAS Institute Inc., “SAS/STAT 9.1 User’s Guide,” SAS Institute Inc., Cary, 2004.
- G. W. Miller, J. W. Stringer and D. C. Mercker, “Technical Guide to Crop Tree Release in Hardwood Forests,” Professional Forestry Note, University of Tennessee, 2007. http://www.sref.info/publications/online_pubs
- T. T. Kozlowski, “Growth and Development of Trees,” Academic Press, New York, 1971.
- D. L. Graney, “Ten-Year Growth of Red and White Oak Crop Trees Following Thinning and Fertilization in the Boston Mountains of Arkansas,” Proceedings of the 4th Biennial Southern Silvicultural Research Conference, Atlanta, 4-6 November 1986.
- J. S. Rentch, D. Fekedulegn and G. W. Miller, “Climate, Canopy Disturbance, and Radial Growth Averaging in a Second-Growth Mixed-Oak Forest in West Virginia, USA,” Canadian Journal of Forest Research, Vol. 32, No. 6, 2002, pp. 915-927. doi:10.1139/x02-016
- P. Nola, “Climatic Signal in Earlywood and Latewood of Deciduous Oaks from Northern Italy,” In: J. S. Dean, D. M. Meko and T. W. Swetnam, Eds. Tree Rings, Environment and Humanity, University of Arizona, Tucson, 1996, pp. 249-258.
- J. C. Tardiff, “Earlywood, Latewood and Total Ring Width of Ring-Porous Species (Fraxinus nigra Marsh) in Relation to Climatic and Hydrologic Factors,” In: J. S. Dean, D. M. Meko and T. W. Swetnam, Eds., Tree Rings, Environment and Humanity, University of Arizona, Tucson, 1996, pp. 315-324.
- J. C. Tardiff and F. Conciatori, “Influence of Climate on Tree Rings and Vessel Features in Red Oak and White Oak Growing Near Their Northern Distribution Limit, Southwestern Quebec, Canada,” Canadian Journal of Forest Research, Vol. 36, No. 9, 2006, pp. 2317-2330. doi:10.1139/x06-133
- P. Fonti and I. Garcia-Gonzalez, “Suitability of Chestnut Early Wood Vessel Chronologies for Ecological Studies,” New Phytologist, Vol. 163, No. 1, 2004, pp. 77-86. doi:10.1111/j.1469-8137.2004.01089.x
- A. P. Schniewind, “Transverse Anisotropy of Wood: A Function of Gross Anatomic Structure,” Journal Forest Products Research Society, Vol. 9, 1959, pp. 350-359.