Journal of Applied Mathematics and Physics
Vol.05 No.11(2017), Article ID:80537,18 pages
10.4236/jamp.2017.511183
Topological Modelling of Deep Ulcerations in Patients with Ulcerative Colitis
Ian Morilla1,2*, Mathieu Uzzan2, Dominique Cazals-Hatem2, Hatem Zaag1, Eric Ogier-Denis2, Gilles Wainrib3, Xavier Tréton2
1Université Paris 13, Sorbonne Paris Cité, LAGA, CNRS (UMR 7539), Laboratoire d’excellence Inflamex, F-93430, Villetaneuse, France
2INSERM, UMRS1149, Team “Inflammation Intestinale”, Research Centre of Inflammation, Paris, France
3Département d’Informatique, Equipe DATA, Ecole Normale Supérieure, Paris, France

Copyright © 2017 by authors and Scientific Research Publishing Inc.
This work is licensed under the Creative Commons Attribution International License (CC BY 4.0).
http://creativecommons.org/licenses/by/4.0/


Received: September 7, 2017; Accepted: November 21, 2017; Published: November 24, 2017
ABSTRACT
Aims: Steadily the clinicians of our team in inflammatory bowel disease encounter ulcerative colitis patients that develop deep ulcers during their treatment. Currently, these practitioners are only equipped with their grade of expertise in inflammatory domains to decide what new therapy maybe use in such cases. Encouraged by the limited knowledge of this frequent pathology, we seek to determine the molecular conditions underlying the recurrent formation of deep ulcerations in certain group of patients. Method: The goal of this strategy is to expose differences between groups of patients based on similarities computed by random walk graph kernels and performing functional inference on those differences. Results: We apply the methodology to a cohort of eleven miRNA microarrays of ulcerative colitis patients. Our results showed how the group of ulcerative colitis patients with presence of deep ulcers is topologically more similar (0.35) than ulcerative colitis patients (0.18) to control. Such topological constraint drove functional inference to complete the information that clinicians need. Conclusions: Our analyses reveal highly interpretable in the guidance of practitioners to eventually correct initial therapies of ulcerative colitis patients that develop deep ulcers. The methodology can provide them with useful molecular hypotheses necessaries prior to make any decision on the newest course of the treatment.
Keywords:
Ulcerative Colitis, Deep Ulcers, Fast Random Walk Graph Kernels, Conjugate Gradient Methods, Spectral Graph Theory

1. Introduction
Acute severe ulcerative colitis (ASC) is a multifaceted complication affecting about 25% of ulcerative colitis (UC) patients nowadays. Such a complication is a chronic threatening state often requiring emergent colectomy in case of intensive medical treatment failure. Additionally, the presence of deep ulcers expose patients to serious episodes such as sepsis, toxic mega-colon, perforation or death [1] [2] [3] . Despite many efforts, the molecular conditions leading to ulcers formation are still not clear. As showed in following sections, our graph kernel analysis provides practitioners with an excellent medical tool to approach this serious episode of inflammatory disorder. In this sense, we infer plausible hypothesis that sheds light into such a pressing medical problem and fits previous experiments reported in the literature.
Graphs naturally model many types of structured data by means of nodes and edges. While nodes are representing general entities edges describe type of relations between such entities. On the other hand, machine learning methods applied to biomedical contexts [4] [5] concern about capturing relationships between structured entities. This tight coupling is of major interest in domains like medicine, where the seek of similarity between structures, here patients, is essential in preventing and fighting diseases. Kernel algorithms [6] provide an excellent framework to measure similarity between objects and . Notwithstanding, some few mathematical properties must be ensured first, i.e., symmetry and positive semi-definite (p.s.d.). Kernel methods may be used both to compare nodes within the same graph [7] and in inter-graph [8] [9] comparisons. The only constraint is its interpretability since we need to capture the pith of data encapsulated by the construction of a graph while we find ways suitable for the kernel evaluation. In this paper we evaluate in a novel scenario, inflammatory bowel disease, an extension of kernel methods [10] looking for topological similarity and combine functional context with the idea of performing medical inference in ulcerative colitis (UC). The paper maybe dissected in sections, namely: Section 2 portrays the inflammatory medical issue underlying this work; Section 3 gives us a reasonable landscape of the methods: spectral graph analysis, Conjugate Gradient Methods (CGs) to calibrate random walk graph kernel, and functional inference on our topological model; section 4 confirms our approach is valid when it is used in a real cohort of 11 patients having been diagnosed with acute severe ulcerative colitis; we provide our concluding remarks in Section 5.
2. Motivation: The Deep Ulcer Problem in ASC
Practitioners and scientists based at the “Centre de Recherche sur l’Inflammation” (INSERM, UMRS1149); Université Paris-Diderot Sorbonne have recently, conducted a primary pilot study targeted to determine why some patients having been diagnosed with ulcerative colitis, an idiotypic inflammatory bowel disease, develop a haemorrhagic mucosa with deep ulceration. Indeed, ulcerative colitis is characterised by superficial inflammatory damages in the colonic mucosa. Currently, there are no pathogenic factors identified to explain the occurrence of deep ulcers in severe form of UC, such as ASC. This newest complication of the disease is an indicator of a poor response to medical therapy. Upon multiple medical assays as well as statistical approaches (i.e., supervised hierarchical clustering, etc.) aiming at establishing predictive signatures to be used as dia- gnostic and prognostic; such phenomenon, apparently, seems to be “stochastic” within the treatment of ASC patients.
3. Material and Methods
This section provides the reader with a summary description of the three constituent methods, i.e., spectral graph theory, CGs in the efficiently computation of the graph kernel, and functional inference on topological models needed to understand the results showed in section 4.
3.1. Human Samples
All the biopsies analysed in the study were extracted from non-inflamed mucosa of the sigmoid colon. Paraffinised samples of colectomy were selected among three groups of patients: a first group consisting of four patients operated on UC in presence of deep ulcerations (ASC), what is a constituent marker of severity; a second sample made of three healthy subject with normal colonic mucosa and a last sample of four patients with refractory UC, i.e., superficial inflammation without deep ulcers (Figure 1(a)). The extracted RNA derives from low inflammatory areas of the colon. MicroRNA (small non-coding RNA containing between 22 - 25 nucleotides) expression was measured by specific chip of microarray Affymetrix.
3.2. Differential miRNA Expression
Differential miRNA expression was performed using limma [11] by fitting a log-normal (LN) generalized linear model (GLM) that accounts for expression (mucosal) as well as group (UC/ASC).

Figure 1. Human samples’ scheme (a) and differential analysis of miRNA expression profiles per group of patients (b); UC, ASC and Control patients are highlighted in red, green and blue respectively.
3.3. Multi-Omic Graphs Integration
In this stage a cohort of eleven miRNA microarrays was used with the aim of co-integrating the differential miRNA expression profiles not present in the intersection in pairwise of UC patients (i.e., UC, ASC and Control) and known human Protein-Protein Interaction (PPI, defined as miRNA-gene target product) from Genemania database [12] . Our approach is based on the assumption that genes with similar gene expression levels are translated into proteins that are more likely to interact. Recent works on gene expression and protein interaction data at genome-wide level expose such a conjecture: “Protein pairs encoded by co-expressed genes are much more likely to interact mutually than with any other type of proteins [13] [14] . Specifically, the rationale to transform the miRNA expression of a patient into a network is like this: We may want to represent a node in the graph for every protein encoded by a miRNA target gene provided its expression level was measured on this patient’s microarray. We create an edge between two given proteins of this type if these proteins are reported as interacting by Genemania, and genes are up or down-regulated at the same time with respect to a provided measure tag (see previous subsection). Herein, no distinction is made between coding gene and protein.
3.4. Spectral Graph Properties
Briefly, we initially explore the geometric and algebraic behaviour of each co-integrated omic graph (UC, ASC and Control) by means of some few key spectral properties, namely: their spectra; i.e., the eigenvalue for a given factor measures the variance in all the variables which is accounted for by that factor. Their algebraic connectivity calculated in the Laplacian matrix as its second smallest eigenvalue. Eigencentrality; i.e., to weight the relative importance of a given ith node in linking motifs within the graphs and defined as the ith com- ponent of the eigenvector corresponding to the greatest eigenvalue; and their modularity by calculating the Fiedler’s vector; i.e., the vector corresponding to its algebraic connectivity [15] [16] . All the calculations were performed using MATLAB R2011a (maci64 architecture on a machine with a single 2.8 GHz processor and 8GB RAM distributed in two cores).
3.5. Fixing the Context: Reproducing Kernel Hilbert Space
Definition 1 Lets and be two real matrices, the Kronecker product and column-stacking operator are defined as
where amounts the kth column of .
The Kronecker product and operator meet the following relationship (e.g., [17] , Proposition 7.1.9):
(1)
Another standard condition of the Kronecker product exploited in this work is ( [17] , Proposition 7.1.6):
(2)
All these ideas are extendable to Reproducing Kernel Hilbert Spaces (RKHS). Let be such a space, hence it is defined by a p.s.d. kernel , where is a set of labels including the singular label . generates a feature map satisfying and mapping in to its zero element. We finally denote by the matrix of a graph G associated to the feature map that enables lifting tensor algebra from to [18] .
3.6. General Setup of UC Graphs
1In some others context this matrix might be differently defined, e.g., spectral graph theory.
Graphs were constructed for each group of UC patients individually. These networks consisted of a set of n vertices endowed with order and edges . The nature of the measured microRNA expression leads us to work on undirected graphs, i.e., if . Aditionally, for any p. Now, we define paths on those UC graphs as a sequence of indices ( amounts path length) such that , for all . Our graphs are robustly connected since a path can be traced in each direction between each pair of vertices of the graph. We also associate a weight to each edge to capture the “strength” of an edge . Then implies whereas for undirected weighted graphs we have . Now, let be the adjacency matrix1 of our weighted graphs with D a diagonal matrix measuring the node degrees, that is,
. Thus it may be used as transition matrix in a stochastic process
since the sum of each of its columns is one. We transform a path on into random by applying what generates sequences of vertices proportionally linked to their weights in pairwise following the above probability. Hence, the probability of transition between any pair of vertex and through a path of length p can be induced by the expression . Finally, we say that two graphs and are isomorphic ( ) if iff , where is a bijection.
3.7. Random Walk Graph Kernel
Henceforth, we note that all the definitions are generalised to the normalised case, whereas the edges are taken on a set with finite number of labels . In particular, we can take the induced RKHS endowed with the usual inner product.
Intuitive definition: Random walk graph kernel has been extensively reported in literature to classify and measure similarities of graphs [18] [19] . The rationale of this algorithm is as follows: The random walk kernel on graph counts the number of walks shared by a couple of graphs. Two walks are said to be shared if their lengths and label sequences are the same. Subsequently, the calculated number of shared walks enables to measure the similarity of the two graphs. To infer a formal definition of random walk graph kernel, we might want to present some basic concepts in direct product of graphs. The direct product of two graphs and is other graph, denoted by , where the node set
, andthe edge set . In particular, can be
associated to a weight matrix (Definition 1) with non-zero entries provided the analogous edge is defined in the graph produced by the direct product. A random walk on the direct product graph amounts the trace of random walks on G and at once. Let and be the starting (stopping) probabilities of the random walks on G and , respectively. Then, the number of shared walks of length on the direct product graph is calculated by , where A and are the normalised adjacency matrices of G and , respectively [20] . This definition enables the review of all the shared walks per each unique lengths. However, this sum might not be convergent. Thus, we introduce a non-negative coefficient of decay to get rid of the longer walks.
Kernel definition Formally, the expression for the random walk kernel on graph is as follows:
(3)
Hence, ( ) is the starting (stopping) probability distribution associated to the graph produced by the direct product. Therefore, if the coefficients assure the convergence of (3), then (3) is a valid p.s.d. kernel ( [18] , Theorem 3).
3.8. Conjugate Gradient Methods
We selected the conjugate gradient method for calculating the random walk kernel on our graphs since other methods such as the Sylvester or the spectral decomposition are not applicable for kernels on graphs in general [20] .
The computation of a random walk kernel on graph with stands for inverting , an matrix if each graph G and have n vertices. Lets M and v be a matrix and a vector respectively, conjugate gradient (CG) method is used to solve systems as efficiently [20] . More general, since these methods are thought of symmetric p.s.d. matrices, CGs solve as well other linear systems efficiently. CG solvers improve their performances as the matrix has a small number of different eigenvalues, or is rank deficient. Remarkably, in cases where the matrix M is sparse the computation speed of matrix-vector products can be increased significantly [21] .
The computation of the graph kernel (3) using CG maybe firstly described as the solution of the following linear system:
(4)
for x, then we compute . Next, it ought to contemplate proficient ways to solve (4) with the CG solver. We already know that W is a square matrix of size . The application of the CG method to a direct approach needs iterations to multiply W by a vector y. However, if we exploit the above extended vec-MNP formula (1) into RKHS ( [18] , Lemma 12) with some new matrix with and taking into account that in particular (A and the normalised adjacency matrix for the graphs G and respectively), by ( [18] , Lemma 12) we can write
(5)
If then we can compute the above multiplication of a matrix by a vector in time order of . Furthermore, even more efficient computation of is feasible provided that the matrices A and are sparse: Assuming that A and have non-x entries, then computing (5) takes only time.
Finally, note that the nearest Kronecker product [22] is not appropriate to approximate since the number d of distinct labels in our labeled graph is not large enough.
3.9. Weisfeiler-Lehman Graph Kernels Cross-Validation
As validation of our results, we also propose to compare the random walk kernel on graph and the family of Weisfeiler-Lehman kernels. The later consists of proficient kernels to be used on graphs presenting discrete node labels. Such family is built on the Weisfeiler-Lehman test of isomorphism between graphs [23] and its valid 1-dimensional variant [24] . It captures topological and label information iteratively mapping the graph of reference onto a sequence of graphs with nodes displaying characteristic attributes. This catenation of graphs originating from the Weisfeiler-Lehman test can establish a family of kernels, including an adequate kernel to compare patterns taking subtree shape. Notice how the edges and length of such a sequence produce a final complexity in linear terms.
Definition 2 Given the Weisfeiler-Lehman (WL) graph of height , its sequence is denoted by:
(6)
where h counts iterations, and and are respectively the sequences of G and associated to WL graphs.
Definition 3 Provided the so-called base kernel is fixed, then the definition of Weisfeiler-Lehman kernel for is
(7)
where and , the WL sequence up to height a of G.
Finally, is positive semidefinite if the base kernel is positive semidefinite [25] , Theorem 3.
Definition 4 Let be the set of node labels matching at least once in graphs or at the end of the k-th iteration of the WL algorithm. We also fix as the set of original node labels of and while are pairwise disjoint. Then, we presume every is ordered. Define a map such that amounts the count of the letter in a graph . The Weisfeiler-Lehman subtree kernel on two graphs and is as follows:
(8)
where for G (resp. )
This algorithm basically seeks matching of vertex identifiers assuming that the corresponding subgraphs match.
Definition 5 Provided a function w weighting the edges exits, we can described the corresponding base kernel by , where amounts Dirac kernel and is the similarity captured by a kernel between weights. Hence by 6, the Weisfeiler-Lehman edge kernel turns into
where and is a vector of matching pairs , , which amounts sorted final vertices of an edge in .
Definition 6 We also calculate the shortest path version of the Weisfeiler- Lehman kernel. Similarly, it is defined as
where and denotes a vector composed by the counts of matches for triplets in , where are sorted final vertices of a shortest path and is the shortest path length.
3.10. Inference on Random Walk Graph Kernels by Enrichment of Functional Annotations
So far, we described how to compare UC/ASC graphs, enabling the trace of the underlying similarity between them and their corresponding control samples by gene targets expression profiles from data. Now, we are interesting in performing inference on our topological model to characterise the genetic mechanisms of miRNA perturbations of gene graph in detail. In section 4, we discuss how inference schemes can be used on our estimated model to learn about downstream effects of miRNAs perturbations. We note that all of these inference schemes are based on enrichment analysis in functional annotations (calculation of Fisher’s test [26] is performed to quantitatively capture the functional enrichment of genes according to their annotation terms) using the gene ontology database (GO) [27] .
4. Results and discussion
4.1. Data Integration and Spectral Behaviour between the UC Graphs
We analyse our sequence of graphs individually by comparing some algebraic characteristics.
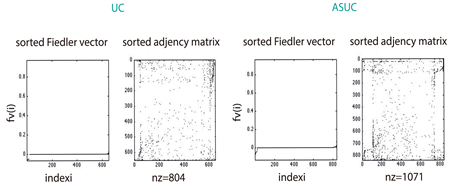
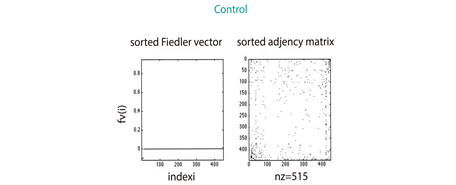
As describe in section 3.3, we found that 2390 proteins (Figure S1) from Genemania [12] were reported by the gene expression levels of our miRNA microarrays (Figure 1(b)). The largest amount of those proteins (1071 for 330 miRNAs differentially expressed (see section 3.2) was identified in the ASC sample, whereas the UC patients sample matched in 804 (in 237 miRNAs differentially expressed); the remaining 515 (in 92 miRNAs differentially expressed) corresponded to the sample of control. These amounts seem to be consistent with the medical expectation of discovering, at a larger-scale, perturbed expression profiles involved in the pathways leading to deep ulcerations (ASC). Strikingly, the comparison of their spectra showed dissimilar conclusions; while the eigenvectors of ASC and Control patients exhibit similar patterns regarding UC patients (Figure 2(a)), the eigenvalue distributions of the three group of patients display the same Gaussian mixture models (Figure 2(b)). However, the algebraic connectivity in ASC and UC resembled each other with associated values of 21 and 18 what means almost twofold greater than the control group with a value of 10. No significant difference was detected among the remaining spectral parameters, i.e., eigencentrality or simple modularity Figure S1. Although we enhance important algebraic and geometric characteristics of our graphs, it seems that no conclusions might be made regarding their similarities per group.
4.2. Topological Similarity between Pairs of UC Graphs by Random Walk Kernel
To measure topological similarity among our three groups of graphs, i.e., UC, ASC and Control with a biological significant, we established a comparison

Figure 2. Distribution of spectra per group of patients. Plots of the 2D and 3D eigenvector distributions of the laplacian matrix show how ASC (green) and Control (blue) patients exhibit similar behaviours as compared to UC (red) patients (a); However, the three groups of patients display the same type of Gaussian mixture models for their eigenvalue distributions (b).
between interacting and co-regulated groups of target genes per sample of patient. To this task a random walk kernel on graph is the appropriate selection, as for this graph a random walk amounts a set of target genes in which continuous genes by the walk side are co-expressed and interact. To efficiently compute the random walk, we made use of the CG methods using the parameter with convergence threshold set to 10−6. In Figure 3(a) we contrast the scores of similarity measured by graph kernel computation of the conjugate gradient algorithm referred to UC patients modelled as labeled graphs with that of the direct sparse method. Our approach demonstrates how the group of ASC
 (a)
(a) (b)
(b)
Figure 3. Scores of topological similarity between graphs of patients yielded by our random walk graph kernel ( and tolerance set to 10−6 in its computation with conjugate gradient method). The UC and ASC groups are mutually similar the most; however the group of ASC patients resembles topologically better than UC to control (0.35/0.18) (a); Cross-validation of our results computed by the three instances of the general Weisfeiler-Lehman graph kernels, the Weisfeiler-Lehman subtree kernel, the Weisfeiler-Lehman edge kernel, and the Weisfeiler-Lehman shortest path kernel (b).
patients is topologically more similar to control patients (0.35 as normalised score ) than UC are (0.18). Here, closer to 1 means more similar graphs. We recall that the random walk kernel on graph measures the amount of walks shared by the couple of graphs involved in (section 3.7). This topological relationship between ASC patients and their group of control is, although relatively unexpected, entirely plausible from a biological and thus medical point of view. Validation of similarities using the Weisfeiler-Lehman Graph Kernels The reliability of our results is also validated by comparing the performances of the random walk and Weisfeiler-Lehman graph kernels. The latter consists of a triplet of robust methods (see methods) in capturing topological and label information on graphs. These algorithms confirmed the same scheme described in our results, i.e., ASC group is closer than UC patients to control group. Whereas a graphical visualisation of these data may be displayed in Figure 3(b), the specific normalised (by all the possible paths on the graph) values of the pairwise comparison between patients’ graphs are shown in the following Table 1.
4.3. Inference on the Topological Model: Malfunction of Lymphoid Structures Induces Deep Ulcers in UC Patients
We can perform inference on our topological model combining the similarity scores and functional enrichment analysis. Since ASC patients are topologically more similar than UC to Control (Figure 3 and Figure 5(a)), one natural idea is to explore the lack of or alternatively the low expression levels of miRNA-gene targets involved in enriched pathways from both ASC and control data with respect to UC patients. In the view of the enrichment analysis using GO (Table SI, Table SII and Table SIII) and the above inference constraint, the only enriched functional module fitting our topological model in the colon was that linked to lymphoid nodules (GO:0048541 with p-value and q-value associated to the Fisher Exact test). Such structures are the equivalent

Table 1. Weisfeiler-Lehman graph kernels’ Validation.

Figure 4. Inference derived from our topological model based on GO analysis of functional enrichment per group of patients. Enrichment in lymphoid nodules development is the only major difference between ASC group of patients. While the miRNA-target genes involved in lymphoid nodules pathways are over-expressed in the group of UC patients, these target genes are poorly under-expressed in ASC. This scenario resembles the molecular behaviour of Control patients (a); UC and ASC biological processes shared in GO database (b); GO biological process in common of the three group of patients after prospective drug-mediated treatment (c).

Figure 5. Description of the medical hypothesis-driven by our graph kernel analysis. Scales of similarity between group of patients, i.e., ASC and Control becoming a topological constraint to be considered (a)-(c). Upon functional inference using GO, we deduce how the lack of production in sIgA/E for ASC patients (highlighted in green) prevent immune system’s activation face bacteria’s threat (d). This behaviour resembles the group of control maybe by a malfunction of lymphoid structures in the first line of activation in immune response. Edge colours in panels (a)-(c): purple, rose, blue and green amount to co-expression, physical interactions, co-localisation and genetic interactions respectively.
to the Peyer’s patches (PPs) in the Ileum. This fact derives from the no detection of such enrichment in the production of immunoglobulins, i.e., sIgA and slgE, in ASC patients as compared to UC patients (Figure 4). Such a lack of production in sIgA is a consequence of the relative poorly enriched scores associated to the coding genes ID2 and STAT5, which control the intestinal immune network for sIgA production via negative regulation of class IgA/E class switching [28] and“on-off” recombination of immunoglobulin gene in developing pro-B cells [29] (Figure 5(d)―starts highlighted in red). Now, we are equipped with enough information to infer the following hypothesis: There exists a very low production of immune globulin A (sIgA) within ASC patients occasioned by malfunction of lymphoid nodules. Indeed, there is no immune system’s activation, whereas in UC patients we have over-expression of lymphoid nodules related pathways (Figure 5(d)).
The sIgA is an antibody―Y-shaped protein―that plays a critical role in immune function in the mucous membranes. This scenario matches the topological constraint yielded by our model between control and ASC patients. Furthermore, it is been already described how sIgA likely contains other propitious outcomes in overall immunity by means of a diminished inflammation in the digestive tract [30] . There is also evidence that sIgA (low/coding genes under-expression) secretion into body cavities in combination with malfunction of immune cells in PPs [31] [32] [33] is involved in allergic diseases (type 1 diabetes, Ulcerative Colitis/Crohn disease, hay fever or asthma). Thus, the formation of deep ulcers in some UC patients may be caused by the low production of sIgA as a consequence of lymphoid structures malfunction.
5. Conclusion
This paper first presented the urgent medical problem derived from the occurrence of deep ulcers during the therapy of patients with a severe chronic inflammation in the colon mucosa and how the efficiently computation of a Random walk graph kernel captures similarity between groups of these patients, namely: UC, ASC and Control. We adopt the extended linear algebra in an RKHS to overcome some issues of efficiency in kernels computations taking advantage of the shared structure intrinsic to these questions. The groups of patients were modelled as undirected labeled graphs based on the co-integration of target gene expression profiles and interaction. Thus, the nature of our data and the flexibility of conjugate gradient algorithm made of this method the most appropriate to compute geometrical random walks among other options such as spectral decomposition. We made use of models of sparsity, low effective rank, and Kronecker product to reduce the computational cost in the calculations and exploited specific forms of . While other methods of direct comparison to measure similarity like spectral properties are not conclusive; this approach reveals as much more interpretable. Indeed, our results demonstrate how the group of ASC patients topologically resembles Control better than UC patients do. In addition, we stress the reliability of our results by means of a robust triple validation. Albeit, an important caveat of our kernel approach concerns the possible values taken by the parameter in (3) which entirely relies on the range of as weight matrix. We also show how the topological constraint imposed by the ASC and Control groups drives the analysis of enrichment in functional annotations enabling inference on our topological model. As a consequence, we are able to guide clinicians with a likely hypothesis regarding the low production of slgA and slgE in the ASC group to be conducted during patient’s treatment. Moreover, these results are being further validated by the clinicians and scientists of our team in the “Centre de Recherche sur l’Inflammation” as part of the future work based on this study. Specifically, we plan to performance immunofluorescence experiments, which would experimentally validate our results. we will also extend our analysis to a new cohort of patients applying improved versions of neighbour matching using deep learning models to capture similarities between graph of individual patients. Overall, this work provides practitioners with a useful and biologically meaningful tool to find similarities among patients profiles in a timely manner. Our approach allows them to avoid spending a large amount of time and effort on sweeping lots of experimental results to test eventual therapeutic hypotheses done by hand; therefore, the diagnosis efficiency and accuracy can be enhanced.
Acknowledgements
We acknowledge the financial support by Institut National de la Santé et de la Recherche Médicale (INSERM), Inserm-Transfert, Association Franois Aupetit (AFA), Université Diderot Paris 7, and the Investissements d’Avenir programme ANR-11-IDEX-0005-02 and 10-LABX-0017, Sorbonne Paris Cité, Laboratoire d’excellence INFLAMEX. IM would like to extend his thanks to Dr. Verónica G. Doblas for her invaluable discussions and ideas.
Cite this paper
Morilla, I., Uzzan, M., Cazals-Hatem, D., Zaag, H., Ogier-Denis, E., Wainrib, G. and Tréton, X. (2017) Topological Modelling of Deep Ulcerations in Patients with Ulcerative Colitis. Journal of Applied Mathematics and Physics, 5, 2244-2261. https://doi.org/10.4236/jamp.2017.511183
References
- 1. Grainge, M.J., West, J. and Card, T.R. (2010) Role of Drug Transporters and Drug Accumulation in the Temporal Acquisition of Drug Resistance. Lancet, 375, 657-663.
- 2. McClements, D. and Probert, C. (2015) Managing Acute Severe Ulcerative Colitis in the Hosptialised Setting. Frontline Gastroenterology, 6, 241-245.
- 3. Wang, H., Vo, T., Hajar, A., Li, S., Chen, X., Parissenti, A.M., Brindley, D.N. and Wang, Z. (2014) Multiple Mechanisms Underlying Acquired Resistance to Taxanes in Selected Docetaxel-Resistant Mcf-7 Breast Cancer Cells. BMC Cancer, 14, 37. https://doi.org/10.1186/1471-2407-14-37
- 4. Moody, G. (2004) Digital Code of Life: How Bioinformatics is Revolutionizing Science, Medicine, and Business. Wiley, Hoboken, New Jersey.
- 5. Gulshan, V., Peng, L., Coram, M., et al. (2016) Development and Validation of a Deep Learning Algorithm for Detection of Diabetic Retinopathy in Retinal Fundus Photographs. JAMA, 316, 2402-2410.
- 6. Scholkopf, B. and Smola, A.J. (2002) Learning with Kernels. MIT Press, Cambridge.
- 7. Kondor, R. and Lafferty, J.D. (2002) Diffusion Kernels on Graphs and Other Discrete Structures. Proceedings of the International Conference on Machine Learning, 315-322.
- 8. Smola, A.J. and Kondor, R. (2003) Kernels and Regularization on Graphs. Proceedings of the Annual Conference on Computational Learning Theory, Lecture Notes in Computer Science, 144-158. https://doi.org/10.1007/978-3-540-45167-9_12
- 9. Yanardag, P. and Vishwanathan, S.V.N. (2015) Deep Graph Kernels. In: Proceedings of the 21th ACM SIGKDD International Conference on Knowledge Discovery and Data Mining, ACM, New York, 1365-1374. https://doi.org/10.1145/2783258.2783417
- 10. Roche-Lima, A. (2016) Implementation and Comparison of Kernel-Based Learning Methods to Predict Metabolic Networks. Network Modeling Analysis in Health Informatics and Bioinformatics, 5, 26. https://doi.org/10.1007/s13721-016-0134-5
- 11. Ritchie, M.E., Phipson, B., Wu, D., Hu, Y., Law, C.W., Shi, W. and Smyth, G.K. (2015) Limma Powers Differential Expression Analyses for Rnasequencing and Microarray Studies. Nucleic Acids Research, 43, e47. https://doi.org/10.1093/nar/gkv007
- 12. Warde-Farley, D., Donaldson, S.L., Comes, O., Zuberi, K., Badrawi, R., Chao, P., Franz, M., Grouios, C., Kazi, F., Lopes, C.T., Maitland, A., Mostafavi, S., Montojo, J., Shao, Q., Wright, G., Bader, G.D. and Morris, Q. (2010) The Genemania Prediction Server: Biological Network Integration for Gene Prioritization and Predicting Gene Function. Nucleic Acids Research, 38, 214-220.
- 13. Fraser, H.B., Hirsh, A.E., Wall, D.P. and Eisen, M.B. (2004) Coevolution of Gene Expression among Interacting Proteins. Proceedings of the National Academy of Science, 24, 9033-9038. https://doi.org/10.1073/pnas.0402591101
- 14. Musungu, B.M., Bhatnagar, D., B, R.L., Payne, G.A., Brian, G.O., Fakhoury, A.M. and Geisler, M. (2016) A Network Approach of Gene Coexpression in the Zea mays/Aspergillus avus Pathosystem to Map Host/Pathogen Interaction Pathways. Frontiers in Genetics, 7, 206. https://doi.org/10.3389/fgene.2016.00206
- 15. Fiedler, M. (1973) Algebraic Connectivity of Graphs. Czechoslovak Mathematical Journal, 98, Article ID: 298305.
- 16. Brouwer, A. and Haemers, W.H. (2011) Spectral Graphs. Springer.
- 17. Bernstein, D.S. (2005) Matrix Mathematics. Princeton University Press.
- 18. Vishwanathan, S.V.N., Schraudolph, N.N., Kondor, R.I. and Borgwardt, K.M. (2010) Graph Kernels. Journal of Machine Learning Research, 11, 1201-1242.
- 19. Sugiyama, M. and Borgwardt, K. (2015) Halting in Random Walk Kernels. In: Cortes, C., Lawrence, N.D., Lee, D.D., Sugiyama, M. and Garnett, R., Eds., Advances in Neural Information Processing Systems 28, Curran Associates, Inc., 1639-1647.
- 20. Kang, U., Tong, H. and Sun, J. (2012) Fast Random Walk Graph Kernel. Proceedings of the 12th SIAM International Conference on Data Mining SDM, 828-838. https://doi.org/10.1137/1.9781611972825.71
- 21. Nocedal, J. and Wright, S.J. (1999) Numerical Optimization. Springer Series in Operations Research. https://doi.org/10.1007/b98874
- 22. Steeb, W.H. and Hardy, Y. (2011) Matrix Calculus and Kronecker Product: A Practical Approach to Linear and Multilinear Algebra. 2nd Edition, World Scientific Publishing Company. https://doi.org/10.1142/8030
- 23. Weisfeiler and Lehman, A.A. (1968) A Reduction of a Graph to a Canonical Form and an Algebra Arising during This Reduction. Nauchno-Technicheskaya Informatsia, 9.
- 24. Babai, L. and Kucera, L. (1979) Canonical Labelling of Graphs in Linear Average Time. Proceedings Symposium on Foundations of Computer Science, 39-46. https://doi.org/10.1109/SFCS.1979.8
- 25. Shervashidze, N., Schweitzer, P., van Leeuwen, E.J., Mehlhorn, K. and Borgwardt, K.M. (2011) Weisfeiler-Lehman Graph Kernels. Journal of Machine Learning Research, 12, 2539-2561.
- 26. Sprent, P. (1993) Applied Nonparametric Statistical Methods. 2nd Editon, Chapman and Hall, London.
- 27. Consortium, G.O. (2017) Expansion of the Gene Ontology Knowledgebase and Resources. Nucleic Acids Research, 45, D331-D338.
- 28. Sugai, M., Gonda, H., Kusunoki, T., Kataki, T., Yokota, Y. and Shimizu, A. (2002) Essential Role of id2 in Negative Regulation of Ige Class Switching. Nature Immunology, 4, 25-29.
- 29. Malin, S., McManus, S., Cobaleda, C., Novatchkova, M., Delogu, A., Bouil-let, P., Strasser, A. and Busslinger, M. (2010) Role of stat5 in Controlling Cell Survival and Immunoglobulin Gene Recombination during Pro-b Cell Development. Nature Immunology, 11, 171-179.
- 30. Robinson, L.E. and Reeves, S. (2015) Review of Sigas Major Role as a Ffrst Line of Immune Defense and New Indications Regarding Inammation and Gut Health. Epicor Science Report, 25, 25-29.
- 31. Rai, T., Wu, X. and Shen, B. (2015) Frequency and Risk Factors of Low Immunoglobulin Levels in Patients with Inammatory Bowel Disease. Gastroenterology Report, 2, 115-121.
- 32. Mulder, S.J. and Mulder-Bos, G.C. (2006) Most Probable Origin of Coeliac Disease Is Low Immune Globulin a in the Intestine Caused by Malfunction of Peyers Patches. Medical Hypotheses, 66, 757-762.
- 33. Kawakota, S., Tran, T.H., Maruya, M., Suzuki, K., Doi, Y., Tsutsui, Y., Kato, L.M. and Fagarasan, S. (2012) The Inhibitory Receptor pd-1 Regulates iga Selection and Bacterial Composition in the Gut. Science, 336, 485-489.
Nomenclature
miRNA: micro-RNAs ASC: Acute Severe Ulcertative Colitis UC: Ulcerative Colitis : kernel application on graphs PSD: Positive Semi-definite Kernel CGs: Conjugate Gradient Methos LN: Log-Normal GLM: Generalized Linear Model PPI: Protein-Protein Interaction : Kronecker product of two matrices : column-stacking operator of a matrix RKHS: Reproducing Kernel Hilbert Spaces G: a set of ordered points generating a graph V: an ordered set of vertices E: set of edges of a graph G : matrix of a graph G : weight of an edge : weight matrix associated to the Kronceker product of two matrices D: node degrees matrix A: adjacency matrix of a graph G : non-negative coefficient of decay for walks of length l : Weisfeiler-Lehman kernels : Weisfeiler-Lehman kernel for : set of node labels matching at least once in a graph at the end of the k-ith Weisfeiler-Lehman iteration : a map counting a specific node label in a graph : Weisfeiler-Lehman subtree kernel on two graphs : Dirac kernel : Weisfeiler-Lehman edge kernel for : Weisfeiler-Lehman shortest path kernel for GO: Gene Ontology database PPs: Peyer’s Patches sIgA/E: immunoglobulins A/E ID2: Inhibitor Of DNA Binding 2 STAT5: Signal Transducer And Activator Of Transcription 5.
Figure S1