Open Journal of Forestry
Vol.04 No.05(2014), Article ID:51031,11 pages
10.4236/ojf.2014.45060
Effects of silvicultural alternatives on model-based financial evaluation of teak (Tectona grandis L.) farm forestry management for small-scale farmers in Northeast Thailand
Iwao Noda1*, Woraphun Himmapan2
1Forestry Division, Japan International Research Center for Agricultural Sciences, Tsukuba, Japan
2Forestry Research and Development Bureau, Royal Forest Department, Bangkok, Thailand
Email: *noda12@affrc.go.jp
Copyright © 2014 by authors and Scientific Research Publishing Inc.
This work is licensed under the Creative Commons Attribution International License (CC BY).
http://creativecommons.org/licenses/by/4.0/


Received 3 August 2014; revised 14 September 2014; accepted 2 October 2014
ABSTRACT
Teak (Tectona grandis L.) plantation management is said to be profitable, but small-scale farmers with teak plantations need to find appropriate and effective choices for plantation management because of their small plots. There have been few studies on how combinations of site quality, rotation and plant spacing affect financial evaluations of teak plantation management quantitatively. In this study, we introduced the yield table for teak plantations in Northeast Thailand, and investigated the effects of site quality with rotation (15-year and 20-year) and spacing (2 m × 4 m and 4 m × 4 m) on the financial evaluation of teak plantation management using discounted cash flow analysis. The equivalent annual incomes (EAI) and benefit/cost ratios (BCR) were negative and <1, respectively, at site indexes (SI) of 14 and 18, but increased ~2 - 3 times as SI rose from 22 (site of medium quality) to 26 and 26 to 30. The 20-year rotation was generally preferable to the 15-year one, especially at SI 22. At SI 30, 2 m × 4 m was more profitable than 4 m × 4 m for both rotations, but at SI 22, 20-year rotation with 4 m × 4 m was the most profitable, followed by 20-year with 2 m × 4 m.
Keywords:
Teak farm forestry, site quality, rotation, spacing, discounted cash flow

1. Introduction
According to a technical mission of the International Tropical Timber Organization (ITTO) to Thailand, rural poverty, the main root cause of deforestation, has not been adequately addressed (Simula et al., 2006). Half of the poor people nationwide are found in the northeast of the country, and the region is now burdened with an increasing wealth gap, insufficient productivity in the private sector, and a worrying environmental situation, according to the National Economic and Social Development Board (NESDB) (Bangkok Post on Mar. 14, 2004). In addition, the region’s forest cover of only 10% is far below the 40% required to maintain its ecological balance.
Through the Thai governmental subsidy project (namely, the 3000 Baht project) on combating deforestation, farmers established 351,000 hectares of tree plantations, including 151,000 hectares of teak (Tectona grandis L.) plantations, from 1994 to 2001 (Royal Forest Department (RFD), 2002). Teak is an indigenous species in Thailand (Kaosa-ard, 1993). Teak is considered as a multipurpose tree for agroforestry in many parts of Asia, Africa and tropical America, including an investment (Bhat & Ma, 2004). Teak is suitable for small-scale planting because of its high value, relatively fast growth and ease of cultivation. However, most small-scale farmers in Thailand never considered the potential benefits of planting teak on their farms. Their lack of interest is explained mainly by two factors: their need for short-term economic returns, and forestry laws that severely restrict the harvest and transport of protected species (Mittelman, 2000). In Northeast Thailand, some farmers have given up teak plantations and returned to the cultivation of other cash crops, or chosen to plant other fast-grow- ing tree species (Yokota et al., 2009; Himmapan et al., 2010). Yokota et al. (2009) and others have pointed out that one of the main reasons for this is that such farmers could not wait 10 or more years with no benefits until teak harvesting. The promotion of forest plantation development in Thailand needs to be accompanied by the dissemination of balanced information on the potential of tree growing, and the positive and negative impacts they can have in certain localities. The proposed solutions include improving knowledge of comprehensive evaluation of the cost-effectiveness and efficiency of incentives in fostering plantation development (Mahannop, 2004). In terms of Thai farmers’ approaches to forestry using the valuable indigenous tree species teak, Noda et al. (2004) suggested multiple uses of their land, and Yokota et al. (2009) suggested a forest future profit projection method, suitable forest planning, and the adoption of combined farm management with teak plantation to cover the no-profit period before teak harvesting. In addition, Phothitai (1993) and Dumrongthai et al. (1999), among others, previously studied the profitability of a teak-only plantation management approach. Niskanen (1998) and Midgley et al. (2007) studied the profitability of teak and cash crop management using agroforestry (intercropping) methods. These, however, didn’t cover effects of rotation and spacing on profitability. Noda et al. (2012) focused on a typical farmer who established a teak plantation in Northeast Thailand, in terms of land size and land use pattern for crops without intercropping, and examined the profitability of cash flow models of teak farm forestry management using cash flow analysis. Selecting better land allocation for the combined management approach improved profitability and mitigated the initial negative earnings caused by teak management. The financial criterion of equivalent annual income (EAI) highly depended on the log prices at the final time of cutting. In terms of the EAI and benefit/cost ratio (BCR), the settings that promoted the profitability of teak farm forestry management were 20-year rotation > 15-year, and 4 m × 4 m spacing > 2 m × 4 m. The benefits in terms of teak plantation cash flow were based on a typical harvest of teak plantation management shown by RFD on a site of average quality.
Teak can be produced under diverse conditions, but high productivity can only be expected on good and accessible sites (Enters, 2000). Site quality can markedly affect the amount of yield and the benefit (Phothitai, 1993; Kaosa-ard, 1998; Balagopalan & Rugmini, 2008; Mandal et al., 2008; Thulasidas et al., 2008). Forest plantation cooperatives in Thailand need suitable knowledge of planting techniques and forest plantation management to provide and support their farmer members with increased productivity and log quality (Himmapan et al., 2010). However, we have had difficulty in finding out about how combinations of site quality, rotation and spacing affect financial evaluations of teak plantation management quantitatively from previous studies. Therefore, in this study, we introduced a yield table for teak plantations in Northeast Thailand published by the RFD-JIRCAS joint research project, and investigated the effects of silvicultural alternatives of site quality, rotation and spacing on the profitability of teak plantation management. Finally, we discussed their relationship in terms of financial aspects.
2. Materials and methods
The study area is one of regions in Thailand, and is bordered by Laos and Cambodia (Figure 1). The alluvial
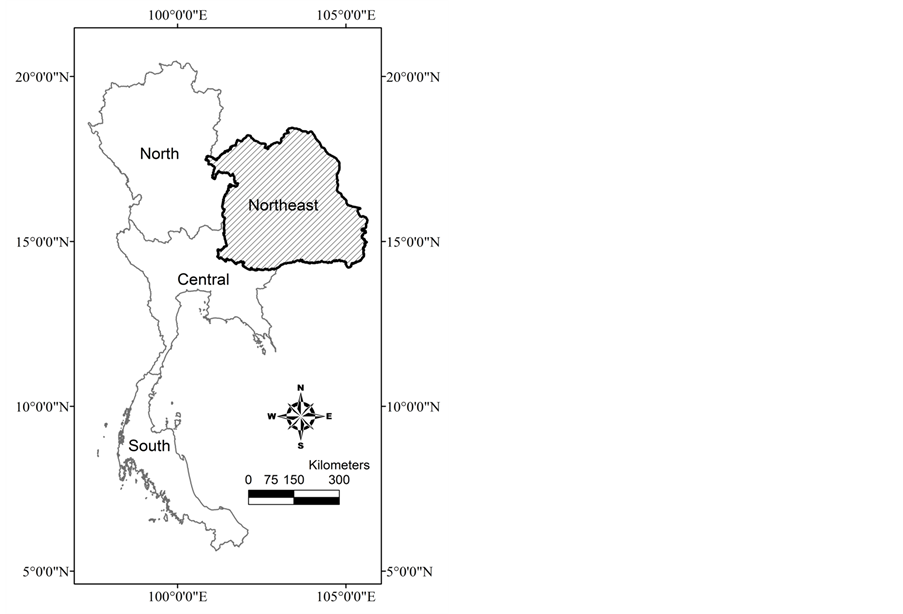
Figure 1. Location of the study area.
plateau of the Korat basin with elevation 100 - 300 m covers two-thirds of the region, and is surrounded by mountainous ranges in the south, west and northeast (Wongwiwatchai & Paisancharoen, 2002). Most of the soils in northeast Thailand are derived from sandstone, shale, or siltstone (Ragland & Boonpuckdee, 1988). The climate of the region has two major seasons, namely the Southwest Monsoon and the Northeast Monsoon, and the Southwest Monsoon is characterized by the wet season with the maximum monthly rainfall of about 300 mm, the Northeast Monsoon is characterized by the dry, moderated slightly by very occasional light showers. The annual rainfall and the monthly mean temperature range from 1100 mm/year and 22˚C to 1800 mm/year and 29˚C, respectively (Phien et al., 1980).
In the study, we selected rotation periods of 15 years and 20 years, and plant spacing of 2 m × 4 m and 4 m × 4 m, as popular alternatives in teak plantation management. Site indexes (SI) of 14, 18, 22, 26, and 30, reflecting poor, slightly poor, medium, slightly good, and good quality, respectively, were used because SI ranges from 14 to 30 in the yield table shown below.
2.1. Yields of teak plantation by site quality
A yield prediction table was constructed under the Reforestation and Extension Project in Northeast Thailand, Phase II (REX II), by RFD and the Japan International Cooperation Agency (JICA) in 1992; it was subsequently revised after more data were obtained in this region under the RFD-JIRCAS project during 2009-2010 (Vacharangkura, 2012). These yield tables are empirically based, but cannot always provide reliable data; therefore, a variable density type of yield table (Vacharangkura et al., 2011) was developed using a multiple linear regression model as an estimation procedure. This model showed high reliability of prediction, and the best precision for stands aged from 5 to 15 years old (Vacharangkura, 2012).
We used the Yield Table for Teak Plantation in Northeast Thailand, which is based on a variable density approach (Vacharangkura et al., 2011), in order to estimate the amount of yield by site quality. The table shows stand age, dominant tree height (DTH), tree height (H), girth at breast height (GBH), stem volume, and yield volume (1 rai = 0.16 hectares) by spacing and SI (Table 1).

Table 1. Case data from the yield table for teak plantation in Northeast Thailand.
SI: site index. DTH: dominant tree height. GBH: girth at breast height over bark.
The yield table does not take into account a thinning effect because there were insufficient samples of a thinning effect in teak plantations. Therefore, the use of this table is limited to estimation of the final cutting yield. In this study, we supposed that no thinning was conducted up to final cutting, and that benefits would be obtained only in relation to the final cutting yield.
For evaluation of the value of yields, the number of trees per rai and the log products per tree were prepared. The number of trees per rai was derived from the yield table, corresponding to the yield volume divided by the stem volume. The types of log products per tree were evaluated by virtual bucking (Noda et al., 2004), with an average size of stem shown as H and GBH. The teak log standard price table as of July 2010, developed by the Forest Industry Organization (FIO), was used to calculate the value of yields for each log product. The teak log standard price is grouped by log length class (<2 m, <4 m, <6 m, and 6 m or more) and mid-girth under bark (MGH) class (25 - 29 cm, 30 - 34 cm, etc.). In this way, the girth under the bark was supposed to be 90% of the girth over the bark.
Unit price per cubic meter becomes higher as log length and MGH increase in the FIO teak log standard price table. In the study, preference of log length was set to 6 m > 4 m > 3 m, and group of log price was selected on the basis of MGH and length, according to the FIO teak log price table. The MGH on the table means the medium value of MGH range on the log price table; for example, MGH 37 cm corresponds to a group of MGH 35 - 39 cm. Each log price was estimated with the set of log length and MGH in the FIO teak log price table, and was summed to be total log price per tree by silvicultural alternative.
2.2. Cash flow modeling of teak plantation management
The costs of initial establishment and other silvicultural factors of teak plantation were based on the standard management plan for reforestation in Northeast Thailand, as recommended by RFD (2006) (Table 2, Table 3). In this study, we assume no thinning and an extensive type of teak plantation management for small-scale farmers. Thus, some activities were changed to zero (no activity), as shown in Table 2 and Table 3. For cash flow analysis, the unit costs of labor, seedlings, and fertilizer were set to 180 baht/day/man, 5 baht/tree, and 10
Table 2. The standard management plan of teak plantation with 15-year rotation.
Note: The data are from a case model of Northeast Thailand (RFD, 2006). The gray cells indicate data set to zero for this study.
baht/kg, respectively, according to the RFD (2006). The benefit was estimated on the basis of the value of the final cutting yield.
2.3. Financial evaluation
In the financial analyses, criteria are calculated using discounted cash flow analysis techniques (Price, 1989; Davis et al., 2005). The criteria used in the study are the net present value (NPV), and the benefit-cost ratio (BCR):
Table 3. The standard management plan of teak plantation with 20-year rotation.
Note: The data are from a case model of Northeast Thailand (RFD, 2006). The gray cells indicate data set to zero for this study.
 (1)
(1)
 (2)
(2)
where Rt, Ct are revenue and cost at time t, and i is the discount rate. For application of NPV, we should select the highest NPV from a group of compatible investments (Price, 1989), and should convert NPV to an annual amount called the EAI to compare forestry investment with other land uses for a certain period using the following formula:
 (3)
(3)
where n is the number of years in the rotation (Friday et al., 2000). In this study, we basically used EAI to compare profitability because we have different rotations of investment project period, 20 years vs. 15 years. However, we determined BCR as reflecting the degree of efficiency. The discount rate for these evaluations was set to 10%.
The ratios of EAIs and the ratios of BCRs were calculated to investigate the effects of silvicultural alternatives on financial evaluation.
3. Results
3.1. Estimation of log products at final cutting
Table 4 shows the length, MGH, and value of log products derived from virtual bucking. Tree value was calculated by adding the 1st, 2nd, 3rd, and 4th log values at final cutting. The tree value increases 7 - 10 times (SI 22) and 27 - 42 times (SI 30) relative that at SI 14, given the same rotation and spacing. Thus, a site of good quality shows a large advantage with a much higher value of trees at final cutting compared with a site of medium quality.
The tree value at 20-year rotation was approximately two times higher than that at 15-year rotation, given the same spacing. The cases with spacing of 4 m × 4 m showed higher tree values than the cases with spacing of 2 m × 4 m. The ratios by the tree value of 4 m × 4 m to 2 m × 4 m were 1.78 (SI 14) > 1.63 (SI 22) > 1.33 (SI 30) with the 20-year rotation, and were 2.21 (SI 14) > 1.51 (SI 22) > 1.44 (SI 30) with the 15-year rotation.
The number of trees per rai refers to the number of trees remaining at final cutting (Table 1). Survival rates at final cutting were 62% - 88% (4 m × 4 m) and 53% -75% (2 m × 4 m) upon 15-year rotation, and 55% - 78% (4 m × 4 m) and 46% - 66% (2 m × 4 m) upon 20-year. The survival rate decreased as SI rose from 14 to 30, and natural selection must have been severer with growth acceleration at sites of better quality. The number of trees decreased to ~90% (SI 18), ~80% (SI 22), ~75% (SI 26), and ~70% (SI 30) relative to that at SI 14. The ratios did not differ markedly depending on rotation and spacing. The numbers of trees with 20-year rotation decreased to 87% - 89% (4 m × 4 m) and ~88% (2 m × 4 m) upon 15-year rotation with the two types of spacing. The numbers of trees with spacing of 4 m × 4 m were 59% - 60% (20-year and 15-year) compared with those of spacing of 2 m × 4 m.
3.2. Financial evaluation of teak Plantation management with different site quality
Revenues at final cutting, and EAIs and BCRs are shown in Table 5. The revenue value was obtained for the product of the number of trees and the tree value. The EAIs and BCRs at SI 14 and 18 were negative and <1, respectively (Table 5). In contrast, the EAIs and BCRs increased ~2 - 3 times if the SI rose from 22 to 26 and 26 to 30. All cases at SI 30 were markedly higher than the other cases of SIs. The EAIs at SI 30 showed 20-year rotation with spacing of 2 m × 4 m > 15-year with 2 m × 4 m > 15-year with 4 m × 4 m and 20-year with 4 m × 4 m. The EAIs at SI 26 showed 20-year rotation with spacing of 2 m × 4 m > 20-year with 4 m × 4 m > 15-year with 4 m × 4 m and 15-year with 2 m × 4 m. The EAIs at SI 22 showed 20-year rotation with spacing of 4 m × 4 m > 20-year with 2 m × 4 m > 15-year with 4 m × 4 m and 15-year with 2 m ×4 m.
Table 4. Estimated value of log products at final cutting.
MGH: mid-girth under bark.
Table 5. Revenue from final cutting and financial criteria of teak plantation management.
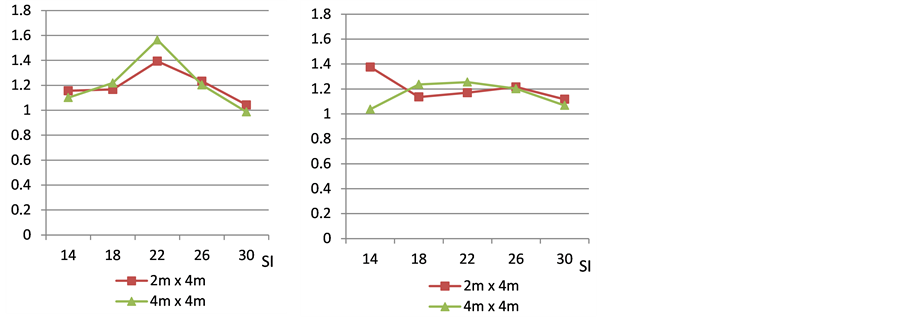
Figure 2(a) shows the ratio of EAI upon 20-year rotation to one upon 15-year rotation. All of the ratios were > 1, except the case (0.99) with 4 m × 4 m and SI 30, so the 20-year rotation would be more beneficial than the 15-year one. In addition, the ratios showed 4 m × 4 m (1.56) > 2 m × 4 m (1.39) (SI 22), 2 m × 4 m (1.16) > 4 m × 4 m (1.10) (SI 14). The values at SI 18 and 26 were ~1.2 (1.17 vs. 1.22) and (1.23 vs. 1.20), without a clear difference between the two types of spacing. The values at SI 30 were 0.99 and 1.04, which did not show clear differences for both rotation and spacing. That is, the EAI of 20-year rotation would increase 1.56 times (SI 22) relative that of the 15-year one, given spacing of 4 m × 4 m. However, given spacing of 2 m × 4 m, the EAI would increase only 1.39 times.
In the same way, Figure 2(b) shows the ratio of BCR upon 20-year rotation to that upon 15-year rotation. All of the ratios were greater than 1, so the 20-year rotation would be more efficient than the 15-year one. The values showed the following order: 4 m × 4 m (1.24 and 1.25) > 2 m × 4 m (SI 18 and 22), 2 m × 4 m (1.38) > 4 m × 4 m (SI 14), ~1.2 (1.22 vs. 1.20) (SI 26) and ~1.1 (1.12 vs. 1.07) (SI 30).
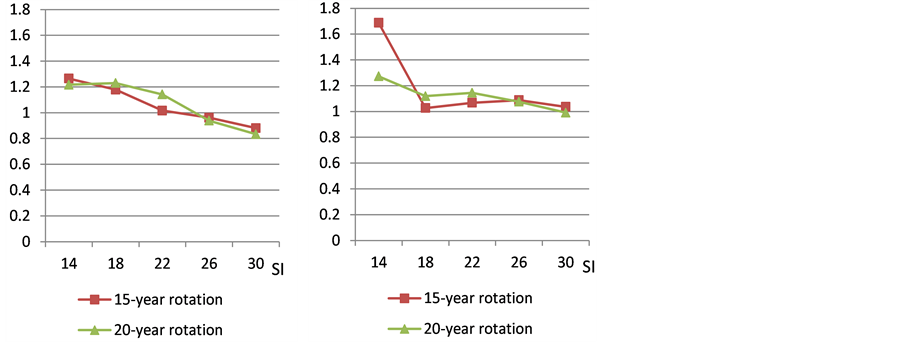
Figure 3(a) shows the ratios of EAI at 4 m × 4 m spacing to that at 2 m × 4 m. The ratios were >1 (SI 14, 18 and 22), and <1 (SI 26 and 30), but close to 1 (SI 26). In addition, the values at SI 22 showed 20-year rotation (1.14) > 15-year rotation (1.02).
The ratios of BCR were >1 (SI 14-30) in Figure 3(b), so 4 m × 4 m would be more efficient than 2 m × 4 m. The values showed 20-year rotation > 15-year rotation (SI 18 and 22) and 15-year rotation > 20-year rotation (SI 14). The difference at SI 14 was marked, since the log products at 2 m × 4 m could not reach regular grades over
 (a) (b)
Figure 2. Comparing 20-year rotation with 15-year one by financial criterion. (a) Ratio = EAI20/EAI15; (b) Ratio = BCR20/BCR15.
 (a) (b)
Figure 3. Comparing 4 m × 4 m with 2 m × 4 m by financial criterion. (a) Ratio = EAI4 × 4/EAI2 × 4; (b) Ratio = BCR4 × 4/BCR2 × 4.
30 cm MGH and corresponded to quite a low price upon 15-year rotation. The values at SI 30 were close to 1 (1.04 vs. 0.99), and did not show clear differences for both rotation and spacing.
4. Discussion
After the text edit has been completed, the paper is ready for the template. Duplicate the template file by using the Save As command, and use the naming convention prescribed by your journal for the name of your paper. In this newly created file, highlight all of the contents and import your prepared text file. You are now ready to style your paper.
4.1. Effect of site quality
In this study, the EAIs and BCRs were markedly dependent on site quality class because tree values at final cutting were quite different among site quality classes. Noda et al. (2012) also showed that the EAIs upon teak plantation management were more highly sensitive to log prices at final cutting than those of thinning, using sensitivity analysis on the uncertainty associated with log price data.
The numbers of remaining trees per rai decreased until final cutting by natural selection. The survival rate decreased as SI rose from 14 to 30, and natural selection must have been severer with growth acceleration at sites of better quality. The survival rate at 4 m × 4 m was higher than that at 2 m × 4 m by a competition-density effect.
The wider spacing of 4 m × 4 m could increase the tree value much more than 2 m × 4 m, at sites of poorer quality. The teak log standard prices of FIO showed a mostly positive linear relationship between price and MGH (Noda et al., 2011; 2012). In addition, lower density can increase the teak growth, in terms of diameter. Thus, at poor and slightly poor sites, wider spacing of 4 m × 4 m rather than 2 m × 4 m increased the teak growth in terms of diameter. At good sites, however, the effect of such wider spacing on diameter growth did not increase the yield so much overall.
Under the silvicultural alternatives of rotation and spacing used in this study, sites of good quality were much more profitable and efficient than those of medium quality, while the applied approach was not recommended for sites of poor (SI 14) and slightly poor quality (SI 18) because it was unprofitable. That is, the good sites showed lower survival rates, but could produce bigger trees. The poor and slightly poor sites produced trees that were too small to yield sufficient benefits, even if many small trees remained at final cutting.
4.2. Effects of rotation and spacing
The trends for profitability and efficiency of teak plantation management were generally as follows: 20-year rotation > 15-year rotation, especially for sites of medium quality (SI 22). The effect of rotation on profitability was unclear at good quality sites (SI 30). The advantage of 20-year rotation over 15-year rotation was also identified by Noda et al. (2012) for teak farm management at sites of average quality, by reference to not only financial analysis but also the price-size relationship. The price-size relationship, which has great significance in harvesting and silvicultural decisions (Price, 1989), showed a decrease at a gradient at ~100 cm MGH in FIO teak log prices, and it could be a target to produce logs of 100 cm MGH (Noda et al., 2012). Okuyama et al. (2005) concluded that the proportion of heartwood of young trees increases abruptly up to 90% at a diameter of ~20 cm, using teak plantation logs from India, and West and Central Java. Therefore 20-year rotation, which was more likely to produce a size of over 60 cm GBH, was preferred to 15-year rotation. This is identical to this study (Table 1).
At good sites, the spacing of 2 m × 4 m was shown to be more profitable than 4 m × 4 m for both rotations. At slightly good sites (SI 26), the 20-year rotation with 2 m × 4 m was the most profitable, followed by 20-year with 4 m × 4 m. At medium quality sites (SI 22), however, the 20-year rotation with 4 m × 4 m was the most profitable, followed by 20-year with 2 m × 4 m. In addition, at poor and slightly poor sites, 4 m × 4 m was more profitable than 2 m × 4 m for both rotations. Thus, sites of good quality took advantage of the spacing of 2 m × 4 m as a primary factor of profitability because of the luxuriant growth of trees. Sites of medium and poorer quality needed wider spacing of 4 m × 4 m, following 20-year rotation, to encourage diameter growth of trees. Noda et al. (2012) identified a similar advantage of 4 m × 4 m over 2 m × 4 m for sites of average quality.
5. Conclusion
The profitability of teak plantations was compared in terms of the following conditions, including site quality as an important factor. Various types of teak plantation management plan were assumed for small-scale farmers in Northeast Thailand, such as 20-year and 15-year rotation, and 4 m × 4 m and 2 m × 4 m spacing. In addition, the management plan was set to no thinning and limited weeding. The results showed that farmers at sites of good quality could expect markedly more profitability and efficiency than those at sites of medium quality. On the other hand, the applied approach was not recommended at sites of poor and slightly poor quality because it was unprofitable. In terms of rotation, generally, 20-year rotation was preferable to a 15-year one, especially at sites of medium quality. In terms of spacing, 2 m × 4 m was preferable to 4 m × 4 m at sites of good quality, but 4 m × 4 m was better than 2 m × 4 m upon 20-year rotation at sites of medium quality. To shed more light on the effects of log prices on financial evaluation, sensitivity analyses will be required for unexpected changes of log prices.
Acknowledgements
This research was conducted under a joint research project between the Royal Forest Department (RFD) and Japan International Research Center for Agricultural Science (JIRCAS) under a program for the improvement of techniques for the utilization of forest resources to promote sustainable forestry.
References
- Bhat, K. M., & Ma, H. O. (2004). Teak Growners Unite! ITTO Tropical Forest Update, 14, 3-5.
- Balagopalan, M., & Rugmini, P. (2008). Site Management of Planted Teak for Optimal Land Use. In K. M. Bhat, M. Balasundaran, K. V. Bhat, E. M. Muralidharan, & P. K. Thulasidas (Eds.), Processing and Marketing of Teak Wood Products of Planted Forests (pp. 197-204). Kerala Forest Research Institute and ITTO.
- Davis, L., Johnson, K. N., Bettinger, P. S., & Howard, T. E. (2005). Chapter 7: Financial Analysis in Forestry. In Forest Management (4th ed.) (pp.317-394). Long Grove, IL: Waveland Press Inc.
- Dumrongthai, K., Kaitpraneet, S., & Suksard, S. (1999). Financial Analysis of 25 Year Rotation Teak Plantation: A Case Study at Mae Li Plantation, Changwat Lamphun. Thai Journal of Forestry, 18, 95-105. (In Thai)
- Enters, T. (2000). Site, Technology and Productivity of Teak Plantations in Southeast Asia. Unasylva, 201, 55-61.
- Friday, J. B., Cabal, C., & Yanagida, J. (2000). Financial Analysis for Tree Farming in Hawaii. Resource Management, 9, 1- 7.
- Himmapan, W., Noda, I., & Furuya, N. (2010). The Study on the Administration of Private Forest Plantation Cooperative of Thailand: A Case Study of Nongbua Lamphu Private Forest Plantation Cooperative Limited. Journal of Forest Management, 8, 1-12.
- Kaosa-ard, A. (1993). Teak in Thailand. In FORSPA, Teak in Asia (pp. 79-85). Bangkok: FAO Publication No. 4.
- Kaosa-ard, A. (1998). Overview of Problems in Teak Plantation Establishment. In M. Kashio, & K. White, (Eds.), Teak for the Future (pp. 49-60). Bangkok: RAP Publication: 1998/5, FAO Regional Office for Asia and the Pacific.
- Mahannop, N. (2004). The Development of Forest Plantations in Thailand. In T. Enters, & P. B. Durst (Eds.), What Does It Take?: The Role of Incentives in Forest Plantation Development in Asia and the Pacific (pp. 211-236). Bangkok: FAO Regional Office for Asia and the Pacific.
- Mandal, A. K., Narayanan, C., Kendurkar, S. V., & Rana, B. S. (2008). Productivity and Wood Quality of Planted Teak in Central India. In K. M. Bhat, M. Balasundaran, K. V. Bhat, E. M. Muralidharan, & P. K. Thulasidas (Eds.), Processing and Marketing of Teak Wood Products of Planted Forests (pp. 267-269). Peechi: Kerala Forest Research Institute and ITTO.
- Midgley, S., Blyth, M., Mounlamai, K., Midgley, D., & Brown, A. (2007). Towards Improving Profitability of Teak in Integrated Smallholder Farming Systems in Northern Laos. ACIAR Technical Reports, 64.
- Mittelman, A. (2000). Teak Planting by Smallholders in Nakhon Sawan, Thailand. Unasylva, 201, 62-65.
- Niskanen, A. (1998). Financial and Economic Profitability of Reforestation in Thailand. Forest Ecology and Management, 104, 57-68. http://dx.doi.org/10.1016/S0378-1127(97)00263-6
- Noda, I., Suzuki, T., Okabayashi, M., & Cha-Umpol, C. (2004). Profitability Analysis of Teak Plantations Management for Small Scale Farmers in the Northeast of Thailand. JICA Study Report.
- Noda, I., Furuya, N., Himmapan, W., Pusudsavang, A., & Komaki, T. (2011). Current Conditions and Issues of Teak Plantation Log Trading and Pricing in Thailand. Kanto Journal of Forest Research, 62, 29-32. (In Japanese)
- Noda, I., Himmapan, W., Furuya, N., & Pusudsavang, A. (2012). Profitability of Combined Farm Management with Teak Plantations in Northeast Thailand. JIRCAS Working Report, 74, 82-89.
- Okuyama, T., Yamamoto, H., Wahyudi, I., & Bhat, K. M. (2005). Some Wood Quality Issues in Planted Teak. In K. M. Bhat, K. K. N. Nair, K. V. Bhat, E. M. Muralidharan, & J. K. Sharma (Eds.), Quality Timber Products of Teak from Sustainable Forest Management (pp. 243-249). Kerala: Kerala Forest Research Institute.
- Phien, H. N., Arbhabhirama, A., & Sunchindah, A. (1980). Rainfall Distribution in Northeastern Thailand. Hydrological Sciences Bulletin, 25, 167-182. http://dx.doi.org/10.1080/02626668009491921
- Phothitai, M. (1993). Growing Teak for Business Purpose. Bangkok: M.P. Reforestation Group, Forestry Industry Organization. (In Thai)
- Price, C. (1989). The Theory and Application of Forest Economics. Oxford: Basil Blackwell Ltd.
- Ragland, J. L., & Boopuckdee, L. (1988). Fertilizer Responses in Northeast Thailand: Nutrient and pH Buffering Capacities. Thai Journal of Soil and Fertilizer, 10, 134-147.
- Royal Forest Department: RFD (2002). Evaluation Report of the Economic Tree Plantation Promotion Project—Year 1994-2000. Bangkok: Forest Plantation Extension Office, Royal Forest Department. (In Thai)
- Royal Forest Department: RFD (2006). Master Plan for Economically Viable Tree Planting at Nong Bua Lum Phu Province. Bangkok: Forestry Research Center, Faculty of Forestry, Kasetsart University. (In Thai)
- Simula, M., Akaha, T., Behari, B., & Malla, Y. (2006). Thailand’s Mission. ITTO Tropical Forest Update, 16, 6-9.
- Thulasidas, P. K., Bhat, K. M., & Florence, E. J. M. (2008). Wood Quality of Planted Teak Outside Forests. In K. M. Bhat, M. Balasundaran, K. V. Bhat, E. M. Muralidharan, & P. K. Thulasidas (Eds.), Processing and Marketing of Teak Wood Products of Planted Forests (pp. 256-263). Peechi: Kerala Forest Research Institute and ITTO.
- Vacharangkura, T., Ishibashi, S., Noda, I., Himmapan, W., Krongkitsiri, V., & Kamolpanit, D. (2011). Yield Table for Teak Plantation in the Northeast of Thailand. Bangkok: RFD-JIRCAS Joint Research Project. (In Thai)
- Vacharangkura, V. (2012). Variable Density Yield Model for Teak Plantations in the Northeast of Thailand. JIRCAS Working Report, 74, 33-40.
- Wongwiwatchai, C., & Paisancharoen, K. (2002). Soil and Nutrient Management of Some Major Field Crops in the Korat Basin of Northeast Thailand. In S. P. Kam, C. T. Hoanh, G. Trébuil, & B. Hardy (Eds.), Natural Resource Management Issues in the Korat Basin of Northeast Thailand (pp. 127-136). Manila: IRRI.
- Yokota, Y., Komaki, T., Furuya, N., Pusudsavang, A., Himmapan, W., Jedsorn, N., & Vacharangkura, T. (2009). Current Condition and Problems of Teak Plantation of Small Scale Farmers in the Northeast Thailand. Kanto Journal of Forest Research, 60, 25-28. (In Japanese)
NOTES

*Corresponding author.