Open Journal of Statistics
Vol.2 No.1(2012), Article ID:17144,4 pages DOI:10.4236/ojs.2012.21013
Statistical Application in Economics
Department of Mathematical Sciences, Clemson University, Clemson, USA
Email: jluo@clemson.edu
Received September 24, 2011; revised October 28, 2011; accepted November 10, 2011
Keywords: Truncate Statistics; ROC Curve; False Discovery Rate
ABSTRACT
Statisticians have recently proposed some methods for ranking the gene variables with outlier expressions. The major attraction of these methods is their ability to select the variables which show systematic decrease or increase in only a subset of samples in the disease group. In order to fully account for the outliers, in this article, we truncate the expression values and propose an alternative method to rank the variables with systematic increase or decrease. The proposed statistic is very simple to implement. Simulations and real data study show that the proposed statistic has a more powerful ability to rank the variables than some methods in literature.
1. Introduction
Two-group data appears in many different fields such as biology and economics. Two-group data presents an interesting difference between the two groups. In this article, one group is called the normal group and the other one is the so-called disease group. In a biological data, the variables are genes. Scientists found that in some biological data, some genes showed systematic increase or decrease in the disease group (see [1-4]). Those gene variables are greatly helpful in developing a treatment. So the detection of those genes becomes our primary goal.
In the literature, there are methods to detect the variables which show systematic increase or decrease in the disease group (see [5-7]). As the most often used one, t-statistic assumes that all the samples in the disease group come from a distribution with a higher mean than those in the normal group. Efron and others in [8], Dudoit and others in [9] summarized the statistical assessment of differential expression in genomic studies. In their study, two sample t-statistic is used to test the difference of gene expressions under two different conditions. Tomlin and others in [10] observed that for some gene variables, only a subset of samples in the disease group show increase compared to the samples in the normal group. The discovery violates the assumption in t-statistic. Tomlins and others in [10] developed a new method called “cancer outlier profile analysis” (COPA) to detect the genes with differential expressions. They proved that the COPA is more powerful than t-statistic for detecting cancer outliers. In 2006, Tibshirani and Hastie in [11] argued that the outlier sum (OS) statistic is a better approach to detect differentially expressed genes than COPA statistic because OS statistic makes full use of the information from all the disease samples by summing up the outliers in the disease group. OS statistic considers robust estimation of mean and takes consideration of more disease samples than COPA. Their arguments are demonstrated by the simulation results.
Recently, Wu in [12] found an alternative method to detect the differentially expressed genes. Wu proposed the method known as outlier robust t-statistic (ORT) using modifications of two-sample t-statistic. In [12], Wu compared the three statistical methods, t-statistic, COPA and OS, to his ORT method and concluded some nice features of the ORT statistic. In his simulation study, Wu showed the detection power of ORT is the best in terms of the smallest false discovery rate. In this paper, we will adopt the truncation method and modify ORT statistic to formulate a new ranking statistic. In simulations, the new statistic is compared to the existing methods in terms of the receiver operating characteristic (ROC) (see [13-16]) scores.
This article also provides the simulation study on a real economic data. In economics, sometimes we are interested in finding out if there is a difference before and after macroeconomic environment changes such as the financial crisis in 2007. The series of bank and insurance company failures led to stock markets worldwide crash. As a consequence, the real GDP growth rates of lots of countries in the world fell. In this paper, 44 main countries are chosen to study which countries’ real GDP growth rate fell the most during the crisis. Here we treat each country as a gene variable and the real GDP growth rate is the expression value. The collected data has the observations from the first quarter of 2006 to the fourth quarter of 2008. The data ranging from first quarter of 2006 to second quarter of 2007 is defined statistic. We then can rank the countries based on the statistical values. The rankings are compared to the existing results in literature.
The rest of the article is organized as following. We start with reviewing the four main methods in literature, and then propose the new statistic in Section 2. Simulation studies are conducted in Section 3 and a real example analysis is also presented in Section 3.
2. The Truncated Ranking Statistic
This article considers a 2-class data for detecting outlier gene variables. Let  be the expression values from a normal group for gene
  and sample
  and
and  be the expression values from disease group for gene and sample
 . The standard t-statistic for a 2-sample test is
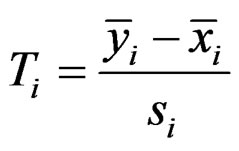
Here  and
and  are the sample means for gene i in the normal group and the disease group, respectively. The denominator
  is the pooled standard deviation for the gene variable i.
The t-statistic is powerful when the alternative distribution is such that  all come from a distribution with a higher mean than
 . Since it is already known that only a small proportion of cancer samples for outlier genes is over-expressed, t-statistic could be inefficient for detecting such genes under the new assumption. To improve the detection power, Tomlins in [10] defined the COPA statistic, which is the rth percentile of standardized samples in the disease group. The formula is
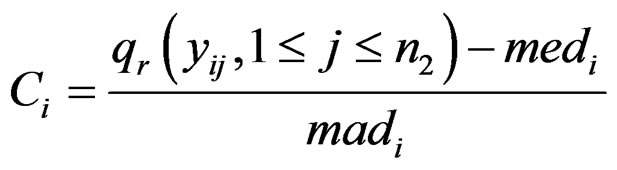
where  is the rth percentile of the data,
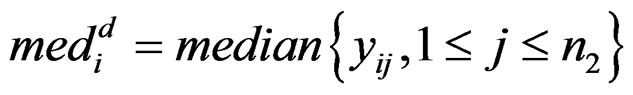
  is the median of all values for gene i, and
  is the median absolute deviation of all expressions for gene i. The choice of r is subjective. Obviously, the COPA statistic
  only utilizes a single value in
 . In order to improve the statistic, [4] introduced outlier-sum:

where  and
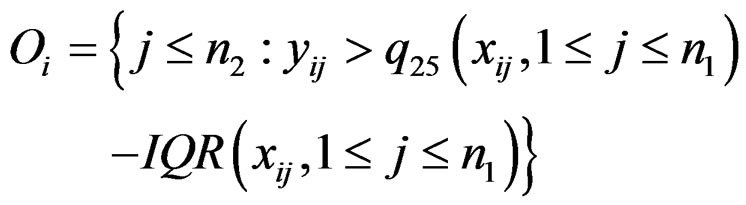
and  are the rth percentile and the interquartile range of all expressions for gene i, respectively. Outlier-sum statistic defines outliers in the disease group based on the pooled sample for gene i, but it makes more sense to define outliers based on the control group. Accordingly, Wu in [12] defined outlier robust t-statistic:

where
 ,
,
and
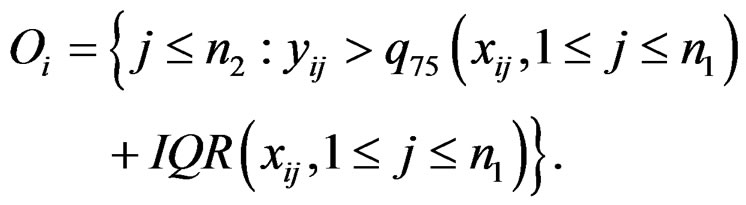
The statistic ORT concentrates on the outlier set . However, it uses all the values from disease group. As the outliers from disease group may influence the median absolute deviation, it is more reasonable to truncate the values in the disease group and thus to fully consider the outliers in the disease group for each gene variable. So I replace the
  with the median of truncated expressions which fall in the complements of the outlier set
 . The new statistic is called truncated outlier robust t-statistic (TORT):
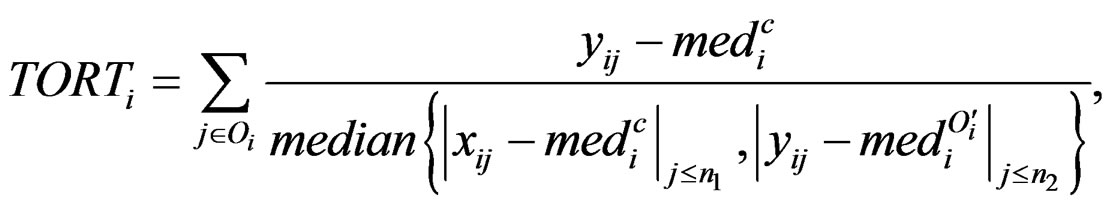
where we define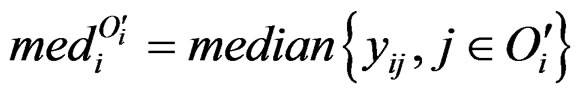 . People may also be interested in detecting systematic decrease. Here are the formulas:

where
and

3. Simulation Study and Comparison
In this paper, a number of simulations were carried out to compare the performance of t-statistic, COPA, OS, ORT and TORT. According to [11], r = 0.90 is used for COPA. Both simulation study and real data comparison are presented in the section.
3.1. Comparison Based on Simulated Data
The data was generated from standard normal with p = 1000 variables and  samples. For various values of m, which is the number of differentially expressed variables, we added a constant µ, the overexpression magnitude, to those m variables for k samples in the disease group.
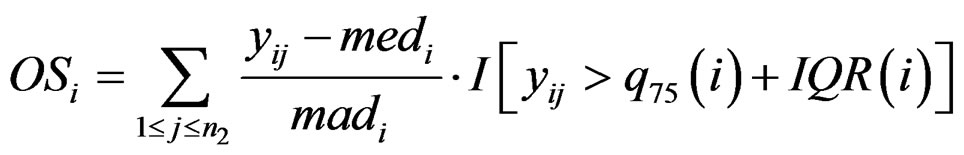
When µ = 2, m = 100 and k = 20, 15, 10, 6, 3, 1, we estimated ROC curves by choosing different thresholds for gene calls. The process was repeated for 50 times. Each point on the ROC curves is the average of 50 true/ false positive rates when a value is selected for the gene call. Figure 1 shows the estimated true/false-positive rates based on 50 simulations. When k = 20, 15, both TORT and ORT perform the best and OS performs the worst. TORT continues to perform the best and slightly better than t-statistic when k = 10. For a smaller k, such as k = 3, t-statistic starts to be inefficient while TORT still shows strong detection power. For an even smaller k = 1, TORT also performs the best. The Figure 1 demonstrates that TORT performed the best for almost all k values and never performed significantly worse than any other method. It appears that the TORT formula has captured the difference between the two groups in the best way among the five methods.
A different value µ = 1 was also considered as a smaller over-expression magnitude, m = 200 and a sequence of k = 20, 15, 10, 6, 3, 1 and estimated their ROC curves to investigate if a small systematic increase in DE genes affects the performance of various methods. The result shows the same pattern as the Figure 1. We will then illustrate the application of TORT on a public economic data.
3.2. Simulation on a Real Economic Data
Due to the financial crisis originated from United States, the real GDP growth rates of a lot of countries fell from 2007. We have picked the GDP growth rates of 44 countries ranging from first quarter in 2006 to the fourth quarter in 2008. The data was obtained from www.tradingeconomics.com and can be downloaded upon request. We regard the data from first quarter in 2006 to the second quarter in 2007 as the normal group and the rest data as the disease group. The countries are acting as the genes. Our goal is to rank the countries according to the decreasing pattern. In Table 1, we report the top ten countries ranked by TORT and their rankings according to other methods.
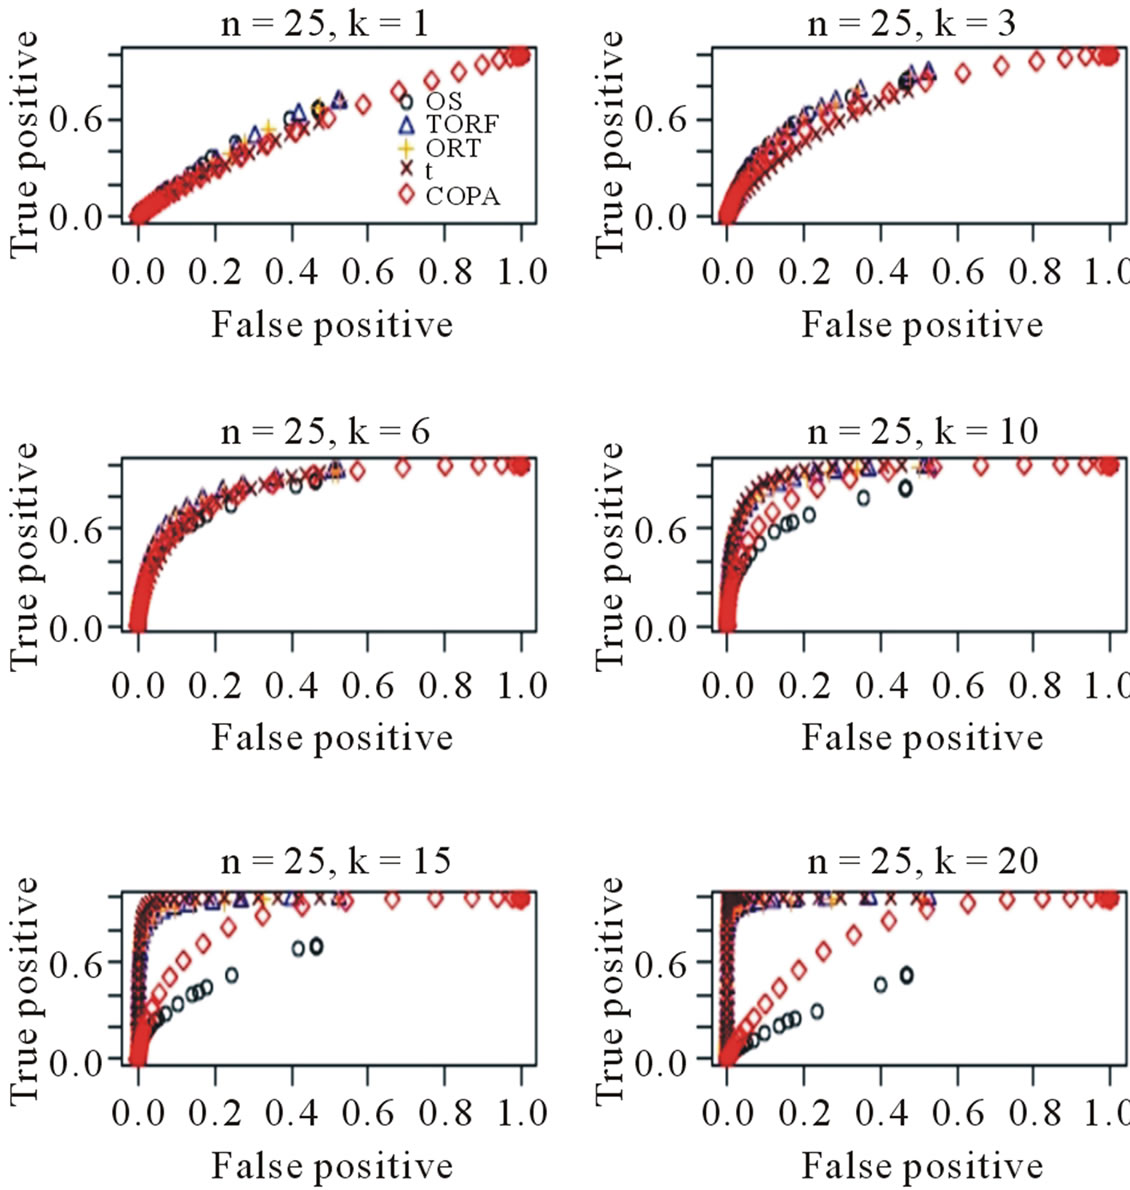
Figure 1. ROC curves estimated based on 50 simulations. Various k values are chosen.
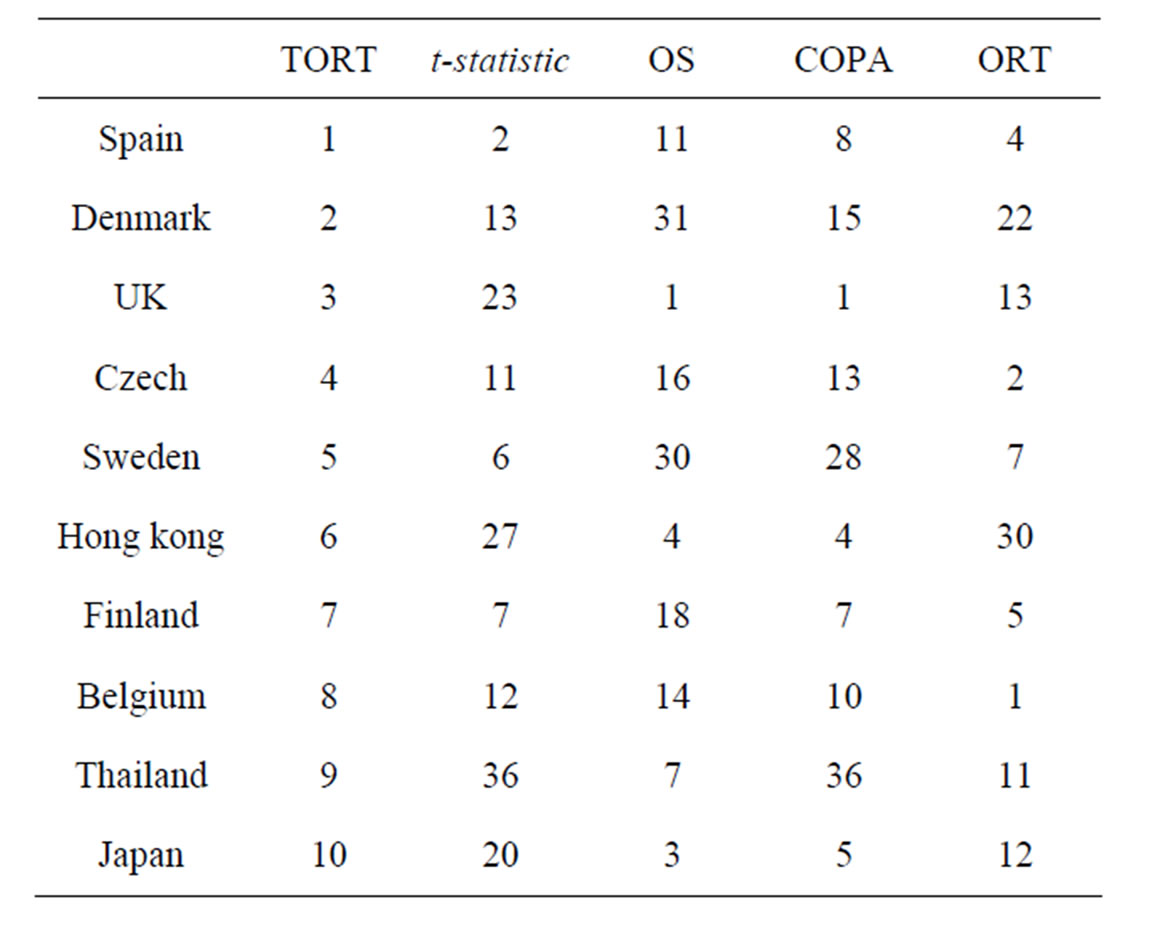
Table 1. Ranking of countries by various method.
From National Accounts-GDP-statistics explained, an authorized website, http://epp.eurostat.ec.europa.eu/statitics$\_$explained/index.php/National$\_$accounts$\ _$$\%$E2$\%$80$\%$93$\_$GDP, as a result of the global financial and economic crisis, the euro area accounted for 76.0% of the total decrease, while the sum of the five largest EU economies (Germany, France, the United Kingdom, Italy and Spain) was 71.6%. Based on their result, we expect to identify Germany, France, the United Kingdom, Italy and Spain as the top countries which fell the most. As shown in Table 1, the truncated ORT included both UK and Spain in the top three countries which fell the most in the crisis. However, the other four methods will only identify one country in their top list. The fact demonstrates the advantage of our new method over the existing methods.
REFERENCES
- T. Golub, D. Slonim, P. Tamayo, C. Huard, M. Gaasenbeek, J. Mesirov, H. Coller, M. Loh, J. Downing and M. Caligiuri, “Molecular Classification of Cancer: Class Discovery and Class Prediction by Gene Expression Monitoring,” Science, Vol. 286, No. 5439, 1999, pp. 531-536. doi:10.1126/science.286.5439.531
- V. Tusher, R. Tibshirani and G. Chu, “Significance Analysis of Microarrays Applied to the Ionizing Radiation Response,” Proceedings of the National Academy of Sciences of the United States of America, Vol. 98, No. 9, 2001, pp. 5116-5121. doi:10.1073/pnas.091062498
- J. Lyons-Weiler, S. Patel, M. Becich and T. Godfrey, “Tests for Finding Complex Patterns of Differential Expression in Cancers: Towards Individualized Medicine,” BMC Bioinformatics, Vol. 5, No. 110, 2004, pp. 1-9.
- D. Allison, X. Cui, G. Page and M. Sabripour, “Microarray Data Analysis: From Disarray to Consolidation and Consensus,” Nature Reviews Genetics, Vol. 7, No. 1, 2006, pp. 55-65. doi:10.1038/nrg1749
- M. West, C. Blanchette, H. Dressman, E. Huang, S. Ishida,R. Spang, H. Zuzan,J. Olson, J. Marks and J. Nevins, “Predicting the Clinical Status of Human Breast Cancer by Using Gene Expression Profiles,” Proceedings of the National Academy of Sciences of the United States of America, Vol. 98, No. 20, 2001, pp. 11426-11467. doi:10.1073/pnas.201162998
- K. Rieger, W. Hong, V. Tusher, J. Tang, R. Tibshirani and G. Chu, “Toxicity From Radiation Therapy Associated with Abnormal Transcriptional Responses to DNA Damage,” Proceedings of the National Academy of Sciences of the United States of America, Vol. 101, No. 17, 2004, pp. 6635-6640. doi:10.1073/pnas.0307761101
- D. Witten and R. Tibshirani, “A Comparison of Fold Change and The t-Statistic for Microarray Data Analysis,” Technical Report, Stanford University, 2007.
- B. Efron, R. Tibshirani, J. Storey and V. Tusher, “Empirical Bayes Analysis of a Microarray Experiment,” Journal of the American Statistical Association, Vol. 96, No. 456, 2001, pp. 1151-1160.
- S. Dudoit, Y. Yang, M. Callow and T. Speed, “Statistical Methods for Identifying Differentially Expressed Genes in Replicated cDNA Microarray Experiments,” Statistica Sinica, Vol. 12, No. 1, 2002, pp. 111-139.
- S. Tomlins, D. Rhodes, S. Perner, S. Dhanasekaran, R. Mehra, X. Sun, S. Varambally, X. Cao, J. Tchinda, R. Kuefer, et al., “Recurrent Fusion of Tmprss2 and ETS Transcription Factor Genes in Prostate Cancer,” Science, Vol. 310, No. 5748, 2005, pp. 644-648. doi:10.1126/science.1117679
- R. Tibshirani and R. Hastie, “Outlier Sums for Differential Gene Expression Analysis,” Biostatistics, Vol. 8, No. 1, 2007, pp. 2-8. doi:10.1093/biostatistics/kxl005
- B. Wu, “Cancer Outlier Differential Gene Expression Detection,” Biostatistics, Vol. 8, No. 3, 2007, pp. 566-575. doi:10.1093/biostatistics/kxl029
- B. Efron and R. Tibshirani, “Empirical Bayes Methods and False Discovery Rates for Microarrays,” Genetic Epidemiology, Vol. 23, No. 1, 2002, pp. 70-86. doi:10.1002/gepi.1124
- K. Dobbin, J. Shih and R. Simon, “Questions and Answers on Design of Dual-label Microarrays for Identifying Differentially Expressed Genes,” Journal of National Cancer Institute, Vol. 95, No. 18, 2003, pp. 1362-1369. doi:10.1093/jnci/djg049
- S. Wang and J. Chen, “Sample Size for Identifying Differentially Expressed Genes in Microarray Experiments,” Journal of Computational Biology, Vol. 11, No. 4, 2004, pp. 714-726. doi:10.1089/cmb.2004.11.714
- Y. Pawitan, S. Michiels, S. Koscielny, A. Gusnanto and A. Ploner, “False Discovery Rate, Sensitivity and Sample Size for Microarray Studies,” Bioinformatics, Vol. 21, No. 13, 2005, pp. 3017-3024. doi:10.1093/bioinformatics/bti448