Vol.2, No.1, 12-17 (2010) Natural Science
http://dx.doi.org/10.4236/ns.2010.21002
Copyright © 2010 SciRes. OPEN ACCESS
Synthesis of nano crystalline spatulae of lead zirconate
titanate (PbZr0.52Ti0.48O3)
S. S. Bhatt*, S. C. Chaudhry, Neeraj Sharma, Sonia Gupta
Department of Chemistry, Himachal Pradesh University, Shimla, India; ssbhatt2k@yahoo.com
Received 15 October 2009; revised 29 October 2009; accepted 2 November 2009.
ABSTRACT
A simple and effective method for the synthesis
of nano-crystalline PZT spatulae has been re-
ported near MPB via a new Solution-Ignition
Synthesis route and has been characterized by
FT-IR, XRD, TG/DTG/DTA and SEM techniques.
X-ray line broadening and Scherrer formula
show crystallite size to be~20 nm. Densities of
nano-crystalline spatulae of PZT in pellet form
made by using 2% PVA and without PVA have
been found to be 5.35 and 7.51 gm/cm3 respec-
tively compared to the theoretical value of 7.78
gm/cm3. Dielectric constants of 83 and 227 of
these spatulae with dielectric loss 0.118 and
0.0609 at 1 MHz and a high resistivity value of
3.043 * 107 cm for PZT pellets made without
PVA suggest these nano-crystalline PZT spatu-
lae to be the potential candidates for high fre-
quency applications.
Keywords: Nanostructures; Chemical Synthesis;
Infrared Spectroscopy; X-ray Diffraction; Dielectric
Properties
1. INTRODUCTION
In advanced ceramics technology, the production of
good quality powders using different synthetic routes
has always been an essential requirement to obtain mate-
rials with desired properties, purity and stoichiometry. It
is because of an ever-increasing pace of development of
various technological innovations to sustain competitive
advantage, that various synthetic methods such as self-
propagating high temperature synthesis (SHS) [1], sol-
gel [2], hydrothermal [3-6], solution combustion synthe-
sis (SCS) [7] and wet grinding solid state thermal reac-
tion (a combination of SHS and SCS methods) [8] have
been reported in literature for the preparation of inor-
ganic oxide materials. Metal oxide of composition
PbZr0.52Ti0.48O3, synthesized by sintering process be-
tween 1200°C and 1300°C is known to be quite impor-
tant for technological applications due to its ferroelectric
and piezoelectric properties near morphotropic phase
boundary (MPB) [9,10]. For multilayer components and
thick film devices, it is desirable to bring down its sin-
tering temperature, thereby reducing energy consump-
tion and PbO evaporation.
In view of these interesting reports, we have therefore
made an attempt to synthesize nano-crystalline spatulae
of lead zirconate titanate, PbZr0.52Ti0.48O3, near mor-
photropic phase boundary (MPB) by a novel method,
solution ignition synthesis (SIS). This method is better
than other methods in a way that by igniting the solution
drop-wise, the surface area is increased and heat pro-
duced during ignition is sufficient to rise the internal
temperature per ignited drop, thereby reducing the over-
all high temperature sintering requirement for the ce-
ramics.
2. MATERIALS AND METHODS
2.1. Chemicals
The starting materials used for the preparation of lead
zirconate titanate powder i.e. lead acetate Pb (CH3COO)2.
3H2O, zirconyl nitrate ZrO(NO3)2 H2O and titanium tetra
isopropoxide Ti [(OPri
4] were of E Merck and used as
such without further purification.
2.2. Preparation of ‘As-Ignited Powder’
A solution of lead acetate Pb(CH3COO)2. 3H2O (5 gm,
0.0131 mol) in acetic anhydride was added drop-wise to
a mixture solution of ZrO(NO3)2. H
2O, (1.5848gm,.
00685 mol) and titanium tetra isopropoxide Ti(OPri)4,
(1.7984 gm, 0.006326 mol) dissolved in the same sol-
vent, with continuous stirring and a temperature of 60oC
during the course of addition was maintained. The re-
sulting clear mixture solution was then ignited by drop-
wise addition over aperiod of 4-5 hours into preheated
silica crucible kept at 200oC. Yellow colored solid mass
formed during the course of addition was scratched from
the walls of silica crucible after cooling it to room tem-
perature. It was finally grinded to a fine powder and la-
beled as “as-ignited powder”. The post annealing of the
S. S. Bhatt et al. / Natural Science 2 (2010) 12-17
Copyright © 2010 SciRes. OPEN ACCESS
13
13
“as-ignited powder” was done in an electric furnace at
600oC and 700oC for four hours in each case.
2.3. Instrumentation
FTIR spectra were scanned in KBr pellets using single
grating Nicolet 5700 series FTIR spectrophotometer in
the range of 4000-200 cm-1. Thermal analysis curves
(TGA/DTG/DTA) of the synthesized powders were re-
corded on a double pan SHIMADZU DTG-60H (simul-
taneous TG/DTA module) thermal analyzer. The ther-
mocouple used was Pt/Pt-Rh (10%) with a temperature
range from ambient to 1300٥C. The thermal investiga-
tions were carried out by heating the sample in a Pt cru-
cible in nitrogen atmosphere and using -Al2O3 as ref-
erence. A heating rate of 20٥C min-1 was employed. The
instrument calibration was checked periodically with a
sample of CuSO4.5H2O. Powder X-Ray Diffraction pat-
terns were recorded on PANalytical XPERT-PRO dif-
fractometer system using a typical wavelength of
1.54060 Ao (Cu-K radiation). The diffraction angle 2θ
was varied from 10-70o. The morphology, exact size and
shape of the lead zirconate titanate (PZT) particles were
determined by recording FESEM of PZT powder an-
nealed at 700oC on Hitachi S-4700 model.
For electrical measurements, two types of pellets, one
by using 2% PVA as binder and other without PVA, were
made from nano-crystalline PZT spatulae annealed at
700oC. Pelletization was done by applying 15 tons of
pressure on nano PZT powder put into a circular dye,
from a hydraulic press for 5 minutes and then sintered at
700oC. Both the sides of the sintered pellets were
cleaned, smoothened with a very fine sand paper and
electroded by applying silver paste. Current Voltage (I-V)
measurements were made by using two probe method on
Kaithley Source Meter (Model 2611), while dielectric
studies were done by measuring capacitance of the sam-
ple with metal-insulator-metal (MIM), Agilent 4285A,
75 KHz to 3 MHz precision LCR meter.
3. RESULTS AND DISCUSSION
The synthesis of nano-crystalline PZT powder of com-
position Pb(Zr0.52Ti0.48)O3 near MPB by Solution-Ignition
Synthesis has been shown in Figure 1.
3.1. FTIR Studies
A perusal of the FTIR spectra of as-ignited PZT powder
(Figure 2a) shows no absorption bands at 2912cm-1,
1652cm-1 and 1560 cm-1 attributed to νC-H and νC=O
modes of acetate group indicating complete ignition of
organic material used for the synthesis of samples. The
absorption bands occurring at 1428 cm-1 and 1110 cm-1,
may be ascribed to νC-O modes of the trapped atmos-
pheric carbon dioxide in the PZT material [11]. Interest-
ingly, the intensity of these two bands decreases signifi-
cantly when annealed at 600oC (Figure 2b) and disap-
pears completely at 700oC (Figure 2c). Another distinct
absorption band observed at 563 cm-1 has been assigned
to νM-O mode which is characteristic of the formation of
ABO3 type of perovskite structure of PZT powder [12].
The effect of annealing at 600oC and 700oC on the char-
acteristic bands is apparent from the shift of νM-O band
from 563cm-1 to higher wave numbers, 590cm-1 and
592cm-1 respectively, presumably due to increased
number of M-O bonds in the perovskite phase of PZT
material. In addition, the band at 592cm-1 in the sample
annealed at 700oC has been found to be more intense
than the band at 590cm-1 annealed at 600oC, confirming
thereby the formation of more of perovskite phase at
higher temperature.
Figure 1. Scheme for the preparation of lead zirconate ti-
tanate powder by solution-ignition synthesis (SIS).
Figure 2. FTIR spectra of a) as-ignited PZT powder; b)
powder annealed at 600oC; c) powder annealed at 700oC.
S. S. Bhatt et al. / Natural Science 2 (2010) 12-17
Copyright © 2010 SciRes. OPEN ACCESS
14
3.2. Thermal Analysis
Thermo analytical curves (TG/DTG/DTA) for as-ignited
PZT powder (Figure 3 blue in color) show only one step
decomposition in the range 275.93oC to 331.77oC with a
weight loss of only 1.005% as is also substantiated by
only one peak in DTG at 311.52oC and an endothermic
peak at 307.51oC in DTA curve indicated the escape of
carbon dioxide gas trapped in as-ignited PZT powder.
The TG/DTA curves (Figure 3 red in color) of as-ignited
powder annealed at 600oC, however, has shown neither
any weight loss in TG nor any peak in DTA curve indi-
cating the complete removal of carbon dioxide gas
trapped in the lattice of nano-crystalline PZT powder.
3.3. XRD Studies
Powder XRD pattern of as-ignited PZT powder (Figure
4a) shows broad and an ordered arrangement of peaks,
indicating the formation of nano-crystalline lead zircon-
ate titanate, presumably resulting from the internal heat
produced during drop-wise ignition of the reaction mix-
ture solution. Further, the pyrochlore phase which was
present initially at 28.5o 2θ with relative intensity of 100%
(657 counts) in as-ignited PZT powder (Figure 4a) gets
significantly reduced at 600oC and completely trans-
formed into perovskite phase at 31.0538o 2θ value after
annealing at 700oC (Figures 4b and 4c). Apparently,
therefore, the results of the PXRD patterns of as-ignited
PZT powder coupled with FTIR and thermo analytical
curves suggest that the solution ignition synthesis (SIS)
is a novel method of synthesis of nanocrystalline PZT
spatulae.
Indexing of the XRD patterns of nano-crystalline PZT
powder annealed at 700oC (Figure 4c) has been done by
matching them with the patterns of known PZT powder
of composition Pb(Zr0.52Ti .4 8)O3 [13,14]. Lattice pa-
Figure 3. Thermal analysis (TGA/DTA/DTG) curves of
as-ignited PZT powder (red) and PZT powder annealed at
600oC (blue).
Figure 4. Powder X-ray diffraction patterns of: a)
as-ignited PZT Powder; b) PZT powder annealed at
600oC; and c) at 700oC (-Perovskite phase and-Py-
rochlore phase).
rameters of the sample annealed at 700oC (c=4.32159Ao
and a=b= 4.06907Ao ) obtained from (001) and (100)
reflections at 20.5522o and 21.8429o 2θ values respec-
tively in XRD pattern with slight lattice distortion (c/a)
values to be 1.0620 have been found to be very close to
that of 1.066 of pure tetragonal phase [15]. Further, the
sharpness of the diffraction peaks in the XRD pattern
(Figure 4c) suggests better homogeneity and crystallin-
ity of the nano PZT spatulae. It is pertinent to mention
here that with the increase in annealing temperature of
as-ignited powder from 600oC and finally to 700oC, a
substantial increase in the intensity (counts) of the
perovskite (110) orientation has been observed thereby
confirming the enhanced crystallinity.
S. S. Bhatt et al. / Natural Science 2 (2010) 12-17
Copyright © 2010 SciRes. OPEN ACCESS
15
15
The relative amounts of perovskite and pyrochlore
phases (Table 1) have been determined from the relative
intensity of XRD peaks by using following equation [16]:
(110)
(110) (pyro)
I
% perovskite phase = I I
where I(110)-relative intensity of the peak due to (110)
orientation and I(pyro)-relative intensity of pyrochlore
phase. A perusal of the results in Table 1 indicates that
amount of pyrochlore phase decreases while the
perovskite phase increases with the increase in annealing
temperature.
Apart from the tetragonal phase depicted from the
XRD pattern of the PZT powder annealed at 700oC, the
relative percentage of rhombohedral and tetragonal
phases has been calculated from the triplets of the type
(002)T, (200)R and (200)T appearing at 44o-46o 2θ range
in the XRD pattern [17] using relation:
(200)
R
(200) (200)(002)
PR
RTT
I
III

where PR represents rhombohedral phase, IR (200) is inten-
sity of (200) reflection of rhombohedral phase, IT (200)
and IT (002) is intensity of (200) and (002) reflections of
tetragonal phase. The results show that percentage of
rhombohedral and tetragonal phase in the present nano-
crystalline PZT powder is 30% and 70% respectively
indicating thereby that the chemical composition of syn-
thesized nano-crystalline PZT powder lies near to Mor-
photropic Phase Boundary.
3.4. Crystallite Size, Shape and Density
3.4.1. Size
Broadening of the peaks observed in the XRD patterns
(Figures 4a-4c) indicates particles in the nano range.
Crystallite size of the nano-crystalline PZT powder an-
Table 1. % phases in the nano-crystalline PZT powder samples.
S.
No. Name of Sample %
Perovskite
%
Pyrochlore
1 As-ignited powder 36.10 63.89
2 Powder annealed at
600oC 71.81 28.18
3 Powder annealed at
700oC 97.43 2.57
nealed at 600oC and 700oC has been calculated by using
Scherrer Equation i.e.
k
Crysttalite size = cos
where k is the constant of proportionality (Scherrer con-
stant) and depends on how the width line is determined
and value of k is generally taken as 0.9. λ represents the
wavelength of the X rays and has a value of 1.54060Ao,
θ is the half of the angle (2θ) of diffraction and β is the
value of broadening of (110) line at Full Width Half
Maximum (FWHM) of in radians and has been found to
be 13.6 nm which increases to 21.4 nm respectively.
Such an increase in the crystallite size with increase in
annealing temperature finds support from earlier reports
in literature [18,19].
3.4.2. Shape
FESEM of the nano-crystalline PZT powder annealed
at 700oC (Figure 5) shows a mixture of both spherical
particles and stacks of nano spatulae of about 204 nm
in width. The spherical nature of the crystallite has
been attributed to the high pressure exerted by the
evolution of gases such as CO2, N2, O2, etc. during the
course of ignition reaction [20] while the formation of
stacks of nano spatulae may be attributed to the partial
melting and subsequent solidification during drop-
wise ignition of the PZT powder in the preheated sil-
ica crucible.
Figure 5. FESEM of nano-crystalline PZT spatulae.
S. S. Bhatt et al. / Natural Science 2 (2010) 12-17
Copyright © 2010 SciRes. OPEN ACCESS
16
3.4.3. Densities and Porosity
Densities of pellets of nano-crystalline PZT powder (one
made with 2% PVA as a binder and other without PVA
each of 15 mm in diameter and 1.3 mm thickness) meas-
ured by Archimedes Principle have been found to be
5.35 and 7.51 gm/cm3 respectively. These densities are
68.76% and 96.5% of the theoretical value (7.78
gm/cm3). The percentage porosity of PZT pellets has
been calculated from the relation:
0
% (1)100porosity  
where ρ and ρo are the experimental and the theoretical
densities of PZT (7.78 gm/cm3) and have been found
to be 31.24 % and 3.48 %.
3.5. Electrical Properties of Lead Zirconate
Titanate of Composition Pb (Zr0.52Ti 0. 48)O3
3.5.1. D. C. Resistivity
Resistivity has been obtained from current-voltage
studies of the pellet prepared from nano-crystalline
PZT powder annealed at 700oC by the two probe
method using a Keithley Source meter (Model 2611).
From a plot of Current vs Voltage (Figure 6) resis-
tance ‘R’ has been calculated from the slope of the
plot as, ()
I
slope RV
and the resistivity ‘ρ using
the well known relation, (ohm meter)
RA
d
where
A represents the area of the cross section and d is the
thickness of the pellet.
A high resistivity value of 3.043 * 107 cm found in
the present studies has been attributed to the stoichio-
metric composition, better crystal structures and im-
proved microstructures obtained by this new solution
ignition synthesis (SIS) technique. The higher value of
resistivity is also of significant importance as it makes
this nano-crystalline PZT spatulae suitable for high fre-
quency application.
Figure 6. Current (I) vs Voltage (V) plot of nano-crystal-
line PZT pellet.
3.5.2. Dielectric Studies
The dielectric constant (ε) and dielectric loss (tan δ) of
sintered pellets of nano-crystalline PZT spatulae (with
2% PVA and without PVA) as function of frequency at
different temperatures have been studied and trends are
shown as graphs in Figures 7a and 7b. The values of 83
and 227 for dielectric constant and 0.118 and 0.0609 for
dielectric loss have been found at a frequency of 1MHz
which remains nearly same in the higher frequency
range (up to 3MHz). Further, a comparison of the values
of both dielectric constant (227 and 249) and dielectric
loss (0.0609 and 0.042) at 298 K and 373 K respectively
at constant frequency of 1MHz (Figure 8) shows an
increase in dielectric constant with decrease in dielectric
loss values. These observed low values of dielectric con-
stants have been found to be in agreement with the fact
that small grains attain low values of dielectric constant
and can stabilize dielectric relaxation up to higher fre-
quency region [21]. These studies also indicate that nano-
crystalline spatulae of lead zirconate titanate, Pb
(Zr0.52Ti 0.48)O3 synthesized near MPB with almost same
values of dielectric constant and dielectric loss over a large
range of frequencies (up to 3 MHz) may find their role as
successful and stable dielectrics in the field of electronics.
(a) (b)
Figure 7. Variation of dielectric constant and dielectric loss with frequency at room temperature for: a) PZT pellet with
2% PVA; and b) PZT pellet without PVA.
S. S. Bhatt et al. / Natural Science 2 (2010) 12-17
Copyright © 2010 SciRes. OPEN ACCESS
17
17
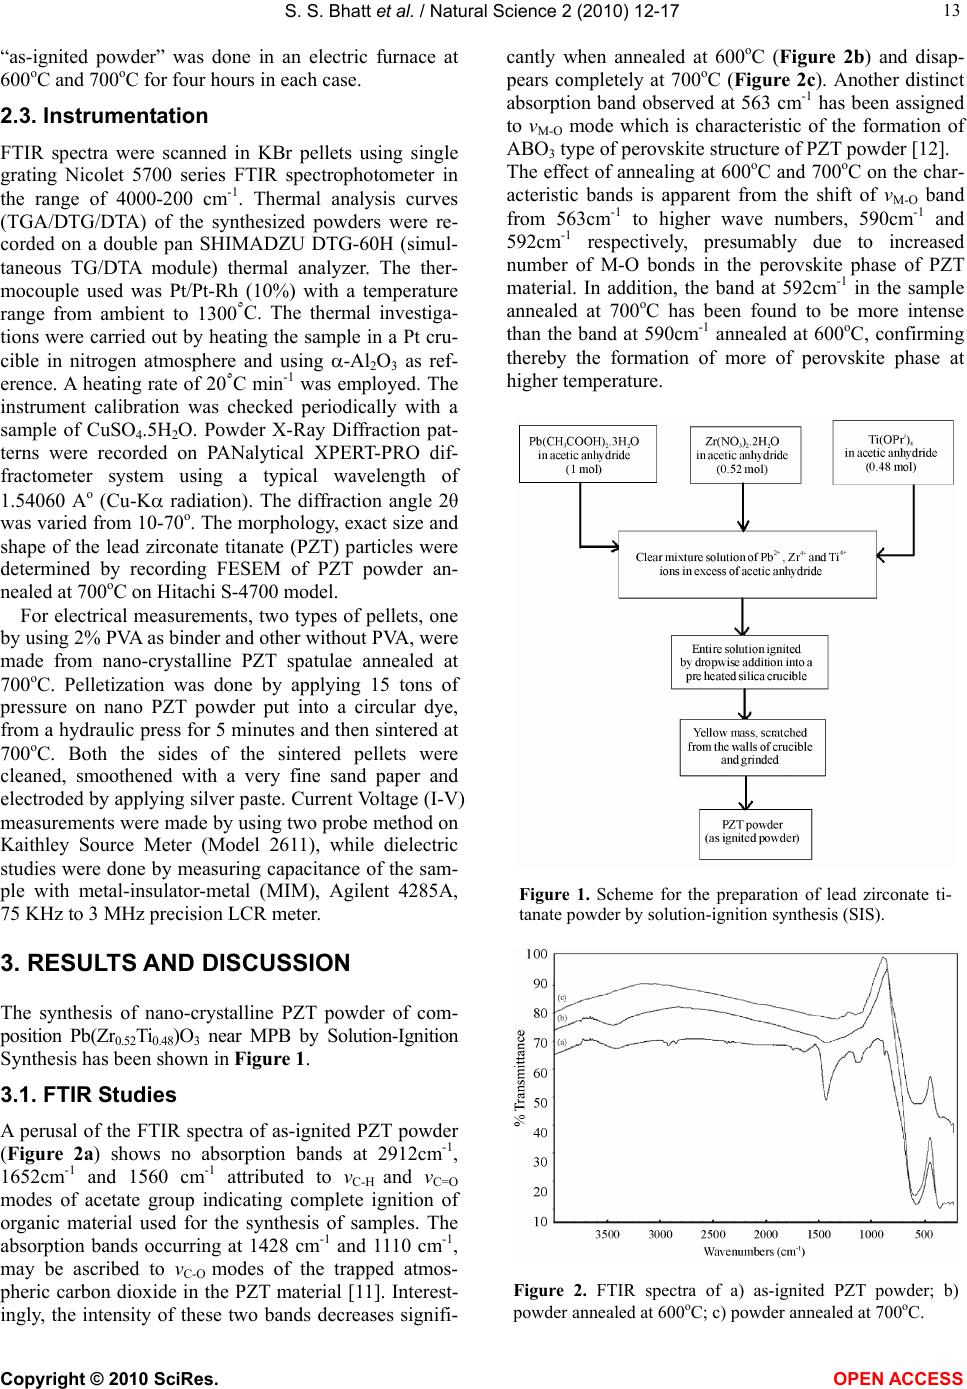
Figure 8. Variation of dielectric constant and dielectric loss
with temperature at 1 MHz frequency for PZT pellet without
PVA.
4. CONCLUSIONS
The present work describes a simple, effective and novel
synthetic strategy namely Solution Ignition Synthesis
(SIS) route for the preparation of nano-crystalline PZT,
which is advantageous over other commonly employed
methods. The FTIR and XRD patterns of the nano crys-
talline PZT spatulae confirmed their perovskite structure
near MPB. The dielectric constant and high values of
resistivity also suggest that they may find their role as
potential materials suitable for high frequency applica-
tions and as stable dielectrics.
5. ACKNOWLEDGEMENTS
The authors wish to acknowledge University Grants
Commission, New Delhi and Department of Science and
Technology, GOI for providing necessary instrumenta-
tion facilities and financial support in the form of SAP
and FIST programs to the Department of Chemistry.
REFERENCES
[1] Merzhanov, A.G. (1990) Twenty years of search and
findings in combustion and Plasma Synthesis of high
temperature materials. Edited by Munir, Z.A. and Holt, J.
B., New York VCH Publ. Inc., 1-35.
[2] Livage, J. (1994) The sol-gel route to advanced materials.
Mater. Sc. Forum, 152 & 153, 43-54.
[3] Cheng, H.M., Ma, J.M., Zhu, B. and Cui, Y.H. (1993)
Reaction mechanisms in the formation of lead zirconate
titanate solid solutions under hydrothermal conditions. J.
Am. Ceram. Soc., 76(3), 625-629.
[4] Traianidis, M., Courtois, C., Leriche, A. and Thierry, B.
(1999) Hydrothermal synthesis of lead zirconium titanate
(PZT) powders and their characteristics. J. Europ. Ceram.
Soc., 12(19), 1023-1026.
[5] Kutty, T.R.N. and Balachandran, R. (1984) Direct pre-
cipitation of lead zirconate titanate by the hydrothermal
method. Mater. Res. Bull., 19(11), 1479-1488.
[6] Lencka, M.M., Anderko, A. and Riman, R.E. (1995)
Hydrothermal precipitation of lead zirconate titanate solid
solutions: thermodynamic modeling and experimental
synthesis. J. Am. Ceram. Soc., 78(10), 2609-2618.
[7] Mukasyan, A.S. and Dinka, P. (2007) Novel approach to
solution-combustion synthesis of nano-materials. Int. J. Self
Propagating High Temperature Synthesis, 16(1), 23-35.
[8] Vijaya, M.S., Senthilkumar, R., Sridevi, K. and Subramnia,
A. (2005) Preparation and piezoelectric properties of lead
zirconate titanate ceramics. Ferroelectrics, 325, 43-48.
[9] Jaffe, B., Roth, R.S. and Marzullo, S. (1954) Piezoelec-
tric properties of lead zirconate lead titanate solid solu-
tion ceramics. J. Appl. Phys., 25, 809-810.
[10] Kakegawa, K., Mohri, J., Shirasaki, S. and Takahasi, K.
(1982) Sluggish pansition between tetragonal and rhom-
bohedral phases of Pb(Zr,Ti)03 prepared by application of
electric field. J. Am. Ceram. Soc., 65(10), 515-519.
[11] Wang, Y. and Jorge, J. (2003) FTIR characterization of
PZT nano fibers synthesized from metallo-organic com-
pounds using electro spinning. Mat. Res. Soc. Symp. Proc.,
736, D2.9.1-D2.9.6.
[12] Samuneva, B., Jambazov, D., Lepkova, D. and Dimitriev,
Y. (1990) Sol-gel synthesis of BaTiO3 and Ba1-x-y aySrx
ZryTi1- y)O3 perovskite powders. Ceram. Int., 16, 355-360.
[13] Sen, A., Seal, A., Das, N., Mazumdar, R. and Maiti, H.S.
(2005) Technological challenges of making PZT based
piezoelectric wafers. Proc. Int. Conf. Smart Mater. Str.
Sys., SC41-SC48.
[14] Kakegawa, K., Mohri, J., Takahashi, T., Yamamura, H.
and Shirasaki, S. (1977) Compositional fluctuation and
properties of Pb(Zr,Ti)O3. Powder Diffraction File PDF-
2 Database Sets 1-45, International Centre for Diffrac-
tion Data (ICDD), 24, 769-772.
[15] Chu, S.Y. and Chen, C.H. (2001) Effect of calcium on the
piezoelectric and dielectric properties of Sm-modified
PbTiO3 ceramics. Sensors and Actuators, 89 (3), 210-214.
[16] Lakeman, C.D.E. and Payne, D.A. (1992) Processing ef-
fects in the sol gel preparation of PZT dried gels, powders
and ferroelectric thin layers. J. Am Ceram. Soc., 75, 3091.
[17] Mishra, S.K., Pandey, D. and Singh, A.P. (1996) Effect of
phase coexistence at morphotropic phase boundary on
the properties of Pb (ZrxTi 1x)O3 ceramics. Appl. Phys.
Lett., 69, 1707-1709.
[18] Thamjaree, W., Nhuapeng, W. and Tunkasiri, T. (2004) Ana-
lysis of X-ray diffraction line profiles of lead zirconate titan-
ate using fourier method. Ferroelectric Letter, 31, 79-85.
[19] Verma, K.C., Kotnala, R.K., Mathpal, M.C., Thakur, N.,
Gautam, Prikshit and Negi, N.S. (2009) Dielectric prop-
erties of nano-crystalline Pb0.8Zr0.2Ti O 3 thin films at dif-
ferent annealing temperature. Materials Chemistry and
Physics, 114, 576.
[20] Nersisyan, H.H., Lee, J.H. and Won, C.W. (2005) SHS of
ceramic powders in the fusion salts of alkali metal. J.
Ceram. Process. Res., 6(1), 41-47.