Engineering, 2010, 2, 46-54
doi:10.4236/eng.2010.21006 Published Online January 2010 (http://www.scirp.org/journal/eng/).
Copyright © 2010 SciRes. ENGINEERING
Vibration Monitoring of Rotating Systems
K. N. EDE1, E. A. OGBONNAYA2, M. T. LILLY3, S. O. T. OGAJI4, S. D. PROBERT4
1Method Engineer, Netco-Dietsmann Nigeria Limited, Port Harcourt, Nigeria
2Department of Marine Engineering, Rivers State University of Science and Technology, Port Harcourt, Nigeria
3Department of Mechanical Engineering, Rivers State University of Science and Technology, Port Harcourt, Nigeria
4School of Engineering, Cranfield University, Bedfordshire, United Kingdom
E-mail: kingston2004@yahoo.com, ezenwaogbonnaya@yahoo.com, s.ogaji@cranfield.ac.uk
Received June 6, 2009; revised August 3, 2009; accepted August 10, 2009
Abstract
Most energy-conversion machines (e.g. vehicle engines and electric motors) involve rotating components
(e.g. roller bearings and gears), which generate vibrations. The behavior of a pump which includes a deliber-
ate fault was chosen to illustrate this assertion. The test bearing at the driven end of the pump’s motor was
deliberately damaged using a 1.5mm wire-cutting method and an adjustable coupling disk introduced to im-
pose a shaft misalignment of 40. The resulting undesirable behavior of the pump was observed. Experimental
data were measured at various speeds of the rotor. The sample period at various operating frequencies were
0.9, 0.6 and 0.45s respectively. The ball-passage frequency was observed at 4.4, 8.8, 13.2 and 17.6Hz. A
computer-based analytical model was developed, in visual basic, for monitoring the machine failures: this
led to an integrated system-process algorithm for diagnosis of faults in rotating components.
Keywords: Vibration Measurement, Rotating Component, Ball-Passage Frequency, Alarm Limit
1. Introduction
The use of vibration analysis as a fundamental tool for
condition monitoring of equipment has evolved over the
last 35 years. With parallel developments in electronic
equipment, transducers and computers, the monitoring of
machines is now almost completely automated. Onboard
microprocessors provide the ability to capture pertinent
measurements and analyze them via suitable algorithms,
then store and display the conclusions. Several acceler-
ometers, velocity transducers and displacement pick-ups
have been developed and adapted to suit the pertinent
requirement of industrial applications [1]. Modification
of a rolling-element bearing activity monitor (REBAM)
system offers a high signal-to-noise ratio relative to those
for a casing-mounted accelerometer or velocity trans-
ducer, as shown in Figure 1 [2]. A system’s signal-to-
noise ratio is defined as the ratio of the amplitude of the
desired signal to the amplitude of the noise signal. In-
creased signal-to-noise ratios for accelerometers have
been achieved through the use of electronic filters [3].
REBAM vibration signals can be separated into rotor-
vibration and prime-spike regions. This signal separation
improves the signal-to-noise ratio for both regions. By
measuring directly the vibrations at the rolling-element
bearing outer-ring and displacements are relative to the
machine casing.
This isolates the signal of interest from extraneous
vibrations (e.g., due to structural resonances, steam
throttling, pump cavitation, gear noise, etc.) which of-
ten mask the bearing-defect signals when casing-
mounted transducers are employed. The results obtained
indicate that this signal separation technique makes
REBAM twice to eight times more sensitive to bearing
faults than casing-mounted transducers [4]. A signifi-
cant feature of this frequency analysis is the effective
computation of the fast Fourier-transformation (FFT),
which converts digital information from the time do-
main to the frequency domain and thereby achieves a
more rapid spectral-analysis [5].
Long-term data storage is now a well accepted practice.
However difficulties occurred when random-vibration
Accelerometer System
Shaft Relative System (Proximity probe observing the
shaft’s surface)
Velocity Transducer System
REBAM System (Proximity probe observing the bearings outer ring)
Low Signal-to-Noise Ratio High
Figure 1. Qualitative indication of relative magnitudes of
signal-to-noise ratios for various transducers.
K. N. EDE ET AL.47
envelope spectrum algorithms for identifying defects in
rolling-element bearings were applied to gearing. Extra
lines appeared in the envelope spectrum due to the dy-
namic loads applied to the bearings by the gears. Addi-
tionally, spectral lines associated with the rolling-element
bearings occasionally disappeared from the spectrum.
Investigations were conducted in order to overcome
these complications [6]. This led to the introduction of
the demerit of a bi-spectrum-based quickest-change de-
tector, which was an extension of the analogous quickest
detector based on the power spectrum [7]. The ensuant
effective predictive maintenance can result in an 8%
maintenance-cost saving and a further 8% increase in
productivity [8], and hence the associated energy-thrift.
1.1. Glossary
An accelerometer, in the present context, is a transducer
whose electrical or mechanical output is directly propor-
tional to the acceleration experienced.
An alarm limit is the maximum permitted predicted
value of the considered parameter, i.e. it indicates when
attained that a dangerous situation is developing and so
the alarm is triggered.
The ball-passage frequency is the frequency of the ball
in a bearing component that will generate specific fre-
quency dependent upon the bearing’s geometry and its
rotational speed.
The bearing-passage frequencies are the frequencies of
rotation of the ball, outer race, inner race and cage.
A coupling-disc or flexible connecting system is a ro-
bust general purpose pin/buffer coupling, that facilitates
a reliable fail-safe transmission of the torque between
two nominally-coaxial shafts; it possesses the capability
of being able to function despite a misalignment of the
shafts.
A fast Fourier-transform is a numerical operation
commonly used for transposing data rapidly from the
time domain to the frequency domain, and usually ac-
complished via computer.
The gap, in the present context, is the air-filled separa-
tion between the rotor and stator.
Harmonics are components of a spectrum which are
integral multiples of the fundamental frequency.
In the context of this article, imbalance (or a lack of
balance) results from the distribution of mass according
to the radial direction of the rotating system.
Outer-race-ball passage frequency is the rate at which
a point on the specified rolling element passes a point on
the outer bearing-race.
Inner-race-ball passage frequency is the rate at which
a point on the specified rolling element passes a point on
the inner bearing-race.
Prime spike is a term used by Bently Nevada to de-
scribe a vibration frequency range which includes those
bearing frequencies that are generated by the rolling
elements experiencing either an inner or outer race flaw.
A probe, in the present context, is a sensor capable of
detecting the vibration signal.
The raceway is the ball passage frequency relative to
the inner and outer ring of the bearing.
Rack-configuration software is a tool for configuring
integrated control-switching. It is designed to have a
3500/40 proximity monitor and a four-channel monitor
that accepts inputs that can trigger alarms.
Rolling-element frequency is the frequency at which
either the balls or rollers revolve about their own center-
lines in a bearing.
Ringing of the bearing occurs when ever the ball hits
the flaw on the outer race of the bearing.
A signal, in the present context, is an electric voltage
or current, which is an analogue of the vibration being
measured.
In the context of this article, Spike energy is a measure
of the energy generated by the repetitive impacts of the
rolling elements against the defect in the bearing.
A time base is a horizontal line (representing time)
about which the waveform representing the vibration
signal occurs, i.e. the representation of a vibration signal
in the time domain is a wave form.
A transducer is a device that converts the magnitude of
one physical parameter into the value of another pa-
rameter, usually an electrical signal. The transducer used
in vibration measurements is usually an accelerometer.
2. The Aim
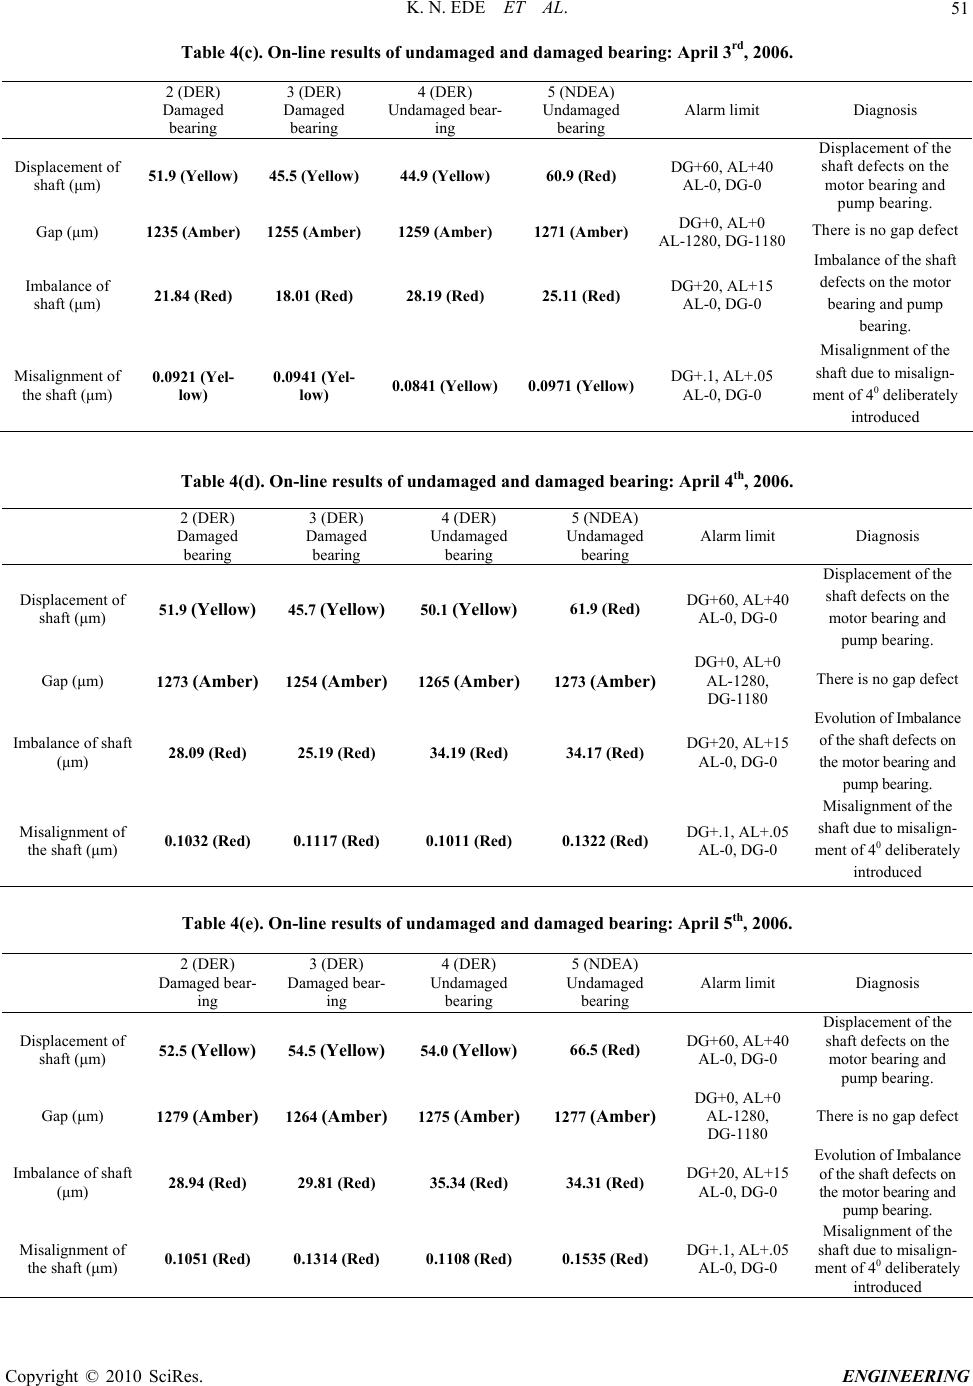
This study investigates the occurrences of common ma-
chine-faults (i.e. rolling-element bearing and gear failures,
misalignment of the shaft and imbalance of the shaft) that
lead to energy wastages. The bearings were tested when
undamaged and the resulting data were used as a
bench-mark. An accelerometer was employed to obtain
the vibration data from on-line measurements. The result-
ing information made available by the sensor and ampli-
fier, was translated into useful knowledge about the forces
on the machine and vibration patterns: the latter was clas-
sified according to the defects detected. Alarm limits were
setup and programmed for the data collected. Fault-
diagnosis software (FDS) for vibration monitoring of
pumps and turbines has as a result been developed in this
investigation: this is available from the authors.
2.1. Instrumentation
The characteristics of the employed standard vibration-
measuring instrument for the applied range of 0.5
to14000Hz, the power supply was a 4mA constant cur-
rent at 23VDC, and 3 contact probes were available.
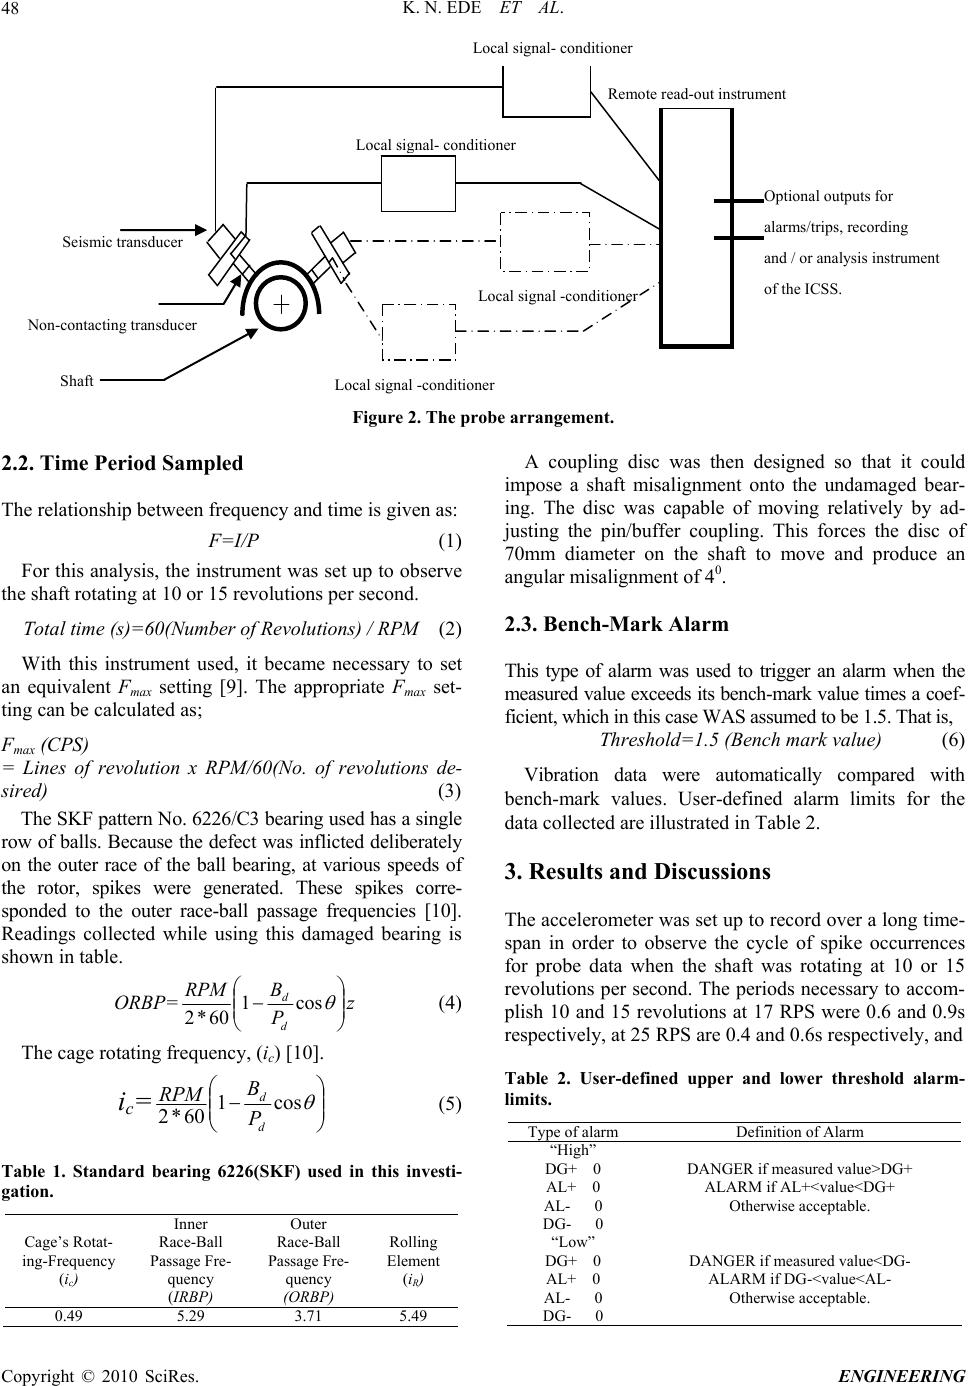
Bently Nevada eddy-probes were installed on the test rig.
A 3500/40 proximity four-channel monitor that accepts
inputs to drive the alarms and programs is shown sche-
matically in Figure 2.
Copyright © 2010 SciRes. ENGINEERING
K. N. EDE ET AL.
48
Local si
g
nal- conditioner
Local signal -conditioner
Optional outputs for
alarms/trips, recording
and / or analysis instrumen
t
of the ICSS.
Local signal -conditioner
Shaft
Seismic transducer
Remote read-out instrument
N
on-contacting transducer
Local signal-conditione
r
Figure 2. The probe arrangement.
2.2. Time Period Sampled
The relationship between frequency and time is given as:
F=I/P (1)
For this analysis, the instrument was set up to observe
the shaft rotating at 10 or 15 revolutions per second.
Total time (s)=60(Number of Revolutions) / RPM (2)
With this instrument used, it became necessary to set
an equivalent Fmax setting [9]. The appropriate Fmax set-
ting can be calculated as;
Fmax (CPS)
= Lines of revolution x RPM/60(No. of revolutions de-
sired) (3)
The SKF pattern No. 6226/C3 bearing used has a single
row of balls. Because the defect was inflicted deliberately
on the outer race of the ball bearing, at various speeds of
the rotor, spikes were generated. These spikes corre-
sponded to the outer race-ball passage frequencies [10].
Readings collected while using this damaged bearing is
shown in table.
ORBP= z
P
B
RPM
d
d
cos1
60*2 (4)
The cage rotating frequency, (ic) [10].
ic=
cos1
60*2d
d
P
B
RPM (5)
Table 1. Standard bearing 6226(SKF) used in this investi-
gation.
Cage’s Rotat-
ing-Frequency
(ic)
Inner
Race-Ball
Passage Fre-
quency
(IRBP)
Outer
Race-Ball
Passage Fre-
quency
(ORBP)
Rolling
Element
(iR)
0.49 5.29 3.71 5.49
A coupling disc was then designed so that it could
impose a shaft misalignment onto the undamaged bear-
ing. The disc was capable of moving relatively by ad-
justing the pin/buffer coupling. This forces the disc of
70mm diameter on the shaft to move and produce an
angular misalignment of 40.
2.3. Bench-Mark Alarm
This type of alarm was used to trigger an alarm when the
measured value exceeds its bench-mark value times a coef-
ficient, which in this case WAS assumed to be 1.5. That is,
Threshold=1.5 (Bench mark value) (6)
Vibration data were automatically compared with
bench-mark values. User-defined alarm limits for the
data collected are illustrated in Table 2.
3. Results and Discussions
The accelerometer was set up to record over a long time-
span in order to observe the cycle of spike occurrences
for probe data when the shaft was rotating at 10 or 15
revolutions per second. The periods necessary to accom-
plish 10 and 15 revolutions at 17 RPS were 0.6 and 0.9s
respectively, at 25 RPS are 0.4 and 0.6s respectively, and
Table 2. User-defined upper and lower threshold alarm-
limits.
Type of alarm Definition of Alarm
“High”
DG+ 0
AL+ 0
AL- 0
DG- 0
DANGER if measured value>DG+
ALARM if AL+<value<DG+
Otherwise acceptable.
“Low”
DG+ 0
AL+ 0
AL- 0
DG- 0
DANGER if measured value<DG-
ALARM if DG-<value<AL-
Otherwise acceptable.
C
opyright © 2010 SciRes. ENGINEERING
K. N. EDE ET AL.49
at 33 RPS are 0.3 and 0.45 seconds respectively.
When a ball was located near the point where the
probe is mounted (left side, 450 from the top) see Figure
3, the outer race, due to the ball pressing on the defect,
interacts and the resulting impacts excited a natural reso-
nant frequency of the machine, caused the bearing to ring,
and deform away from the bearing centre and towards
the probe. This corresponds to the high peak-points in
the time-domain plot shown in Figure 4.
3.1. Damaged Bearing
This was located at the driven-end bearing of the motor
assembly and imposed by a flexible coupling to the AC
motor. Three rotational speeds were used in the experi-
ment to show the bearing-passage frequencies (see Table
3). The spectrum in Figure 5 indicates a mass imbalance
of the shaft (F0) at 2x. The Outer Race-Ball Passage Fre-
quency of the bearing at 17 RPS, i.e., the 2xORBP=8.2.
Harmonic frequencies were generated due to 40 mis-
alignment of the shaft which disturbs the natural full mo-
tion of the shaft and this is often characterized by rub-
bing. The friction between the rubbing parts produced a
broadband of high frequencies, some of the kinetic en-
ergy is released in the form of harmonic vibrations. The
2x harmonics is indication of failure of the bearing, i.e.
the most dominant amplitude. Lower frequency vibration
was also transmitted through the coupling and even was
amplified on the other end of the machine pump; this is
indication of low amplitude on the frequency domain.
However, the vibrations observed were often symptoms
accentuating other vibration problems which gradually
propagated and generated increased noise level and tem-
perature of the equipment.
4. Fault-Diagnostic Software (FDS) Program
This program was written in visual basic. It is an on-
line-based data simulation and monitoring process for a
pump or turbine defects. The FDS was composed using
rack-configuration software. For this reason, the flow
chart shown in Figure 6 was developed to describe the
adopted monitoring procedure. The process accepted
basic process information, such as acquired data or sig-
nals from a PLC on the ICSS on-line [11]. The electronic
control of the test equipment and the conventional con-
nection of proximity probes for on-line data-acquisition
via the PLC unit that was associated with the monitor
(4-channel orbit analysis), therefore, was able to capture
radial vibration, thrust position, and eccentricity. The
module received input from many types of displacement
transducers.
4.1. Vibration Measurements
To monitor this equipment on-line, the measured data
were compared with their preset threshold values (in
4
5
0
Outer race defect spot that comes
into contact with rollers
ω
+
Right probe
L
eft
robe
4
5
0
Figure 3. Probe orientations and outer race defect spot
causing “ringing” of the bearing.
Amplitude (μm)
Time (s)
0.50
0.25
0.00
-0.25
-0.50
0.05 0.10 0.15 0.20 0.25
Figure 4. Outer-race deflection of the shaft which is rotat-
ing at 17 RPS.
3x
2x
4x
1x
F
0
2 4 6 8 10 12 14 16 18
Frequency (Cycles/second)
0.6
0.4
0.2
Amplitude (µm)
Figure 5. Frequency spectrum of the bearing operating at
17 RPS.
order to indicate alarm and danger).
4.2. Simulation of All Alarms
Three categories of alarm severity were observed during
the series of tests.
1) Alert 1 (Yellow alarm) indicated that small in be-
havioral changes are occurring: it provides an early warn-
ing of a deteriorating situation, i.e. an on-line displacement
defect, as seen in Tables 4(b) to 4(f) and Figure 7(a).
2) Alert 2 (Amber alarm) was the result of the next
measurement and indicated that maintenance planning
had to be scheduled.
Copyright © 2010 SciRes. ENGINEERING
K. N. EDE ET AL.
Copyright © 2010 SciRes. ENGINEERING
50
3) Danger (Red alarm). This serious situation requires
immediate attention, as the measurements show consistent
evolution of the defect(s), which was an indication of the
severity observed as shown in Tables 4(a) to (e) for
on-line imbalance and misalignment of the shaft, as shown
in Tables 4(e) and 4(f) and Figures 7(c) and 7(d).
Table 3. Bearing-passage frequencies of the bearing.
Shaft speed (RPS) Outer Race-Ball Passage Fre-
quency (cycles/second)
Theoretically bearing-passage frequency
(cycles/second)
(ORBP=zic)
Experimentally observed bear-
ing-passage frequency
(cycles/second)
1 x ORBP 4.4 4.1
2 x ORBP 8.8 8.2
3 x ORBP 13.2 12.3
17
4 x ORBP 17.6 16.4
1 x ORBP 8.8 8.2
2 x ORBP 17.6 16.4
3 x ORBP
26.4 24.6
25
4 x ORBP
35.2 32.8
1 x ORBP 13.2 12.3
2 x ORBP 26.4 24.6
3 x ORBP 39.6 36.9
33
4 x ORBP 52.8 49.2
Table 4(a). On-line bench-mark measurements for undamaged bearing: December 14th, 2005.
2 (DER)
Undamaged bearing
3 (DER)
Damaged bearing
4 (DER)
Undamaged bearing
5 (NDEA)
Undamaged bearing Alarm limit
Displacement of
shaft (μm) 15.9 (Amber) 26.5 (Amber) 21.9 (Amber) 22.9 (Amber) DG+60, AL+40
AL-0, DG-0
Gap (μm) 1208 (Amber) 1254 (Amber) 1255 (Amber) 1230 (Amber) DG+0, AL+0
AL-1280, DG-1180
Imbalance of
shaft (μm) 10.09 (Amber) 12.04 (Amber) 11.12 (Amber) 15.10 (Yellow) DG+20, AL+15
AL-0, DG-0
Misalignment of
the shaft (μm) 0.0076 (Amber) 0.0011 (Amber) 0.0070 (Amber) 0.0056 (Amber) DG+.1, AL+.05
AL-0, DG-0
Table 4(b). On-line results of undamaged and damaged bearing: April 2nd , 2006.
2 (DER)
Damaged bear-
ing
3 (DER)
Damaged bear-
ing
4 (DER)
Undamaged
bearing
5 (NDEA)
Undamaged
bearing
Alarm limit Diagnosis
Displacement of
shaft (μm) 50.9 (Yellow) 42.5 (Yellow) 41.9 (Yellow) 58.2 (Yellow) DG+60, AL+40
AL-0, DG-0
Deterioration behavior
of displacement of the
shaft defects on the
motor bearing and
pump bearing.
Gap (μm) 1211 (Amber) 1254 (Amber) 1255 (Amber) 1270 (Amber)
DG+0, AL+0
AL-1280,
DG-1180
There is no gap defect
Imbalance of
shaft (μm) 16.13 (Yellow) 14,04 (Amber) 16.16 (Yellow) 17.91 (Yellow) DG+20, AL+15
AL-0, DG-0
Imbalance of the shaft
defects on the motor
bearing and pump
bearing.
Misalignment of
the shaft (μm) 0.0885 (Yellow) 0.0918 (Yellow)0.0880 (Yellow)0.0911 (Yellow)DG+.1, AL+.05
AL-0, DG-0
Misalignment of the
shaft due to misalign-
ment of 40 deliberately
introduced
K. N. EDE ET AL.51
Table 4(c). On-line results of undamaged and damaged bearing: April 3rd, 2006.
2 (DER)
Damaged
bearing
3 (DER)
Damaged
bearing
4 (DER)
Undamaged bear-
ing
5 (NDEA)
Undamaged
bearing
Alarm limit Diagnosis
Displacement of
shaft (μm) 51.9 (Yellow) 45.5 (Yellow) 44.9 (Yellow) 60.9 (Red) DG+60, AL+40
AL-0, DG-0
Displacement of the
shaft defects on the
motor bearing and
pump bearing.
Gap (μm) 1235 (Amber) 1255 (Amber) 1259 (Amber) 1271 (Amber) DG+0, AL+0
AL-1280, DG-1180 There is no gap defect
Imbalance of
shaft (μm) 21.84 (Red) 18.01 (Red) 28.19 (Red) 25.11 (Red) DG+20, AL+15
AL-0, DG-0
Imbalance of the shaft
defects on the motor
bearing and pump
bearing.
Misalignment of
the shaft (μm)
0.0921 (Yel-
low)
0.0941 (Yel-
low) 0.0841 (Yellow) 0.0971 (Yellow)DG+.1, AL+.05
AL-0, DG-0
Misalignment of the
shaft due to misalign-
ment of 40 deliberately
introduced
Table 4(d). On-line results of undamaged and damaged bearing: April 4th, 2006.
2 (DER)
Damaged
bearing
3 (DER)
Damaged
bearing
4 (DER)
Undamaged
bearing
5 (NDEA)
Undamaged
bearing
Alarm limit Diagnosis
Displacement of
shaft (μm) 51.9 (Yellow) 45.7 (Yellow) 50.1 (Yellow) 61.9 (Red) DG+60, AL+40
AL-0, DG-0
Displacement of the
shaft defects on the
motor bearing and
pump bearing.
Gap (μm) 1273 (Amber) 1254 (Amber) 1265 (Amber) 1273 (Amber)
DG+0, AL+0
AL-1280,
DG-1180
There is no gap defect
Imbalance of shaft
(μm) 28.09 (Red) 25.19 (Red) 34.19 (Red) 34.17 (Red) DG+20, AL+15
AL-0, DG-0
Evolution of Imbalance
of the shaft defects on
the motor bearing and
pump bearing.
Misalignment of
the shaft (μm) 0.1032 (Red) 0.1117 (Red) 0.1011 (Red) 0.1322 (Red) DG+.1, AL+.05
AL-0, DG-0
Misalignment of the
shaft due to misalign-
ment of 40 deliberately
introduced
Table 4(e). On-line results of undamaged and damaged bearing: April 5th, 2006.
2 (DER)
Damaged bear-
ing
3 (DER)
Damaged bear-
ing
4 (DER)
Undamaged
bearing
5 (NDEA)
Undamaged
bearing
Alarm limit Diagnosis
Displacement of
shaft (μm) 52.5 (Yellow) 54.5 (Yellow) 54.0 (Yellow) 66.5 (Red) DG+60, AL+40
AL-0, DG-0
Displacement of the
shaft defects on the
motor bearing and
pump bearing.
Gap (μm) 1279 (Amber) 1264 (Amber) 1275 (Amber) 1277 (Amber)
DG+0, AL+0
AL-1280,
DG-1180
There is no gap defect
Imbalance of shaft
(μm) 28.94 (Red) 29.81 (Red) 35.34 (Red) 34.31 (Red) DG+20, AL+15
AL-0, DG-0
Evolution of Imbalance
of the shaft defects on
the motor bearing and
pump bearing.
Misalignment of
the shaft (μm) 0.1051 (Red) 0.1314 (Red) 0.1108 (Red) 0.1535 (Red) DG+.1, AL+.05
AL-0, DG-0
Misalignment of the
shaft due to misalign-
ment of 40 deliberately
introduced
Copyright © 2010 SciRes. ENGINEERING
K. N. EDE ET AL.
52
Table 4(f). On-line results of undamaged and damaged bearing: April 6th, 2006.
2 (DER)
Damaged bear-
ing
3 (DER)
Damaged bear-
ing
4 (DER)
Undamaged
bearing
5 (NDEA)
Undamaged
bearing
Alarm limit Diagnosis
Displacement of
shaft (μm) 52.3 (Yellow) 56.5 (Yellow) 54.0 (Yellow) 69.2 (Red) DG+60, AL+40
AL-0, DG-0
Displacement of the shaft
defects on the motor bear-
ing and pump bearing.
Gap (μm) 1279 (Amber) 1266 (Amber) 1275 (Amber) 1279 (Amber)
DG+0, AL+0
AL-1280,
DG-1180
There is no gap defect
Imbalance of
shaft (μm) 29.02 (Red) 32.11 (Red) 35.51 (Red) 34.52 (Red) DG+20, AL+15
AL-0, DG-0
Imbalances of the shaft
defect on the motor bear-
ing and pump bearing.
Imbalance increases with
temperature
Misalignment of
the shaft (μm) 0.1181 (Red) 0.1669 (Red) 0.1301 (Red) 0.1632 (Red) DG+.1, AL+.05
AL-0, DG-0
Misalignment of the shaft
due to misalignment of 40
deliberately introduced.
Proffer a remediation if a fault is detected and alert
user of the system
Start
Get vibration readings on-line from the ICSS
at various measurement points
Validate the reading of the equipment to ascertain the alarm level
or health status of the machine
Diagnose the fault (if any) and state the exact fault.
State the time and the equipment’s running-period in
hours: issue general report.
Yes
No Do you want to
exit program?
Stop
Figure 6. Process algorithm for fault diagnosis.
Figure 7(a). On-line displacement of shaft defect for the 5
(NDEA) pump bearing.
Figure 7(b). On-line gap defect for the 2 (DER) motor bearing.
Figure 7(c). On-line imbalance of shaft defect for the 5
(NDEA) undamaged pump bearing.
5. Conclusions
These series of tests were set up to observe shaft rota-
tions for speeds of 1015 revolutions per second, and
all key events were noted. Installed probes, on the driven
end of the damaged bearing of the motor that was used
for measuring the outer race deflections, also were used
to monitor the misalignment and imbalance of the shaft.
Defect locations in the raceway were determined from
the spike locations in the frequency domain.
69.2
66.5
61.9
60.6 60.9
56
58
60
62
64
66
68
70
02/04/06 03/04/06 04/04/06 05/04/06 06/04/06
Day
Amplitude (μm)
1300
1276 1279 1279
1280
1273
1260
1240
1220 1211
1200
Amplitude (μm)
1180
1160
05/04/06 02/04/06 03/04/0604/04/0606/04/06
Day
40
34.31 34.52
34.17
35
30
25.11
25
20
17.19
15
10
5
0
04/04/06 05/04/06 02/04/06 03/04/06 06/04/06
Day
Amplitude (μm)
C
opyright © 2010 SciRes. ENGINEERING
K. N. EDE ET AL.53
Figure 7(d). On-line misalignment of the shaft defect for the
3 (DEA) motor bearing.
Time-waveform analysis is an excellent analytical tool
for fault diagnosis and prognostics: it enhances FFT in-
formation for on-line monitoring.
6. Recommendations
Accurately diagnosing and locating faults in machinery
involving rotating components (e.g. pumps and turbines)
can be achieved effectively by on-line vibration moni-
toring. This practice will reduce the waste of energy,
effort expenditure, time consumption and drudgery ex-
perienced with off-line data-acquisition procedures and
will facilitate wiser, maintenance decision making.
7. Acknowledgements
The authors wish to thank Netco-Dietsmann Nigeria
Limited and Aminam/Kpono Field-Nigeria for logistics
support and the provision of vital information that led to
the successful execution of this work.
8
. References
[1] R. Wilfried, S. Ulrich, P. Oliver, S. Christian, and W. B.
Fiedrich, “Basics of vibration monitoring for fault detec-
tion and process control,” Non-Destructive Testing De-
partment, Institute of Materials Science, University of
Hanover, Garbsen, Germany, pp. 23–28, 2003.
0.25
0.1998 0.2011
0.1991
0.2
[2] J. S. Hansen, Harker, and G. Roger, “A new method for
rolling-element bearing monitoring in the petrochemical
industry,” Proceeding of the Vibration Institute Machin-
ery Vibration Monitoring and Analysis Meeting, New
Orleans, pp. 34–45, 1984.
0.1512
0.1481
0.15
0.1
0.05 [3] D. E. Bently, “Monitoring rolling-element bearings,”
Orbit Article, Bently Corporation, Nevada, pp. 12–23,
1982.
0
02/04/0603/04/06 04/04/06 05/04/06 06/04/06
Day
Amplitude (μm)
[4] D. B. Spencer and J. S. Hensen, “Better way to monitor
bearings,” Hydrocarbon Processing, pp. 2–7, 1985.
[5] E. A. Ogbonnaya, “Thermodynamics of steam and gas
turbines,” Oru’s Press Ltd, Port Harcourt, Nigeria, pp. 11,
2004.
[6] V. B. Alexej and N. A. Bakorva, “Diagnostics of gearing
and geared couplings using envelope spectrum methods,”
Vibro Acoustical Systems and Technologies (VAST),
Inc., Saint-Petersburg, Russia, 1994. Online Available:
http://www.vibrotek.com/bio/anb.htm.
[7] B. E. Parker Jr, H. V. Poor, E. C. Larson, T. A. Hamilton,
and J. P. Frankel, Noise Conference, Proceedings of the
Statistical Change Detection Using Non-Linear Models,
USA, pp. 319–324, 1997.
[8] S. David, “Predictive intelligent machining and machine-
monitoring sensors,” March Consulting Group (Manag-
ing Maintenance into the 1990’s), 1989. Online Available:
http://www.vibanalysis.co.uk/the author/about. html.
[9] 01db Steel Technologies, Metravib, 2001. Online Available:
http://www.01db-metravib.com (Assessed 26 December,
2005).
[10] A. V. Barkov and N. A. Barkova, “Automatic diagnostics
of rolling-element bearings using enveloping methods,”
Proceedings of the 18th Annual Meeting, The Vibration
Institute, USA, pp. 21–23, 1995.
[11] E. A. Ogbonnaya and K. E. Koumako, “Basic automatic
control,” King Tovic International, Port Harcourt, Nigeria,
pp. 109–116, 2006.
Copyright © 2010 SciRes. ENGINEERING
K. N. EDE ET AL.
54
Abbreviations, Nomenclature and Units
AC Alternating current (Amp)
AL+ High alarm (i.e. when measured value is greater than pre-alarm limit)
AL-
Low alarm (i.e. when measured value is less than pre-alarm limit)
Bd
Diameter of the ball bearing (m)
DE Driven end
DER
Driven-end radial
DG+
High danger (i.e. when measured value is greater than pre-alarm limit)
DG- Low danger (i.e. when measured value is less than pre-alarm limit)
F
Is the frequency in Hz
FDS
Fault-Diagnostic Software
FFT
Fast Fourier-transform
F0
Imbalance
g
Acceleration due to Gravity (ms-2)
Hz
Cycles per second
ICSS
Integrated control switching system
IRBP
Inner-race-ball passage frequency (s-1)
ic
Cage rotating-frequency of the bearing (s-1)
iR
Rolling element of the bearing (s-1)
NDEA Non drive-end axial (i.e. measurement location on the pump bearing in the same direction as the shaft centerline)
ORBP
Outer-race-ball passage frequency (s-1)
P
Is the period in seconds (the amount of time required to complete one cycle)
Pd
Pitch diameter of the bearing (m)
PLC
Programmable logic control
REBAM
Rolling element bearing activity monitor
RPS
Revolutions per second
SKF Svenska Kullagerfabriken; a Swedish bearing company
VDC Direct-current voltage (V)
S
Seconds
z
Number of rolling elements of the bearing. z is equal to 9 in the chosen test case
θ
Contact angle between the rolling element and rolling surface
(degrees)
ω Angular speed (Revolutions per second)
Copyright © 2010 SciRes. ENGINEERING