Journal of Modern Physics
Vol.2 No.12(2011), Article ID:16505,6 pages DOI:10.4236/jmp.2011.212187
Holographic Principle and Large Scale Structure in the Universe
84 Marin Avenue, Sausalito, California, USA
E-mail: tmongan@gmail.com
Received October 11, 2011; revised November 12, 2011; accepted November 26, 2011
Keywords: holographic principle, large scale structure, self-similarity
ABSTRACT
A reasonable representation of large scale structure, in a closed universe so large it’s nearly flat, can be developed by extending the holographic principle and assuming the bits of information describing the distribution of matter density in the universe remain in thermal equilibrium with the cosmic microwave background radiation. The analysis identifies three levels of self-similar large scale structure, corresponding to superclusters, galaxies, and star clusters, between today’s observable universe and stellar systems. The self-similarity arises because, according to the virial theorem, the average gravitational potential energy per unit volume in each structural level is the same and depends only on the gravitational constant. The analysis indicates stellar systems first formed at z ≈ 62, consistent with the findings of Naoz et al., and self-similar large scale structures began to appear at redshift z ≈ 4. It outlines general features of development of self-similar large scale structures at redshift z < 4. The analysis is consistent with observations for angular momentum of large scale structures as a function of mass, and average speed of substructures within large scale structures. The analysis also indicates relaxation times for star clusters are generally less than the age of the universe and relaxation times for more massive structures are greater than the age of the universe.
1. Introduction
Formation of large scale structure in the universe is an important problem in cosmology [1], and the heuristic Press-Schechter excursion set model has been considered the only viable analytic approach to formation of large scale structure [2]. In contrast, this analysis extends the holographic principle [3] to consider formation of large scale structures, and stellar systems comprising those structures, in a closed Friedmann universe so large it’s nearly flat. That may be a reasonable approximation to our universe.
In this analysis,  is the cosmic microwave background (CMB) radiation density at redshift
 , where
  and the mass equivalent of today’s radiation energy density
  g/cm3 [4]. Correspondingly,
  is the matter density within structural level
  at redshift
  and
and  is today’s matter density in the universe as a whole. If the Hubble constant
  km/sec Mpc, the critical density
 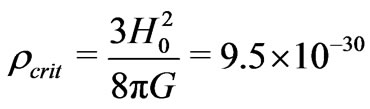 g/cm3 where G = 6.67
× 10−8 cm3·g−1·sec−2, and c = 3.00 × 1010 cm·sec−1. Assuming the universe is dominated by vacuum energy resulting from a cosmological constant , matter accounts for about 26% [5] of the energy in today’s universe. So,
 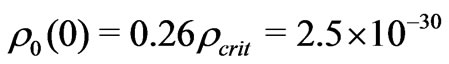 g/cm3 and the vacuum energy density
 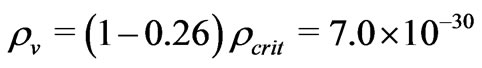 g/cm3.
The cosmological constant 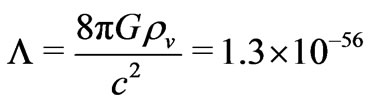 cm2
cm2
and there is an event horizon in the universe at radius
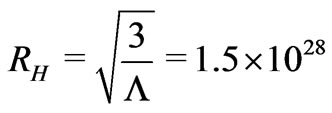 cm. Therefore, the mass
  of the observable universe is about
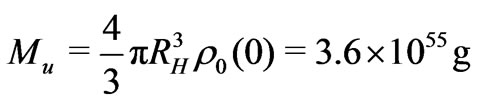 .
.
According to the holographic principle [3], the number of bits of information available on the light sheets of any surface with area  is
is , where
 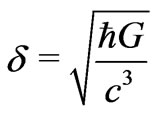 is the Planck length and
  is Planck’s constant. So, only
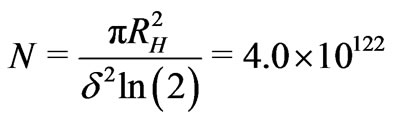 bits of information on the event horizon will ever be available to describe all physics within the event horizon in our universe, The average mass per bit of information in the universe is
 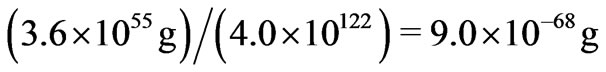 and the holographic principle indicates the total mass of the universe relates to the square of the event horizon radius by
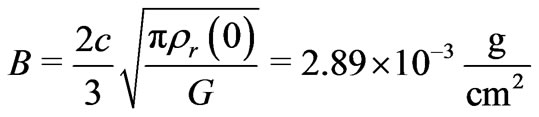
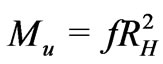 , where
  g/cm2.
In a closed universe, there is no source or sink for information outside the universe, so the total amount of information in the universe remains constant. Also, after the first few seconds of the life of the universe, energy exchange between matter and radiation is negligible compared to the total energy of matter and radiation separately [6]. So, in a closed universe, the total mass of the universe is conserved and the average mass per bit of information is constant. This suggests an extension of the holographic principle indicating the information describing the physics of an isolated gravitationally-bound astronomical system of total mass  is encoded on a spherical holographic screen with radius
  cm around the center of mass of the system.
2. Assumptions
In a closed universe, a hierarchical self-similar description of the development of large scale structure in the universe can be obtained based on four assumptions:
1) Extend the holographic principle by assuming all information necessary to describe an isolated astronomical structure of mass  is available on the light sheets of a holographic spherical screen with radius
 cm around the center of mass of the structure, so the average matter density within the spherical screen is
  g/cm3.
2) Assume the bits of information on the holographic spherical screens surrounding isolated astronomical structures are in thermal equilibrium with the CMB radiation.
3) Assume structures at any given self-similar structural level range in mass from the Jeans’ mass at that level down to the Jeans’ mass for the next finer level of structure.
4) Assume the number of structures of mass  in any structural level
  is
is , where
  is constant, so the amount of information in any mass bin (proportional to
 ) is the same in all mass bins. This is consistent with the
  behavior of the mass spectrum in the PressSchechter formalism.
3. Analyses
Based on these assumptions, the following analysis identifies three levels of self-similar large scale structure (corresponding to superclusters, galaxies, and star clusters) between today’s observable universe and stellar systems. Those self-similar large scale structures can be seen as gravitationally-bound systems of  widely separated units of the next lower structural level in a sea of cosmic microwave background photons. In this approach, today’s speed of pressure waves affecting matter density at structural level
  is
is
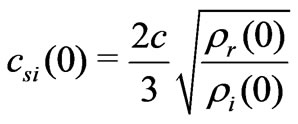 [7], and the corresponding Jeans’
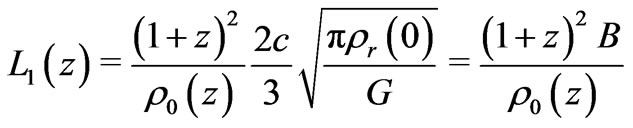
length 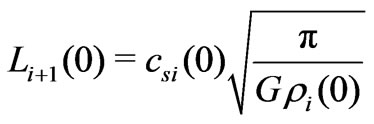 [7]. In today’s universe,
 cm/sec, and the first level (supercluster) Jeans’ length
  cm. The first level Jeans’
mass, the mass of matter within a radius one quarter of the Jeans’ wavelength , is
, is
 g. All scales smaller than the Jeans’ wavelength are stable against gravitational collapse, and the radius of the spherical holographic screen for the first level Jeans’ mass is
  cm. The matter density within the spherical holographic screen for the first level Jeans’ mass is
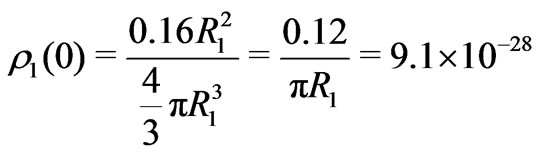 g/cm3. Then,
 cm/sec within the first level Jeans’ mass, the second level (galaxy) Jeans’ length is
 cm, and the second level Jeans’ mass is
 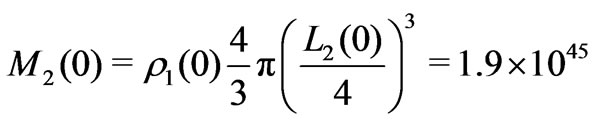 g. Continuing in this way, the third level (star cluster) Jeans’ mass
 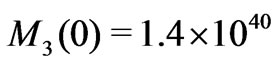 g, the fourth level (stellar system) Jeans’ mass
 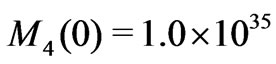 g, and
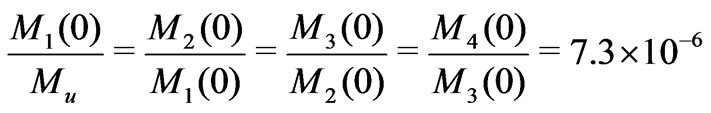 . The hierarchy of large scale structure stops with star clusters, because stellar systems cannot be treated as systems consisting of
  widely separated subelements in a sea of cosmic microwave background photons.
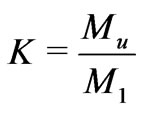
Identify superclusters as structures with masses between the first and second level Jeans’ masses, galaxies as structures with masses between the second and third level Jeans’ masses, and star clusters as structures with mass between the third and fourth level Jeans’ masses. Then, the universe can be seen successively as an aggregate of superclusters, an aggregate of galaxies, an aggregate of star clusters, or an aggregate of stellar systems. The Jeans’ masses identify each structural level, but a mass distribution is needed to estimate the number of entities in each structural level and the average mass of structures at that level. Using the assumed  behavior of the mass spectrum, the number of superclusters in the universe is
 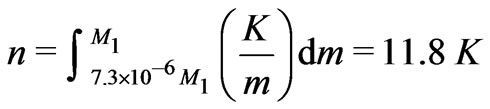 and the mass of the universe relates to the aggregate of supercluster masses by
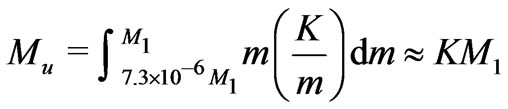 . So,
. So,
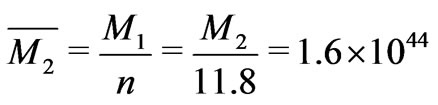
 , the average mass of a supercluster
 g and the mass of the universe is the number of superclusters times the average supercluster mass. There are
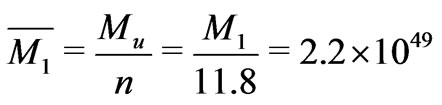
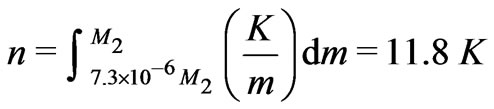 galaxies in a first level Jeans’ mass, and the first level Jeans’ mass is the aggregate of the galaxy masses within that Jeans’ massso
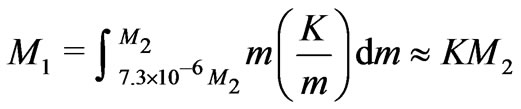 . Then,
 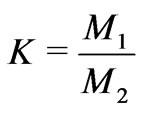 and the average galaxy mass
 g. A similar analysis gives an average star cluster mass of
  g, and these results are consistent with observations [8-10].
Down to the third (star cluster) structural level, the total number  of next lower level substructures inside the holographic screens for the Jeans’ length at each structural level are the same as the total number of superclusters in the observable universe. Furthermore, considering the large scale structures within the universe, there are
  average mass galaxies in an average mass supercluster,
  average mass star clusters in an average mass galaxy and (if the average stellar system mass is 4.3 times the solar mass)
  average mass stellar systems in an average mass star cluster.
To understand the self-similarity (scale invariance) of large scale structures within the universe, consider gravitationally-bound systems of  entities with mass
  and total mass
 . For structures with
  , the substructure mass
  is much less than the mass
  of the next highest level of structure. From the virial theorem, the gravitational potential energy of the systems is
 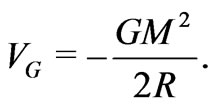 The extended holographic principle indicates the information needed to describe gravitationally-bound astronomical systems of total mass
  consisting of empty radiation-filled space and
  smaller entities with mass
  is available on a spherical holographic screen of radius
surrounding the system. Then, the gravitational potential energy of the structure of mass  within the holographic screen is
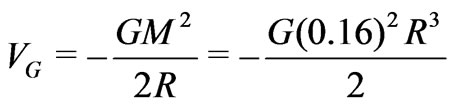 , so selfsimilarity (scale invariance) of large scale structures occurs because the average gravitational potential energy per unit volume at each structural level depends only on the gravitational constant and is identical for all levels of large scale structure.
Now consider development of large scale structure at  Stellar systems are the basic elements of selfsimilar large scale structures (star clusters, galaxies, superclusters, and the universe as a whole), and formation of the first stellar systems depended on thermonuclear reactions between (strongly interacting) protons in the baryon fraction of the matter density in the universe. This suggests the mass of the smallest gravitationally bound systems that become stellar systems at redshift
  can be estimated by setting the escape velocity of protons on the holographic screen for the minimum mass stellar system, with radius
 , equal to the average velocity of protons in equilibrium with CMB radiation outside the screen. For
 , the escape velocity (escaping proton temperature) on the holographic screen is such that escaping protons are at higher temperature than the CMB and can transfer heat (and energy) to the CMB. Correspondingly, for
  the escape velocity (escaping proton temperature) on the holographic screen is such that escaping protons are at lower temperature than the CMB and cannot transfer heat (and energy) to the CMB. Any protons outside the holographic screen for the minimum mass stellar system that are in equilibrium with the CMB (such as those escaping from structures larger than minimum size) can transfer heat (and energy) to structures less than minimum size until they grow to minimum size.
The escape velocity for a proton of mass  gravitationally bound at radius
  from the centroid of a structure with mass
  is calculated from
 . If the escape velocity of a proton on the holographic screen for the minimum mass stellar system at redshift
  is the velocity of a proton in thermal equilibrium with the CMB,
  , where the CMB temperature
  and the Boltzmann constant
  (g cm2/sec2)/
 . Since the radius
  of the holographic screen for a structure of a mass
  is
is , the minimum mass of a stellar system at redshift
  is
is
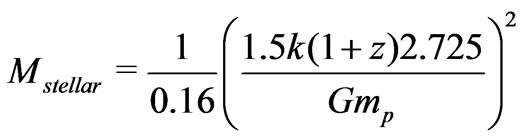 . If outgoing protons near the holographic screen are in thermal equilibrium with the CMB and the outgoing photon flow from the minimum mass star, the outgoing photon flow from stellar systems with mass less than the minimum stellar system mass is at lower temperature than the CMB and cannot transfer energy to the CMB or appear as a star against the CMB background. Note that radii of holographic screens for stellar systems are considerably larger than radii of stars themselves. For example, the radius of the holographic screen for our sun is comparable to the radius of the entire solar system including the Oort cloud.
If the number of structures  in a mass bin
  is
is
 , the smallest scale structures are most numerous. The mass of the largest known star is about
  g [11]. This holographic analysis suggests stellar systems with mass
  g would be the minimum mass stellar structures and the most numerous luminous structures in the universe at
 , consistent with indications that the first stars formed at
  [12]. Today, at
 , this analysis indicates the smallest stellar systems have 0.08 times the solar mass, consistent with the mass of the smallest stars [13]. The fact that the mass of the smallest stars can be estimated from the extended holographic principle using only the Boltzmann constant, CMB temperature, gravitational constant and proton mass suggests a relation between organization of information and gravity, electromagnetism and strong interactions underlying that embodied in specifice equations modeling details of thermonuclear reactions and stellar dynamics.
When matter dominates, the speed of pressure waves affecting matter density at redshift z within structural level  is
is 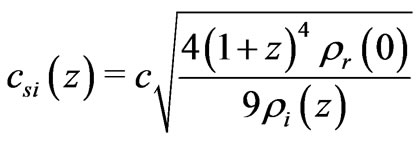 [7], and the Jeans’ length at that level
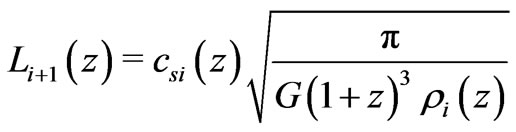 [7]. The first level of large scale structure within the universe is determined by the Jeans’ mass
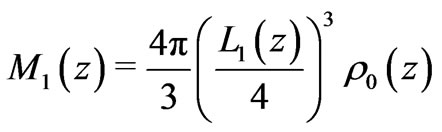 , where
 , and
, and
 , so the resulting Jeans’ mass
 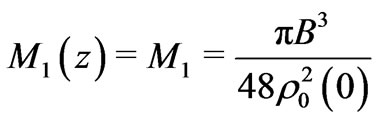 is independent of
 [7].
[7].
Evolution of large scale structure is characterized by , the number of structural levels between the Jeans’ mass
  and stellar systems, and
 , the average number of next lower level structures within a structure at any given level, as structures in the
  levels coalesce into the three levels present today. The Jeans’ mass
  of structures in level
  is determined by the Jean’s length
  in the next highest structural level and the holographic density
  inside the holographic screen for the Jeans’ mass
  of the next highest structural level. So, the ratio of the Jeans’ mass
  to the Jeans’ mass
  in the next subordinate level is
 . The holographic density
 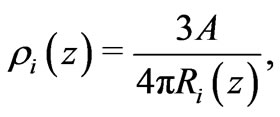 where
where  and the radius of the holographic screen for the Jeans’ mass
  is
is 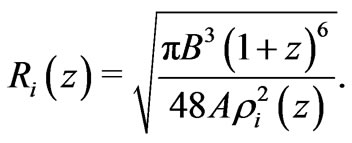 So,
So,
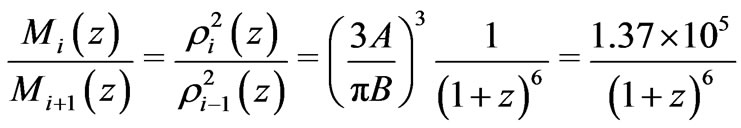 .
.
The average mass 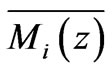 of structures in level
  is the total mass of the next lowest level of structures within level
  divided by the total number of next lowest level of structures within level
 . So,
. So,
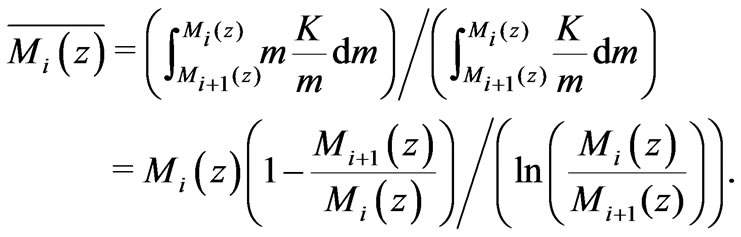
Then, the number  of average mass structures of next lower level within the average mass at any structural level is
The growth of  tracks development of selfsimilar large scale structure. Self-similar large scale structures began to emerge when
  at
at , with 16 structural levels exceeding the minimum stellar system mass of 2
 . As time went on,
  at
at  with eight structural levels exceeding the minimum stellar system mass of 0.9
 ,
,  at
at  with five structural levels exceeding the minimum stellar system mass of 0.4
 , and
, and  at
at  with four structural levels exceeding the minimum stellar system mass of 0.2
 .
.
This analysis allows quick simulation of the formation of self-similar large scale structures, since the number  of self-similar structural levels exceeding the minimum stellar system mass
  is the integer truncation of
 , and the number of average mass structures of next lower level within the average mass at any structural level, is
 .
.
Some other comparisons with observations are worth noting. First, combining the virial theorem with the holographic relation  the average root mean square velocity of subelements in a self-similar large scale structure of mass
  within the universe is
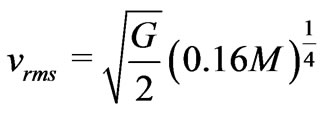 . For an average supercluster mass of
  g, the r.m.s galaxy velocity is
  cm/sec. This compares favorably with the estimated
  cm/sec closing velocity of the colliding “bullet cluster” galaxies 1E0657-56 [14]. Second, the extended holographic principle can be used to derive a relation between angular momentum of large scale structures and their mass, similar to that found by Wesson [15]. The angular momentum
 , where the moment of inertia
  of a spherical system of mass
  is
is
 , and
, and  is the angular velocity of the system.
Using the holographic relation  yields
 . The angular velocity can be determined by considering a mass
  fixed on the surface of the rotating structure just inside the holographic screen for the structure, with radius
 . The radial acceleration of that particle
 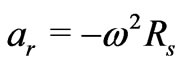 results from the gravitational force
 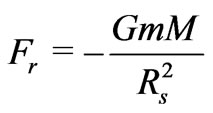 attracting the particle to the centroid of the structure, so
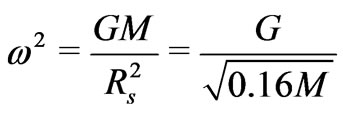 . The result is
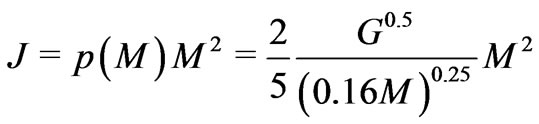 . Then,
 for an average galactic mass of
  g, about twice Wesson’s empirical value
  [15].
[15].
Finally, Forbes and Kroupa [16] suggest galaxies and star clusters can be distinguished by their relaxation times, with galaxies having relaxation times greater than the age of the universe and star clusters having relaxation times less than the age of the universe. Based on standard texts (Shu [17] and Binney & Tremaine [18]), Bhattacharya [19] considers a system of mass  and radius
  composed of
  stars with average mass
and number density . He then approximates the two body relaxation time for the system as
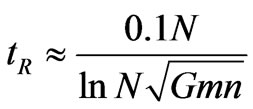 . Using the holographic relation
 between the mass and the radius of a systemits relaxation time is
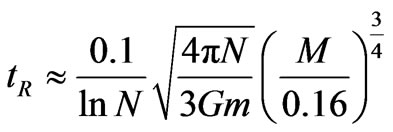 . This extended holographic analysis indicates the average star cluster today has mass
  g. If the (imprecisely known) mass of the average star is the solar mass
  g, the relaxation time for an average mass star cluster is
  sec. If the age of the universe is
  yr
yr  sec and the average stellar mass is about twice the solar mass, the relaxation time of the average mass star cluster equals the age of the universe. This indicates star clusters have relaxation times of the order of the age of the universe or less, and larger mass structures have longer relaxation times. So, a direct consequence of the extended holographic principle and the fact that the average stellar mass is near the solar mass is that relaxation times for galaxies are greater than the age of the universe, consistent with Forbes and Kroupa [16].
4. Conclusions
The above analyses, based on four simple assumptions, produce numerical results in general agreement with astrophysical observations of large scale structures in our universe. It is unlikely that all of these results are mere coincidence, so the four assumptions probably provide a reasonable basis for studying development of large scale astrophysical structures if our universe turns out to be closed.
REFERENCES
- V. Bromm, et al., “Formation of the First Stars and Galaxies,” Nature, Vol. 459, 2009, pp. 49-54.
- S. Battacharya, et al., “Mass Function Predictions Beyond LCDM,” Bulletin of the American Astronomical Society, Vol. 43, 2011.
- R. Bousso, “The Holographic Principle,” Reviews of Modern Physics, Vol. 74, 2002, pp. 825-874.
- A. Siemiginowska, et al., “The 300 kpc Long X-Ray Jet in PKS 1127-145, z = 1.18 Quasar: Constraining X-Ray Emission Models,” The Astrophysical Journal, Vol. 657, 2007, p. 145. doi:10.1086/510898
- W. Percival, et al., “Measuring the Matter Density Using Baryon Oscillations in the SDSS,” The Astrophysical Journal, Vol. 657, No. 1, 2007, p. 51. doi:10.1086/510772
- C. Misner, K. Thorne and J. Wheeler, “Gravitation,” W. H. Freeman and Company, New York, 1973.
- S. Longair, “Galaxy Formation,” Springer-Verlag, Berlin, 1998.
- L. Lubin, et al., “A Definitive Optical Detection of a Supercluster at z ≈ 0.91,” The Astrophysical Journal, Vol. 531, No. 1, 2000, p. L5. doi:10.1086/312518
- J. de Carvalho and P. Macedo, “The Structure Formation in a Quasi-Static Approximation,” Dark and Visible Matter in Galaxies. ASP Conference Series, Vol. 117, 1997, p. 310.
- O. Gnedin and J. Ostriker, “Destruction of the Galactic Globular Cluster System,” The Astrophysical Journal, Vol. 474, No. 1, 1997, p. 223. doi:10.1086/303441
- P. Crowther, “The R136 Star Cluster Hosts Several Stars Whose Individual Masses Greatly Exceed the Accepted 150 Msun Stellar Mass Limit,” Monthly Notices of the Royal Astronomical Society, Vol. 408, No. 2, pp. 731- 751.
- S. Naoz, et al., “The First Stars in the Universe,” MNRAS Letter, Vol. 373, No. L98, 2006.
- P. Massey and R. Meyer, “Stellar Masses,” pg. 1, Encyclopedia of Astronomy and Astrophysics, 2001.
- M. Markevitch, et al., “Direct Constraints on the Dark Matter Self-Interaction Cross-Section from the Merging Galaxy Cluster 1E0657-56,” The Astrophysical Journal, Vol. 606, No. 2, 2004, p. 819. doi:10.1086/383178
- P. Wesson, “Clue to the Unification of Gravitation and Particle Physics,” Physical Review D, Vol. 23, No. 8, 1981, pp. 1730-1734. doi:10.1103/PhysRevD.23.1730
- D. Forbes and P. Kroupa, “What Is a Galaxy? Cast Your Vote Here...,” Publications of the Astronomical Society of Australia, Vol. 28, No. 1, pp. 77-82.
- F. Shu, “The Physical Universe—An Introduction to Astronomy,” University Science Books, Herndon, 1982.
- J. Binney and S. Tremaine, “Galactic Dynamics,” Princeton University Press, Princeton, 1987.
- D. Bhattacharya, “Stellar Systems: Two-Body Relaxation,” PH217: Aug-Dec 2003. http://meghnad.iucaa.ernet.in/dipankar/ph217/relax.pdf