Advances in Bioscience and Biotechnology
Vol.4 No.3A(2013), Article ID:29309,11 pages DOI:10.4236/abb.2013.43A065
Teraherz vibrational spectroscopy of E. coli and molecular constituents: Computational modeling and experiment
![]()
1Department of Electrical and Computer Engineering, University of Virginia, Charlottesville, USA
2Vibratess, LLC, Charlottesville, USA
Email: tg9a@virginia.edu, is4ea@virginia.edu, gb7k@virginia.edu
Received 6 January 2013; revised 14 February 2013; accepted 26 February 2013
Keywords: Bacterial; Strains; MD; Modeling; Experiment; Components; Absorption; Signatures
ABSTRACT
In this paper we present the results of our research of E. coli cells and cellular components, DNA and protein thioredoxin, using highly resolved sub-Terahertz (THz) vibrational spectroscopy. In this combined research, the results from experimental spectroscopy are analyzed via molecular dynamics (MD) simulation of vibrational modes and absorption spectra from E. coli cells and constituents in the sub-THz range. Simplified models of DNA macromolecules with a short sequencing have been constructed for several E. coli strains with the goal to predict their absorption spectra. The similarity between spectral characteristics of E. coli cells and cellular components observed in experiments helps us to better understand the mechanism of material interaction with THz radiation and to add genetic information to the characteristic signatures from biological objects. Modeling results supported by experimental characterization using a spectroscopic sensor prototype developed and built by Vibratess confirm that an optical, label and reagent free technique can be used to examine, detect, and identify bacterial cells with high accuracy and selectivity to the level of strains.
1. INTRODUCTION
In this work, sub-Terahertz (THz) vibrational spectroscopy is explored to characterize Escherichia coli (E. coli) bacterial cells and its cellular components. E. coli is a diverse bacterial organism that is widely used as a model organism in laboratory studies. However, these bacterial species have strains that can be pathogenic to humans and animals. There are tens of thousands E. coli contamination cases every year in United States. Bacteria can adapt to extreme environments and bacterial pathogens share a common trait that is their ability to live longterm inside the host’s cells [1].
Traditionally, to indentify pathogens from different samples one has to collect and isolate species by using culture methods. The identification process is often relied on microscopic examination to determine phenotypic characteristics of bacterial colony. The final identification of microbial species is assisted by molecular biology and biochemistry methods. Cultivation process alone might last more than one week. Therefore, there is an increasing need for alternative methods that makes the identification of microorganisms fast and reliable. Accurate identification of infectious agents (such as pathogenic bacteria) can be critical for the diagnosis and effective treatment of diseases. The monitoring and the detection of pathogens in food are also important for protecting human health.
Terahertz (THz) vibrational spectroscopy is relatively new experimental method that can be more effective than standard methods especially when the quantity of sample material is limited. Emerging highly resolved THz vibrational spectroscopy is an optical, label and reagent free technique that can be used to examine, detect, and identify bacterial cells to the level of strains. This new technology with high spectral and spatial resolution has been recently demonstrated using a spectroscopic sensor prototype developed and built by Vibratess, LLC [2].
Sub-Terahertz (sub-THz) vibrational spectroscopy for bio-sensing is based on specificity of resonance features, fingerprints, observed in absorption (transmission) spectra of large biological molecules and entire bacterial cells/spores. In our experiments we showed that cellular components contribute to spectroscopic signature of the entire microorganism. As a result, THz vibrational spectroscopy promises to add quantitative genetic information to the characteristic signatures of biological objects, thus increasing the detection accuracy and selectivity.
In addition, it has been shown in our previous work [3, 4] that transmission signatures from sample material in water are well-resolved. As a result, THz spectroscopy takes benefit from working with samples in the natural environment for biological objects with the minimal sample preparation process.
Molecular dynamic (MD) simulations of proteins and nucleic acids, which make the bigest contribution to THz absorption in bacterial cell, can help better understand the mechanism of interaction between radiation and biological cells and their constituants, to further improve indentification of objects and even to predict their signatures.
We have recently simulated spectra of relatively small biological molecules like tyrosine transfer RNA [5] or protein thioredoxin from E. coli [6] using MD simulations. Our approach is based on comparison between measured and simulated spectra using MD of cellular components. We demonstrated a rather good correlation of simulated absorption spectra with experimental data [4]. However a large size of macromolecules (~5 million base pairs for E. coli DNA) prevents direct application of MD simulation at the current level of computational capabilities. Thus, one purpose of this work is to develop a simplified short model of the bacterial genome so that the model would capture the structure and the most important low-frequency vibrational characteristics of the native DNA. MD simulations of the modeled sequences permit us to calculate expected absorption spectra. Another purpose of statistical modeling of short DNA sequences is to compare thier composition and THz spectra obtained for different strains of E. coli. The comparison gives us the possibility to estimate uniqeness of THz DNA signatures of individual pathogenic and non-pathogenic strains.
In addition, we analyzed the results from MD simulations of our new developed models of DNA sequences from E. coli [7]. We demonstrated that the application of molecular dynamics simulations to the 60 base pair DNA models and to relatively small molecules like a protein thioredoxin from E. coli permits us to study directly atomic displacements in molecular dynamics and relaxation processes of intermolecular motions.
2. TERAHERTZ VIBRATUONAL SPECTROSCOPY OF BIOLOGICAL CELLS AND CELLULAR COMPONENTS
Sub-Terahertz (sub-THz) vibrational spectroscopy for biosensing is based on specific resonance features, vibrational modes or group of modes at close frequencies, in absorption (transmission) spectra of large biological molecules and entire bacterial cells/spores. Significant progress in experimental and computational sub-THz vibrational spectroscopy has been made in the last 2 - 3 years to improve the sensitivity of THz spectroscopic characterization of large biological molecules and microorganisms [4]. Sub-THz spectroscopy was applied to characterize lyophilized and in vitro cultured bacterial cells of non-pathogenic species of E. coli and Bacillus subtilis (BG), spores of BG. Some of cellular components of E. coli, DNA [4,8], transfer RNA [5], and protein thioredoxin [6,9] were characterized as well.
The spectral range below 1 THz is the most attractive for practical applications because of low disturbance from the absorption by water vapors in air and by liquid water or other analytes [3,4]. Although liquid water absorbs and contributes to background in the sub-THz/THz spectral range, the level of water absorption in the low THz range is at least 2.5 orders of magnitude less compared to IR and far-IR. Because of less disturbance from water absorption lines, sensors in sub-THz range do not require evacuation or purging with dry nitrogen. Many synthetic materials are transparent in THz region and can be used as substrates or windows for sample cells.
Till recently, Fourier transform (FT) transmission spectroscopy (Bruker IFS66v) with cooled Si bolometer operating at 1.7 K provided the most detailed information on sub-THz vibrational spectral signatures of biological molecules and microorganisms. Spectral resolution in these studies was 0.25 cm-1 [3,4,10]. It was demonstrated that Fourier Transform (FT) spectroscopy in the frequency region of 10 - 25 cm-1 is sensitive enough to reveal characteristic spectral features from bio-cells and spores in different environment, to verify the differences between species, and to show the response of spores to vacuum and response of cultured cells to heat [4]. Simultaneously with experimental characterization, computational modeling techniques have been developed using the energy minimization, normal mode analysis and MD approaches to understand and predict low frequency vibrational absorption spectra of short artificial DNA and RNA [11-15] large macromolecules of DNA [5, 8] and proteins [6,9]. Direct comparison of experimental spectra with theoretical prediction for a short chain α-helix RNA fragment with known structure [11], transfer RNA [5] and protein thioredoxin [6] from E. coli showed reasonably good correlation thus validating both, experimental and theoretical results. Vibrational frequencies from simulated spectra for components correlate rather well with the observed features. Thus, multiple resonances due to low frequency vibrational modes within biological macromolecules, components of bacterial organisms, are unambiguously demonstrated experimentally in the sub-THz frequency range in agreement with the theoretical prediction. These results are also in general agreement with analysis of more broad vibrational features observed at higher frequencies using different experimental technologies, mostly on relatively smaller molecules in crystalline form. Organic solid systems and relatively small bio-molecules like protein fragments have been successfully characterized in this range to demonstrate sharp spectral features determined by their individual symmetries and structures [16-19].
Bacteria are very complex biological objects. Because of their small size and relatively low absorption coefficient, the THz radiation propagates through an entire object, allowing the genetic material and proteins all contribute to the THz signature of bacteria or spores. The results of our work confirmed that observed spectroscopic features are caused by fundamental physical mechanism of interaction between THz radiation and biological macro-molecules [4]. Particularly, the analysis of results indicates that the spectroscopic signatures of microorganisms originate from the combination of low frequency vibrational modes or group of modes at close frequencies (vibrational bands) within molecular components of bacterial cells/spores, with the significant contribution from DNA [4]. The obtained results suggest that THz vibrational spectroscopy promises to add quantitative genetic information to the characteristic signatures of biological objects, increasing characterization accuracy and selectivity when appropriate spectral resolution, which is adequate to the widths of spectral lines, is used. The significance of this study is justified by necessity for a fast and effective, label free and reagent free optical technology to protect against environmental biological threats, as well as for general medical research. The ability to discriminate between the different bacterial species quickly and reliably using sub-THz spectroscopy would provide significant benefits. In the medical field it would enable a faster and more tailored treatment once a bacterial organism is identified as the cause of an infection. At the same time, although significant progress in experimental THz spectroscopy was demonstrated and reliable information was received for transmission/absorption spectra from different species, the spectral resolution of Bruker spectrometer (0.25 cm–1) still does not provide a sufficient level of discriminative capability. The shape of the curve and the absorption peak intensities were rather close for different species. It became clear that further improvement of sensitivity and especially of discriminative capability using sub-THz vibrational spectroscopy as an effective method for characterization of bacterial organisms requires even better spectral resolution.
The width of individual spectral lines and the intensity of resonance features observed in sub-THz spectroscopy are sensitive to the relaxation processes of atomic dynamics (displacements) within a macromolecule. It is clear that the decay (relaxation) time, τ, is the factor limiting the spectral width and the intensity of vibrational modes, the required spectral resolution, and eventually the discriminative capability of sub-THz spectroscopy. At the same time, the entire mechanism that determines intra-molecular relaxation dynamics is still not completely understood. The suggested range of molecular dynamics relaxation times for processes without biomolecular conformational change varies from approximately 1.5 ps to 650 ps in different studies [see, for example 20, 21]. The corresponding values for the dissipation factor, γ, and the width of spectral lines, which are reciprocal to τ, are between 0.05 and 20 cm-1. Values of γ above 1 cm-1 would result in structure-less sub-THz spectra, since vibrational resonances could not be resolved in this case because of the large density of low intensity vibrational modes. The existence of long-lasting dynamic processes responsible for narrow spectral lines has been confirmed by relaxation dynamics of side chains in macromolecules observed by time-resolved fluorescence experiments [22].
To increase the sensitivity, reliability, spectral and spatial resolution of sub-THz vibrational spectroscopy techniques, Vibratess, LLC, has developed a spectroscopic sensor prototype with imaging capability operating at room temperature, without the need for cryogenic cooling of the detector [2]. This novel CW, frequency-domain instrument is based on a very strong local enhancement of the electro-magnetic field, thus allowing increased coupling of the THz radiation with the sample biomaterials [23,24]. This enhancement was achieved through the use of the discontinuity edge effect and the extraordinary transmission of a sub-wavelength-slit conductive structure [25-28]. Observed multiple intense and specific resonances in transmission/absorption spectra from nano-gram samples with spectral line widths as small as 0.1 cm-1 provide conditions for reliable discriminative capability, potentially to the level of the strains of the same bacteria, and for monitoring interactions between biomaterials and reagents in near real-time. Only ~20 ng of biomaterial is required as the sample in our system as compared to the mg sample size required in the previous work done on the Bruker spectrometer (see above). With the complete development of a sealed micro/nanofluidic chip sample holder, liquid samples will be utilized, and the amount of biomaterial required for characterization will be further reduced ~10 to 100 times, thus opening the way for single bio-molecule characterization.
The developed prototype provides spectral resolution better than 0.035 cm-1, and significantly improved the detection sensitivity and reliability in the sub-THz operation range as compared to a commercially available spectrometer with a liquid helium cooled detector. Spatial resolution of the instrument is currently restricted by the opening size of the microdetector waveguide. Highly resolved transmission (absorption) spectra from only 10 - 20 ng of biological macromolecules and bacterial cells/ spores were demonstrated.
The experimental results measured with high spectral resolution reveal very intense and narrow spectral features from biological molecules and bacteria with widths ~0.1 - 0.2 cm-1. This corresponds to much longer scattering time values as compared to those previously evaluated using a spectrometer with a resolution of 0.25 cm–1. The narrow width of the spectral features (or small dissipation factor) in the transmission (absorption) spectra in the THz region makes these lines detectable [29]. Thus, a new sub-THz vibrational spectroscopy technology with high spectral and spatial resolution was developed and experimentally demonstrated in general agreement with modeling results.
3. MOLECULAR DYNAMICS SIMULATIONS OF SUB-THz VIBRATIONAL MODES AND ABSORPTION SPECTRA OF DNAs AND PROTEINS
3.1. Molecular Dynamics
We were working on MD simulations of sub-THz molecular vibrations and absorption spectra of proteins and DNAs with two goals: 1) to establish theoretical basis for exploring THz region of electro-magnetic (EM) spectrum for the discovery of new spectral signatures from biological materials; and 2) to improve predictive capabilities of MD computational modeling of THz vibrational absorption spectra from biological molecules. The protein thioredoxin from E. coli with known structure is used as a model molecule [pdb ID: 2TRX] to simulate sub-THz vibrational absorption using the software packages Amber 8 [30] and Amber 10 [31]. This small protein contains 108 amino acids, for a total of 1654 atoms. To solvate a sample, an additional 10,500 water atoms are added. Some absorption features predicted by our earlier MD simulations agreed reasonably well with experimental data [9,10,15]. However, the calculated spectra were highly sensitive to the parameter values, and reproducibility was poor. This problem of poor simulation convergence was discussed in work of many authors [32]. Amber was empirically parameterized to correctly represent the structural behavior of nucleic acid and protein as would be needed for predicting non-bond-breaking conformational changes [33]. It was not specifically created to simulate low frequency vibrational modes and THz absorption.
In our recent study [6], MD simulations of sub-terahertz (THz) vibrational modes of the protein thioredoxin was conducted with the goals of finding the conditions needed for simulation convergence, improving the correlation between experimental and simulated spectra, and ultimately enhancing the predictive capabilities of computational modeling. We studied the consistency, accuracy and convergence of MD simulations of the sub-THz vibrational modes by comparing simulations with different initial conditions, protocols and parameters to the experimental results.
Better simulation convergence and improved consistency between simulated vibrational frequencies and experimental data were obtained by using a new procedure for averaging mass-weighted covariance matrices of atomic trajectories in MD simulations. In particular, the open source package ptraj was edited to improve a matrix analyzing function. Averaging of only six matrices gives much more consistent results, with absorption peak intensities exceeding those from the individual spectra and with a rather good correlation between simulated vibrational frequencies and experimental data. We also found that the choice of the production run length considerably influences the obtained absorption spectra. The optimal time for dividing production run into equal subintervals to calculate individual correlation matrices is equal to ~100 ps. This result is in general agreement with relaxation dynamics time scales of the thioredoxin active center, coupled protein-water fluctuations [20,22], and our experimental data on the spectral width of vibrational modes [34,35].
3.2. Absorption Coefficient Spectra
Atomic trajectories collected in MD simulations are converted to the covariance matrix of atomic displacements  using a quasi-harmonic approximation. The force-field matrix is found utilizing the relation between the covariance matrix and the inverse of the forceconstant matrix
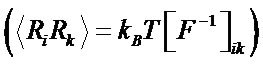 , where R—displacements, F—force constants [36,37]. Diagonalization of F matrix gives eigenfrequencies (normal mode frequencies) and eigenvectors (displacement vectors-normal modes). The absorption coefficient spectra
  as functions of the frequency n are calculated through the relationship between a and the imaginary part of dielectric permittivity [12]:
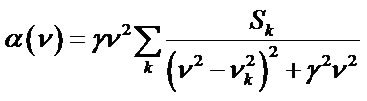 , (1)
, (1)
where nk are normal mode frequencies calculated by diagonalization of the force-constant matrix, and Sk are oscillator strengths computed for all vibrational modes k. Two values of oscillator dissipation for all vibrational modes in sub-THz range were accepted from our experimental works as  (moderate spectral resolution in Bruker spectrometer), and
  for a highly resolved spectroscopy using Vibratess spectrometer. Figure 1 demonstrates correlation between absorption spectrum of thioredoxin simulated with γ = 0.5 cm-1
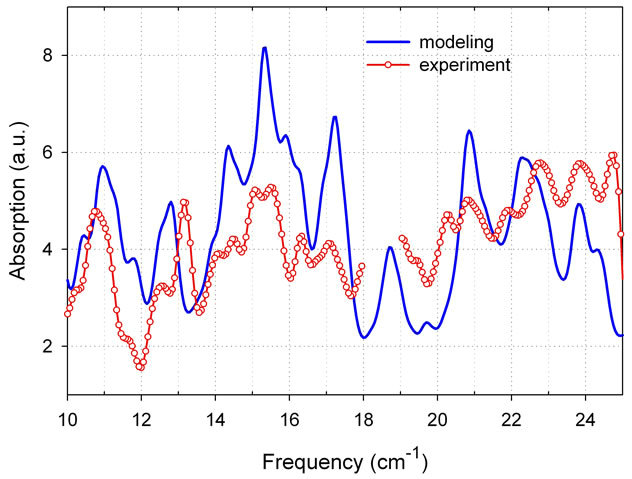
Figure 1. Absorption coefficient spectrum of protein thioredoxin from E. coli measured with spectral resolution of 0.25 cm-1 (Bruker spectrometer) is compared with the modeling result (averaging correlation matrix, γ = 0.5 cm-1. Data are taken from our paper [6]).
and experimental results as measured with a moderate spectral resolution of 0.25 cm-1.
4. STATISTICAL MODEL FOR E. COLI DNA SEQUENCE USING MONTE-CARLO TECHNIQUE FOR MARKOV CHAIN
Terahertz spectroscopy of biological macromolecules reflects low frequency internal molecular vibrations. Relatively new experimental sub-THz spectroscopy has already demonstrated significant achievements in the last decades in regards to sample preparation techniques and enhancing characterization sensitivity and results reproducibility. It was demonstrated that sub-THz radiation can effectively be used to identify various complex biological molecules. However, deeper understanding of interaction mechanism of THz radiation with biological molecules requires development of computational modeling in parallel with experimental studies. We have recently simulated spectra of relatively small biological molecules like transfer RNA or protein thioredoxin from E. coli using molecular dynamic (MD) simulations (sections 2 and 3). We demonstrated a rather good correlation of simulated spectra with experimental data (see, for example, Figure 1). However a large size of macromolecules (~5 million base pairs for E. coli DNA) prevents direct application of MD simulation at the current level of computational capabilities. The goal of this work is to develop a simplified model of the DNA macro molecule so that the model would capture the most important low-frequency vibrational characteristics of the native DNA. One way to reach the goal is to build a modeling sequence by using the most frequent repeating fragments (2 - 10 base pairs) occurred in the original DNA. The constructed models and MD simulations of the modeled sequences can permit us to calculate expected absorption spectra, and to better understand the mechanism of interaction of THz radiation with a biological molecule by analyzing dynamics of atoms and correlation of local vibrations in the modeled molecule.
4.1. Statistical Model for E. coli DNA Sequence
We developed a new procedure to construct a short DNA sequence much less than the length of the genome to model a whole bacterial genome. We used a second order Markov chain framework combined with a Monte-Carlo technique. The statistical model approach is based on conditional probabilities of occurrence of a single base Xi+2, given that two previous bases in the sequence are Xi and Xi+1 [38].
Using Monte-Carlo technique it is possible to find the most probable sequence of a length L, when random sequences of this length are generated using the conditional probabilities mentioned above [39]. The most probable first two bases have to be found directly from the genome. Then the third base can be found as having the greatest occurrence in random sequences, given that first and second ones have already been determined. Forth base can be found the same way, given that first three bases are known. Applying this algorithm iteratively, each base in the sequence can be specified.
An additional condition is applied to every random sequence to be accepted and used in the further analysis:
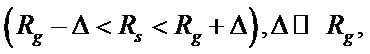 (2)
(2)
where Rg and Rs are the ratios of the nucleotide of a certain type to the total number of nucleotydes in genome and in the randomly generated sequence, correspondently. Δ is the tolerance parameter which determines how accurately should be the correspondence between Rg and Rs. In our case, Δ = 0.007.
E. coli bacteria include different strain groups with sequences similarity between strains in one group. Statistical models permit us to find strains, which can be discriminated on the basis of their modeled sequencing resulted in specificity of their vibrational spectroscopic signatures. By generating statistical models for different strains, we can predict that if some DNA strains have different modeled sequences they may also have different absorption spectra.
E. coli strain BL21 (4534552 bp) derived from E. coli strain B is commonly used as a host strain for protein expression and purification [40-42]. The highly virulent strain CFT073 is one of uropathogenic strains of E. coli— the most common cause of non-hospital-acquired urinary tract infections [43].
The sequences for two E. coli strains, pathogenic CFT073 and non-pathogenic BL21, are quite different: BL21—GCGCGCAGCATTTTTTTCAGCGCAGCGAA AAATTTCGCGCGCAGTTTAACGCGATCAGT, CFT073—GCGCAGCAGCACATTTTTTTTCAGCGCAGCAGCAGATTTTCAGCAGATCAGCGATCAGT, and we can expect a noticeable difference in simulated absorption spectra from these two strains.
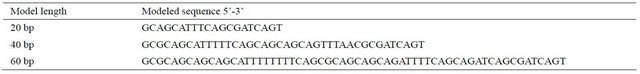
We have modeled 20, 40 and 60 base sequences for two E. coli strains, a non-pathogenic strain BL21 and a pathogenic strain CFT073. Calculated sequences for 20, 40 and 60 bases of a CFT073 E. coli strain are compared in the Table 1. Since the proposed modeling approach is used to determine the most frequent pattern in the genome, we suggest that with increasing the length, the modeled sequence becomes more representative and able to accurately reflect characteristic features of genomic DNA. E. coli genome contains large numbers of repeated fragments of different length like TTTTT. The presentation of these fragments in a statistical model is improving with increased model length and we expect that the 60 bp sequence is more accurate.
4.2. Discriminative Capability
Table 2 lists generated DNA 60 bp sequences from our models for several E. coli strains. By generating statistical models for different strains we can verify that if some DNA strains have different modeled sequences they may also have different absorption spectra. For the first three strains, K-12 DH10B, K-12 BW2952, and K-12 MG- 1655, our statistical models are identical as will be their THz spectra simulated on the bases of these models. As a result, we will not be able to discriminate between these strains in modeling of 60 bases. We also expect that these strains will be more difficult to discriminate experimentally. The sequences for two E. coli strains, pathogenic CFT073 and non-pathogenic BL21, are quite different and we expected a noticeable difference in simulated absorption spectra from these two strains. This is in fact confirmed by the results of MD simulations.
4.3. Molecular Dynamic Simulation Results
4.3.1. Structure
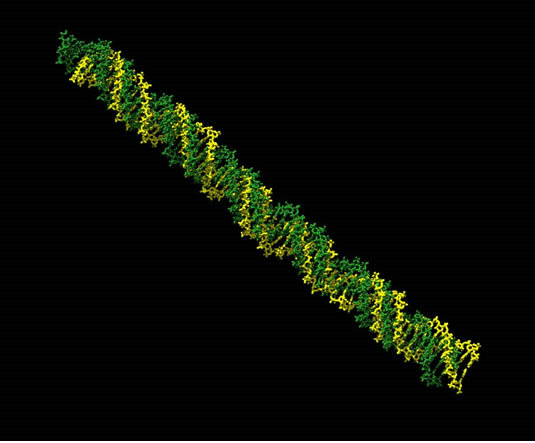
Using our statistical models in MD simulations permits us to generate structure of DNA strains. Figures 2(a) and 2(b) compare structure of DNA 60 bp models of two strains in 12 Angstrom water box before and after energy minimization (The pictures are generated using Chimera (http://www.cgl.ucsf.edu/chimera/). The molecules became more compact after minimization. It’s clearly seen in upper left corner of the pictures.
4.3.2. Absorption Spectra
We calculated absorption spectra for 20 - 60 base model sequences. MD simulation with explicit water was applied. We investigated the convergence of DNA MD simulation using the approach that was originally developed for E. coli protein thioredoxin to calculate absorption spectra with averaging of atomic displacement correlation matrices as described in [6]. Figure 3" target="_self"> Figure 3 compares two simulated spectra for 60 bp sequence of CFT073 E. coli strain model presented in Tables 1 and 2. The first spetrum is obtained in a 600 ps production run, and the second one is calculated using averaging correlation matrices procedure for 6 × 100 ps intervals taken from the same run. We consider that the convergence is good (reTable 1. Modeled 20, 40 and 60 base sequences for CFT073 E. coli strain.
Table 2. Comparison of different E. coli strains.
 (a)
(a)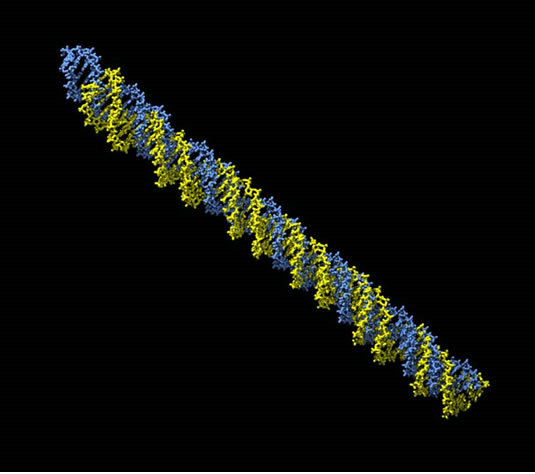 (b)
(b)
Figure 2. (a) BL21strain: green—before energy minimization; yellow—after minimization; (b) CFT073 (pathogenic) strain: blue—before energy minimization; yellow—after minimization.
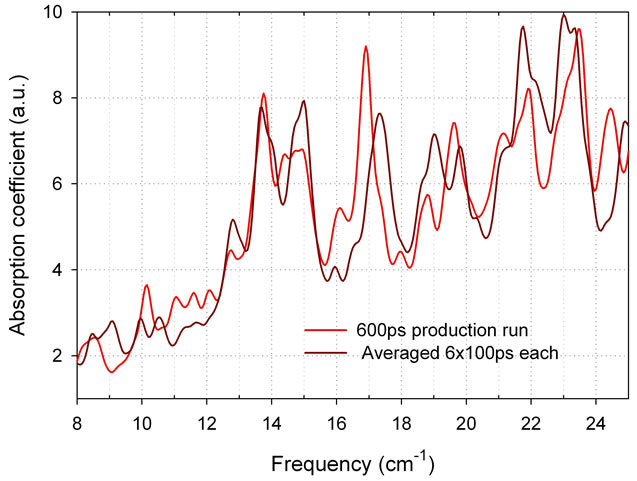
Figure 3. Simulated spectra for 60 bp sequence of CFT073 E. coli strain model. Red—600 ps production run; brown—averaging correlation matrices from six equal intervals of 100 ps each. Dissipation factor is 0.5 cm-1 for a moderate spectral resolution of 0.25 cm-1 (Bruker FTIR). Water box 12 A.
sults of MD simulations are stable) if only small differences are observed. As it is demonstrated in Figure 3, the results of MD simulations are stable thus indicating a good convergence of MD simulation for DNA molecules. This result is consistent with the general opinion that convergence problem in MD is less crucial for DNAs compare to proteins.
As expected, spectra are sensitive to the number of base pairs in the model (see Figure 4 for 40, and 60 bp). Although models with larger number of base pairs probably give better presentation of absorption spectrum, we are currently limited to 60 bp.
To demonstrate the effect of DNA sequence on their THz vibrational spectra we simulated absorption spectra for CFT073 and BL21 (Figure 5). The modeling results predict that we can discriminate between pathogenic and
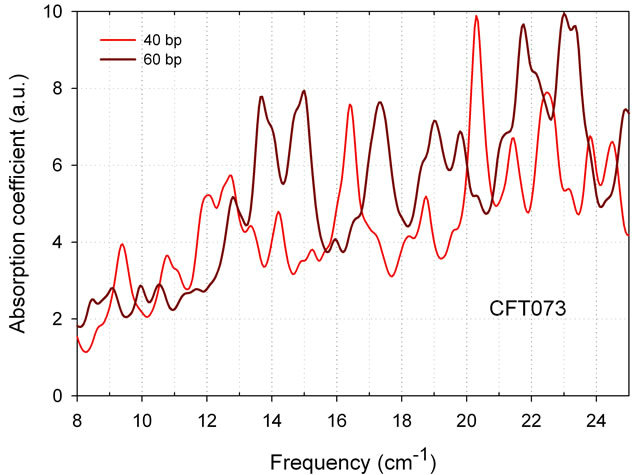
Figure 4. THz absorption spectra of CFT073 E. coli strain models with 40 and 60 bp. Dissipation factor is 0.5 cm-1 for a moderate spectral resolution of 0.25 cm-1 (Bruker FTIR). Averageing 6 matrices, water box 12A.
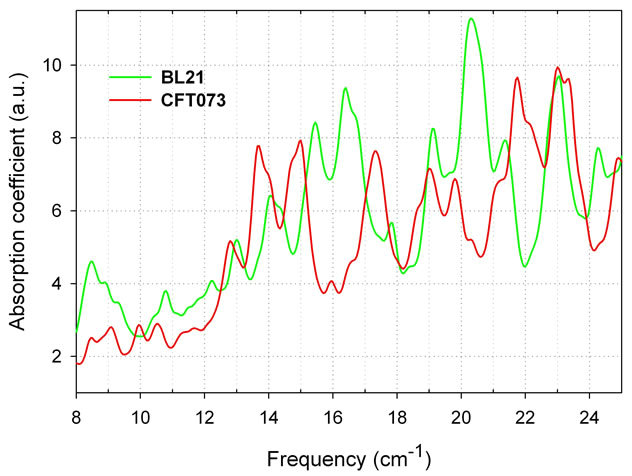
Figure 5. THz absorption spectra of two E. coli strains, pathogenic CFT073 and non-pathogenic BL21, 60 bp models, six matrices, water box 12 A. Dissipation factor is 0.5 cm-1 for a moderate spectral resolution of 0.25 cm-1 (Bruker FTIR).
nonpathogenic strains of E. coli 60 bp models using their sub-THz vibrational spectra.
Higher spectral resolution gives even better results. Absorption spectra from non-pathogenic BL21strain and deadly strain EDL933 [44] using 60 bp models (water box 12 A, averaged in all three directions, dissipation factor 0.12 cm-1) are shown below in Figure 6. Many features for discrimination are available. This spectral resolution is already demonstrated in the range 11 - 16.8 cm-1 using Vibratess spectrometer.
4.3.3. Effect of Water
When modeling biological molecules in water solutions, we actually generate and study complexes of biomaterial with water. In our standard simulation we put a biomolecule inside a 12 A water box containing more than 30 thousands of water molecules. It is a known fact that the first several layers of water, the mostly close to a bio-molecule, have different 3D structure and properties compare to water layers far away from a solvate [20]. These “internal” layers are tight bonded and can have almost crystalline structure with large number of hydrogen bonds which might contribute to vibrational spectra.
Figure 7 shows significant changing of E. coli BL21 strain absorption spectrum when water box in simulation was reduced only from 12 to 10 A. By modifying one of MD parameters, the size of water box, we can study variability of THz absorption spectra from bio-molecules depending on material concentration in water solution and even at transition to dry condition. Experimental absorption spectrum for a virtually dry E. coli B strain is also shown, with significantly reduced intensities of peaks.
4.4. Highly Resolved Vibrational Spectroscopy (0.03 cm-1): Comparison with Experiment
In this section we demonstrate some results from spectroscopy with the resolution of 0.03 cm-1 using Vibratess spectrometer. Transmission spectra were obtained in the sub-THz region between 315 and 480 GHz for both, macromolecules and biological species. Due to high sensitivity, good spectral resolution, and spatial resolution below the diffraction limit, this spectroscopic instrument permits us to observe intense and narrow spectral resonances in transmission/absorption spectra of nano-samples from biological materials. To demonstrate the capabilities of the spectrometer, transmission spectra from bacterial cells and some of their molecular components (DNA, thioredoxin) were measured. From the transmission spectrum of E. coli DNA shown in Figure 8, the width of spectral lines can be estimated as ~ 0.1 cm-1.
To further confirm the reality of the observed narrow and intense resonance features in the sub-THz transmis-
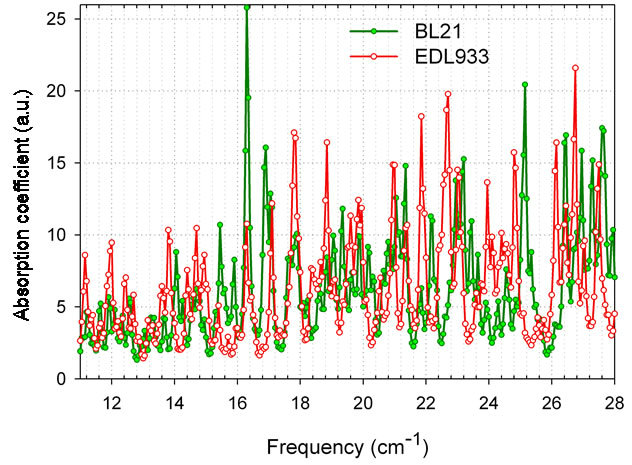
Figure 6. Highly resolved absorption spectra from E. coli nonpathogenic strain BL21, and deadly strain EDL933 (O157:H7), 60 bp models, water box 12 A, averaged in all three directions, dissipation factor 0.12 cm-1.
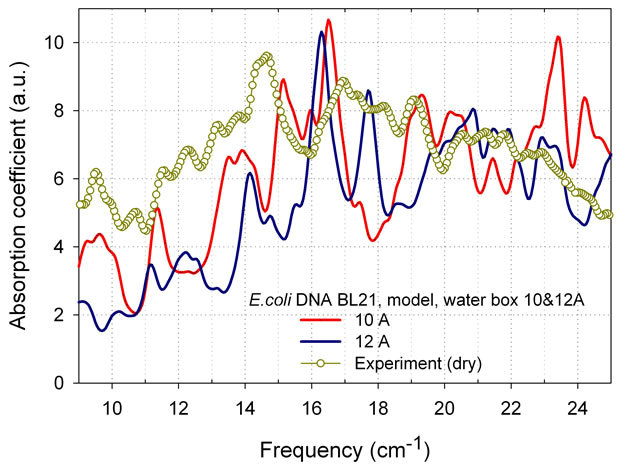
Figure 7. Simulated absorption spectra of E. coli BL21 strain in water box 10 and 12 A, 600 ps, γ = 0.5 cm-1. Experimental data for virtually dry E. coli B are also shown. Spectral resolution 0.25 cm-1.
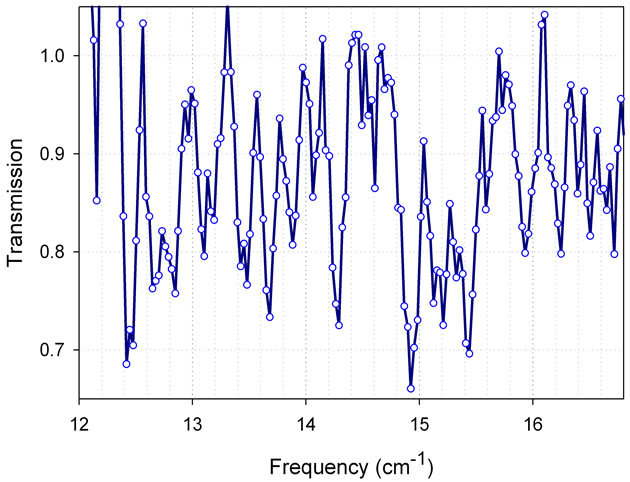
Figure 8. Transmission spectrum of E. coli DNA, (500 ng of material in the drop). Figure is taken from our paper [2].
sion/absorption spectra of biological materials as measured with the new spectroscopic sensor, we compared in Figure 9 the spectrum from the E. coli protein thioredoxin with computational modeling results using MD simulations with a damping factor of γ = 0.12 cm-1.
Due to possible contributions from several different modes occurring at close frequencies, the width of spectral lines gives us an upper limit of γ. As seen in Figure 9, not all peaks are reproduced in the measured and simulated spectra, since simulation parameters have not yet been optimized. Besides, the same value of γ was used to calculate absorption for all vibrational modes. However, the overall correlation between the theory and experimental data confirms again the existence of intense and narrow absorption lines, which can be used for discrimination between different bacteria and strains.
5. CONCLUSION
In this work we presented computational and experimental results with the goal to establish a theoretical basis for exploring THz spectrum for the discovery of new spectral signatures from biological materials. We have developed a new statistical model to construct DNA sequences significantly less than the length of the entire genome (20 - 60 base pairs), using the most frequently repeated fragments (2 - 10 base pairs) in the original DNA. We analyzed the results from MD simulations of our new developed models of DNA sequences from E. coli. We demonstrated that the application of molecular dynamics simulations to the 60 base pair DNA models promises high discriminative capability for biosensing in sub-THz regime. MD simulation of the chromosomal DNA of select model organisms revealed that in the case of a good spectral resolution discrimination is
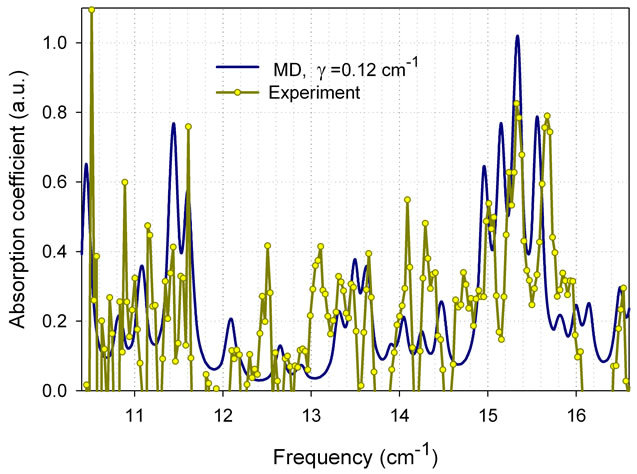
Figure 9. Absorption spectrum of protein thioredoxin from E. coli: MD simulation and experimental results as measured using Vibratess spectroscopic sensor. Figure is taken from our paper [2].
possible up to the level of strains of one bacterial species. Modeling results are supported by experimental spectroscopic data. The experimental results measured with high spectral resolution demonstrate very intense and narrow spectral features from DNA and a protein thioredoxin from E. coli with the line width ~0.1 cm-1. These results combined with MD simulation confirm that highly resolved sub-THz vibrational spectroscopy can be used for reliable and accurate detection of nanograms of E. coli using optical, highly sensitive biosensors operating at room temperature with significantly improved ability to discriminate between species up to the level of the strains of the same bacteria.
6. ACKNOWLEDGEMENTS
This work is supported by the Defense Threat Reduction Agency, grant #HDTRA1-08-1-0038 and by the contract from the ARO #W911NF- 08-C-0049.
REFERENCES
- Finlay, B.B. (2010) The art of bacterial warfare. Scientific American, 302, 56-63. doi:10.1038/scientificamerican0210-56
- Globus, T., Moyer, A., Gelmont, B., Khromova, T., Lvovska, M., Sizov, I. and Ferrance, J. (2012) Highly resolved sub-Terahertz vibrational spectroscopy of biological macromolecules and cells. IEEE Sensors Journal, 13, 72-79. doi:10.1109/JSEN.2012.2224333
- Globus, T., Woolard, D., Crowe, T.W., Khromova, T., Gelmont, B. and Hessler J. (2006) Terahertz fourier transform characterization of biological materials in a liquid phase. Journal of Physics D: Applied Physics, 39, 3405- 3413. doi:10.1088/0022-3727/39/15/028
- Globus, T., Dorofeeva, T., Sizov, I., Gelmont, B., Lvovska, M., Khromova, T., Chertihin, O. and Koryakina Y. (2012) Sub-THz vibrational spectroscopy of bacterial cells and molecular components. American Journal of Biomedical Engineering, 2, 143-154.
- Bykhovski, A., Globus, T., Khromova, T., Gelmont, B., Woolard, D.L. and Bykhovskaia, M. (2006) An analysis of the THz frequency signatures in the cellular components of biological agents. SPIE Defense and Security Symposium, 6212, 132-141.
- Alijabbari, N., Chen, Y., Sizovm I., Globus, T. and Gelmont, B. (2012) Molecular dynamics modeling of the subTHz vibrational absorption of thioredoxin from E. coli. Journal of Molecular Modeling, 18, 2209-2218. doi:10.1007/s00894-011-1238-6
- Sizov, I., Gelmont, B. and Globus, T. (2011) Statistical model for E. coli DNA sequence using Monte-Carlo technique for Markov chain. Study of sub-THz molecular vibrations. DTRA CBD S&T Conference, Las-Vegas, 5 October 2011.
- Bykhovski, A., Li, X., Globus, T., Khromova, T., Gelmont, B., Woolard, D., Samuels, A. and Jensen, J. (2005) THz absorption signature detection of genetic material of E. coli and B. subtilis. SPIE Proceedings of Chemical and Biological Standoff Detection III, 5995, 2005.
- Bykhovski, A., Globus, T., Khromova, T., Gelmont, B. and Woolard, D. (2007) Resonant Terahertz spectroscopy of bacterial thioredoxin in water: Simulation and experiment. ISSSR-Proceedings, 888-896.
- Globus, T. (2010) Low-Terahertz resonance spectroscopy for fingerprinting of biological and organic materials. DTRA CBD S&T Conference, Orlando, 15-19 November 2010.
- Globus, T., Bykhovskaia, M., Woolard, D. and Gelmont, B. (2003) Sub-millimeter wave absorption spectra of artificial RNA molecules. Journal of Physics D: Applied Physics, 36, 1314-1322. doi:10.1088/0022-3727/36/11/312
- Globus, T., Woolard, D., Bykhovskaia, M., Gelmont, B., Werbos, L. and Samuels, A. (2003) THz spectroscopic sensing of DNA and related biological materials. International Journal of High Speed Electronics, 13, 903. doi:10.1142/S0129156403002083
- Bykhovskaia, M., Gelmont, B., Globus, T., Woolard, D., Samuels, A., Ha-Duong, T. and Zakrzewska, K. (2001) Prediction of DNA far IR absorption spectra basing on normal mode analysis. Theoretical Chemistry Accounts, 106, 22-27. doi:10.1007/s002140100259
- Globus, T., Bykhovskaia, M., Gelmont, B. and Woolard, D. (2001) Far-infrared phonon modes of selected RNA molecules. Proceedings of SPIE, Instrumentation for Air Pollution and Global Atmospheric Monitoring, 4574, 119. doi:10.1117/12.455149
- Li, X., Globus, T., Gelmont, B., Salay, L. and Bykhovski, A. (2008) Terahertz absorption of DNA decamer duplex. The Journal of Physical Chemistry A, 112, 12090-12096. doi:10.1021/jp806630w
- Heilweil, E.J. and Plusquelic, D.F. (2008) Terahertz spectroscopy of biomolecules, In: Terahertz Spectroscopy, CRC Press, Taylor & Francis Group, LLC, London and New York, 269-297.
- Plusquellic, D.F., Siegrist, K., Heilweil, E.J. and Esenturk, O. (2007) Applications of Terahertz spectroscopy in biosystems. ChemPhysChem, 8, 2412-2431. doi:10.1002/cphc.200700332
- Zhang, H., Siegrist, K., Douglas, K.O., Gregurick, S.K. and Plusquellic, D.F. (2008) THz investigations of condensed phase biomolecular systems. Methods in Cell Biology, 90, 417-434. doi:10.1016/S0091-679X(08)00818-2
- Korter, T.M. and Plusquellic, D.F. (2004) Continuouswave Terahertz spectroscopy of biotin: Vibrational anharmonicity in the far-infrared. Chemical Physics Letters, 385, 45-51. doi:10.1016/j.cplett.2003.12.060
- Li, T., Hassanali, A.A., Kao, Y.T., Zhong, D. and Singer S.J. (2007) Hydration dynamics and time scales of coupled water-protein fluctuations. Journal of the American Chemical Society, 129, 3376-3382. doi:10.1021/ja0685957
- Furse, K.E. and Corcelli, S.A. (2010) Molecular dynamics simulations of DNA solvation dynamics. The Journal of Physical Chemistry Letters, 1, 1813-1820. doi:10.1021/jz100485e
- Qiu, W., Wang, L., Lu, W., Boechler, A., Sanders, D.A.R. and Zhong, D. (2007) Dissection of complex protein dynamics in human thioredoxin. Proceedings of the National Academy of Sciences of the United States of America, 104, 5366-5371. doi:10.1073/pnas.0608498104
- Globus, T., Moyer, A., Gelmont, B., Sizov, I. and Khromova, T. (2011) Dissipation time in molecular dynamics and discriminative capability for sub-Terahertz spectroscopic characterization of bio-simulants. DTRA CBD S&T Conference, Las-Vegas, 14-18 November 2011.
- Globus, T., Moyer, A., Gelmont, B., Lichtenberger, A., Ferrance, J., Weikle, R. and Lvovska, M. (2011) Sub-Terahertz spectroscopy of bio-materials with high spectral and spatial resolution. Nano DDS, Salt Lake City, 2011.
- Parthasarathy, R., Bykhovski, A., Gelmont, B., Globus, T., Swami, N. and Woolard, D.L. (2007) Enhanced coupling of sub-Terahertz radiation with semiconductor periodic slot arrays, Physical Review Letters, 98, Article ID: 153906. doi:10.1103/PhysRevLett.98.153906
- Gelmont, B., Parthasarathy, R., Globus, T., Bykhovski, A. and Swami, N. (2008) Terahertz (THz) electromagnetic field enhancement in periodic subwavelength structures. IEEE Sensors Journal, 8, 791-796. doi:10.1109/JSEN.2008.923222
- Gelmont, B. and Globus, T. (2011) Edge effect in perfectly conducting periodic subwavelength structures. IEEE Transactions on Nanotechnology, 10, 83-87. doi:10.1109/TNANO.2010.2064785
- Gelmont, B., Globus, T., Bykhovski, A., Lichtenberger, A., Swami, N., Parthasarathy, R. and Weikle, R. (2012) Method of local electro-magnetic field enhancement of Terahertz (THz) radiation in sub wavelength regions and improved coupling of radiation to materials through the use of the discontinuity edge effect. US Patent No. 8309930.
- Woolard, D., Brown, E., Pepper, M. and Kemp, M. (2005) Terahertz frequency sensing and imaging: A time of reckoning future applications? Proceedings of the IEEE, 93, 1722. doi:10.1109/JPROC.2005.853539
- Case, D.A., Pearlman, D.A., Caldwell, J.W., Cheatham III, T.E., Wang, J., Ross, W.S., Simmerling, C.L., Darden, T.A., Merz, K.M., Stanton, R.V., Cheng, A.L., Vincent, J.J., Crowley, M., Tsui, V., Gohlke, H., Radmer, R.J., Duan, Y., Pitera, J., Massova, I., Seibel, G.L., Singh, U.C., Weiner, P.K. and Kollman, P.A. (2004) AMBER 8. University of California, San Francisco.
- Case, D.A., Darden, T.A., Cheatham III, T.E., Simmerling, C.L., Wang, J., Duke, R.E., Luo, R., Crowley, M., Ross, W.S., Zhang, W., Merz, K.M., Wang, B., Hayik, S., Roitberg, A., Seabra, G., Kolossváry, I., Wong, K.F., Paesani, F., Vanicek, J., Wu, X., Brozell, S.R., Steinbrecher, T., Gohlke, H., Yang, L., Tan, C., Mongan, J., Hornak, V., Cui, G., Mathews, D.H., Seetin, M.G., Sagui, C., Babin, V. and Kollman, P.A. (2008) AMBER 10. University of California, San Francisco.
- Liki'c, V.A., Gooley, P.R., Speed, T.P. and Strehler, E.E. (2005) A statistical approach to the interpretation of molecular dynamics simulations of calmodulin equilibrium dynamics. Protein Science, 14, 2955-2963. doi:10.1110/ps.051681605
- Lewars, B.G. (2003) Computational chemistry: Introduction to the theory and applications of molecular and quantum mechanics. Springer, Berlin.
- Bykhovski, A., Globus, T., Khromova, T., Gelmont, B. and Woolard, D. (2008) Resonant Terahertz Spectroscopy of Bacterial Thioredoxin in Water: Simulation and Experiment. In: Selected Topics in Electronics and Systems. Spectral Sensing Research for Water Monitoring Applications and Frontier Science and Technology for Chemical, Biological and Radiological Defense. World Scientific Publishing Co., Singapore City, 48, 367-375.
- Globus, T., Alijabbary, N., Chen, Y., Sizov, I. and Gelmont, B. (2010) Molecular dynamics modeling of subTHz vibrational absorption of thioredoxin from E. coli. DTRA CBD S&T Conference, Orlando, 15-19 November 2010.
- Karplus, M. and Kushick, J.N. (1981) Method for estimating the configurational entropy of macromolecules. Macromolecules, 14, 325-332. doi:10.1021/ma50003a019
- Levy, R.M., Karplus, M., Kushick, J. and Perahia, D. (1984) Evaluation of the configurational entropy for proteins: Application to molecular dynamics simulations of an alfa-helix. Macromolecules, 17, 1370-1374. doi:10.1021/ma00137a013
- Durbin, R., Eddy, S., Krogh, A. and Mitchison, G. (1998) Biological sequence analysis: Probabilistic models of proteins and nucleic acids. Cambridge University Press, Cambridge, 368.
- Ching, W.-K., Ng, M.K. and Ching, W. (2005) Markov chains: Models, algorithms and applications. Springer, 208.
- Studier, F.W. and Moffatt, B.A. (1986) Use of bacteriophage T7 RNA polymerase to direct selective high-level expression of cloned genes. Journal of Molecular Biology, 189, 113-130. doi:10.1016/0022-2836(86)90385-2
- Grodberg, J. and Dunn, J.J. (1988) ompT encodes the Escherichia coli outer membrane protease that cleaves T7 RNA polymerase during purification. Journal of Bacteriology, 170, 245-253.
- Phillips, T.A., VanBogelen, R.A. and Neidhardt, F.C. (1984) Lon gene product of Escherichia coli is a heat-shock protein. Journal of Bacteriology, 159, 283-287.
- Welch, R.A., Burland, V., Plunkett III, G., Redford, P., Roesch, P., Rasko, D., Buckles, E.L., Liou, S.-R., Boutin, A., Hackett, J., Stroud, D., Mayhew, G.F., Rose, D.J., Zhou, S., Schwartz, D.C., Perna, N.T., Mobley, H.L.T., Donnenberg, M.S. and Blattner, F.R. (2002) Extensive mosaic structure revealed by the complete genome sequence of uropathogenic Escherichia coli. Proceedings of the National Academy of Sciences of the United States of America, 99, 17020-17024. doi:10.1073/pnas.252529799
- Kendall, M.M., Gruber, C.C., Rasko, D.A., Hughes, D.T. and Sperandio, V. (2011) Hfq virulence regulation in enterohemorrhagic Escherichia coli O157:H7 strain 86-24. Journal of Bacteriology, 193, 6843-6851. doi:10.1128/JB.06141-11