Modern Economy
Vol.09 No.12(2018), Article ID:89233,17 pages
10.4236/me.2018.912134
Study on Regional Efficiency and Productivity of Guangdong Province
―Based on Hicks-Moorsteen TFP Index
Jia Miao
Institute of Economics, Jinan University, Guangzhou, China

Copyright © 2018 by author and Scientific Research Publishing Inc.
This work is licensed under the Creative Commons Attribution International License (CC BY 4.0).
http://creativecommons.org/licenses/by/4.0/


Received: November 10, 2018; Accepted: December 16, 201; Published: December 19, 2018
ABSTRACT
In this paper, Hicks-Moorsteen TFP index is employed to investigate regional efficiency and productivity of 21 cities in Guangdong province during 2000-2015. The findings demonstrate that the efficiency of the whole province first rises and then falls, and has rebounded in recent years. Technical efficiency and scope efficiency have increased, while regional scale efficiency has declined. The Pearl River Delta region has obvious competitive advantages, and scope efficiency alleviates the decline in the efficiency of the non PRD. Secondly, the results indicate that Shenzhen has strong regional development competitiveness, and the economic development efficiency which leads Guangdong province. Thirdly, although the total factor productivity of 21 cities in Guangdong province has increase 0.38 percent with an average level of 1.0165 during this period with a comparatively large fluctuation, the slow growth of technological progress hindered the progress of TFP to some extent. In addition, the TFP level in the PRD region has some advantages over the non PRD region. Finally, as the most efficient city, Shenzhen’s TFP level is in the middle and upper reaches and has great potential.
Keywords:
Guangdong Province, Efficiency, TFP, Hicks-Moorsteen TFP Index

1. Introduction
Since the reform and opening up, China’s economy has achieved rapid growth by relying on extensive growth mode of factor input. With the limitation of resources, whether the mode of economic growth can change from the traditional factor input type to the total factor productivity-driven type is the key to achieving sustainable growth of China’s economy. As the leader of the country’s reform and opening up, Guangdong Province is increasingly constrained by resources, and Shenzhen and Zhuhai Special Economic Zones no longer enjoy special policy dividends. The province’s gross domestic product (GDP) increased from 1074.125 billion yuan in 2000 to 8085.491 billion yuan in 2016, accounting for 10.87% of the national GDP from 10.71%, but lower than the maximum value of 12.12% in 2006. On April 4, 2017, General Secretary Xi Jinping made important instructions on the work of Guangdong, demanding that Guangdong Province “provide support for the nationwide promotion of supply-side structural reform, implementation of innovation-driven development strategy and the construction of an open economic new system”. The author believes that the three supports provided by Guangdong Province for the whole country will not depend on the rapid increase of the total economic volume, but on the connotative development experience. Therefore, it is necessary to measure the economic development efficiency and total factor productivity of Guangdong Province, scientifically summarize the economic development experience of Guangdong Province, and provide a basis for formulating appropriate policy measures to improve the efficiency of economic development and promote the growth of total factor productivity.
In economic research, efficiency has always been the core research issue, namely how to achieve maximum output with minimum input under resource constraints. Specifically, if the output is at the maximum level with a given input, on the contrary, at a given output level, if the input can reach the minimum level, the production is efficient. As the comprehensive efficiency of input and output of production factors, Total Factor Productivity (TFP) is not only the core issue of development economics, but also the key issue of studying the economic growth of a country or region. It plays an important role in explaining economic growth. It reflects the part of production which can still increase when the input of production factors is constant. It is an important indicator for measuring the quality of economic growth and a necessary basis for formulating industrial policies.
In this paper, the output-oriented non-parametric Hicks-Moorsteen TFP index proposed by O’Donnell [1] is used to measure and decompose the efficiency and total factor productivity of 21 cities in Guangdong Province in 2000-2015. The regional efficiency studied in this paper is the capacity of each region to maximize output as an independent decision-making production unit under the given resource constraints. Secondly, this paper further studies the dynamic change of efficiency, i.e. the change of total factor productivity in each region and in Guangdong Province as a whole.
The following contents of this paper include the relevant literature review in the second part, the methods and data of the Hicks-Moorsteen TFP index in the third part, the empirical research in the fourth part and the conclusion of the last part.
2. Literature Review
Neo-classical economic growth theory uses total factor productivity to measure the role of technological progress in production. In essence, it reflects the ability of a country or region to get rid of backward economic level in a certain period of time. It is an important tool to analyze the source of economic growth and to explain the economy. In terms of method, the measurement of total factor productivity has experienced the development of growth accounting [2], stochastic frontier analysis [3] [4], data envelopment analysis [5] and Malmquist index method [6] . Among them, data envelopment analysis (DEA) and DEA combined with Malmquist index can effectively decompose TFP changes, which has attracted more and more attention in recent studies. In recent research, Hicks-Moorsteen TFP index proposed by O’Donnell [1] has both economic significance of efficiency decomposition and post-decomposition index. It is superior to Malmquist productivity index. It has great research potential to use this index to measure total factor productivity.
With the development of foreign TFP theories and the deepening of China’s reform and opening up process, the TFP of China has also gradually developed. In the early stage, domestic scholars paid more attention to the study of total factor productivity in China. Among them, Li Jingwen and Zhong Xueyi [7], Zhang Jun and Shi Shaohua [8] used Solow residual method to study total factor productivity in different stages of China, which provided a solid foundation for subsequent research. With the continuous improvement of theory and calculation methods, more and more scholars began to re-calculate China’s total factor productivity, and constantly improve the analysis of China’s total factor productivity (Guo Qingwang and Jia Junxue [9]; Li Bin and Zeng Zhixiong [10]; Zhang Shaohua and Jiang Weijie [11] ). Guo Qingwang and Jia Junxue [9] used different TFP estimation methods to measure and analyze the growth rate of TFP in China from 1979 to 2004, and further analyzed the internal relationship between TFP and economic growth; Zhang Shaohua and Jiang Weijie [11] introduced the Input Slack-based Productivity (ISP) for the first time, and based on this index to measure and decompose China’s TFP from 1985 to 2009.
With the differentiation of regional economic development, scholars have paid more attention to the regional analysis of TFP. On the one hand, they have inspected the changes and decomposition of TFP (Yan Pengfei, Wang Bing [12]; Zheng Jinghai, Hu An Steel [13] ). On the other hand, further analysis of the regional differences in total factor productivity reveals that the contribution of TFP to economic growth is gradually increasing, and that the difference in TFP is a decisive factor in China’s regional economic disparity (Peng Guohua [14]; Fu Xiaoxia, Wu Lixue [15]; Li Guozhang [16] ). In recent years, domestic scholars have paid attention to the study of heterogeneity of TFP in industry or sector, and the research on TFP of the industry sector has covered a wide range, including the research of industrial sector (Tu Zhengge, Xiao Geng [17]; Li Shengwen, Li Dasheng [18]; Cheng Huifang, Lu Jiajun [19] ) and banking (Cai Yuezhou and Guo Meijun [20]; Jiang Yonghong and Jiang Weijie [21]; Shen Yue and Guo Pin [22] ).
In addition to inter-provincial and industry sector studies, some scholars also analyze from the urban level, but few studies have been conducted to study the heterogeneity of regional total factor productivity in Guangdong Province. The Pearl River Delta region and surrounding cities are more likely to appear in the study as a research unit. Cheng Yuhong and Zhang Weiqi [23] studied the total factor productivity of various cities in Guangdong Province and considered that Shenzhen is an efficient and stable city. Wang Xia et al. [24] calculated the total factor productivity of 17 central cities in China based on DEA-Malmquist method, and found that Shenzhen’s total factor productivity increased by more than 4%, indicating that Shenzhen’s economic structure was rationally adjusted and its economy developed harmoniously between 2000 and 2013. Wang Yiming et al. [25] estimated and analyzed the total factor productivity of 255 cities across the country and found that in the results of the SFA or DEA-Malmquist method, the cities in Guangdong Province with the rising total factor productivity index were the most in all provinces, including Guangzhou and Shenzhen.
It can be seen that the domestic research on TFP has been more systematic and comprehensive, and has achieved a wide range of applications from the national level to the industry and enterprise level, which can better explain the development of various sectors. However, the literature on the heterogeneity of TFP in Guangdong Province and its region is still inadequate, and relevant research is urgently needed. Therefore, using the more excellent Hicks-Moorsteen TFP index method proposed by O’Donnell [6], this paper synthetically calculates the efficiency and total factor productivity level of Guangdong Province, which is of innovative significance both in reality and in theory.
3. The Model and Data
3.1. Model
This paper systematically analyzes the economic of Guangdong Province from the aspects of efficiency and total productivity. The efficiency analysis can reflect the level change of the economy in the same period. The analysis of total factor productivity can reflect the level change of the industry under the intertemporal period. The Hicks-Moorsteen TFP index method proposed by O’Donnell [6] can simultaneously measure the efficiency value of the decision-making unit and the total factor productivity, and decompose it into technical changes, scale changes, and range changes.
Combining N decision-making units, phase T, input variables for a given industry , Output variable , make , , respectively, the input total function and the output total function. Then the TFP of the decision unit is:
(1)
Therefore, efficiency can be considered as the difference between the actual technical level and the maximum technical level, that is, the ratio of the actual technical level to the maximum technical level:
(2)
TFPE is an efficiency indicator. are the total amount of input and output when TFP reaches its maximum value. Further decomposition of TFPE yields technical efficiency (ITE), scale efficiency (ISE), and range efficiency (RME).
(3)
(4)
(5)
Among them, indicates the minimum total input that can be achieved with K times of the observed input vector. are the total output and input when the efficiency value reaches the maximum value under the constraint of .
The TFP of the i unit in the t period is:
(6)
The TFP of the h unit in the s period is:
(7)
The Hicks-Moorsteen TFP Index is:
(8)
Expressed in the form of a decision unit:
(9)
Among them, are output and input function proposed by Shephard (1953). Decompose the Hicks-Moorsteen TFP index to:
(10)
Among them, represents the technological progress index, represents the technical productivity index, represents the scale productivity index, indicates the range productivity index. O’Donnell [6] gives different meanings for each index after TFP decomposition. The technological progress index indicates the movement of the production front, which reflects the “progress”. The technical productivity index indicates the movement of the observation point to the frontier. It reflects the “catch-up effect”. The scale productivity index indicates that it moves on the frontier to achieve economies of scale, reflecting the changes in economies of scale. The range productivity index indicates that the output ratio is adjusted to obtain a range economy, reflecting the scope of economic changes.
3.2. Data
This paper takes the cities of Guangdong Province as the research object. The sample data covers the input and output data of 21 cities in Guangdong Province from 2000 to 2015. The data are from the statistical yearbooks of Guangdong Province and other cities. According to previous research, this paper selects the gross domestic product (GDP) as the output index Y, selects fixed assets investment and social employees as the investment K and labor L input indicators [12] . Combined with previous research, to do the following:
First, the data of all variables are flattened based on 2000. The GDP adopts the GDP deflator index, and the fixed asset investment adopts the fixed asset investment price index.
Secondly, using the perpetual inventory method to calculate the capital stock over the years:
(11)
The initial capital stock of each city:
(12)
Among them, represents the average actual investment growth rate during the sample period for each city; δ is the depreciation rate, which is set at 9.5% in this paper.
Table 1 reports the descriptive statistical results of the input-output variables of Guangdong Province, the Pearl River Delta and the non-Pearl River Delta from 2000 to 20151. It shows that the average value of the Pearl River Delta region is much larger than that of the non-Pearl River Delta region, regardless of the input or output indicators. This indicates that there are regional differences in Guangdong Province. As an important force in the whole economic development of Guangdong Province, the Pearl River Delta region plays an important role in promoting regional development. The non-Pearl River Delta region, which is a less developed region of Guangdong Province, its economic development level is weak. The support for the development of non-Pearl River Delta region needs to be further strengthened.
1The Pearl River Delta region includes: Guangzhou, Shenzhen, Zhuhai, Foshan, Dongguan, Zhongshan, Jiangmen, Zhaoqing, Huizhou; non-Pearl River Delta includes: Shantou, Jieyang, Chaozhou, Shanwei, Yangjiang, Maoming, Zhanjiang, Meizhou, Shaoguan, Yunfu, Qingyuan Heyuan.
4. Empirical Analysis
Under the Hicks-Moorsteen TFP index method, a unified framework of efficiency and total factor productivity is constructed. Based on efficiency analysis

Table 1. Descriptive statistics.
Note: The unit of GDP and capital stock is: 100 million yuan; the unit of labor is: 10,000 people; all data are from the Statistical Yearbook of Guangdong Province.
and productivity analysis, the efficiency-total factor productivity matrix of each index is constructed. The competitiveness of Guangdong Province is comprehensively analyzed from two dimensions and four matrices, and its competitive advantages and disadvantages are judged. The former reflects the degree of utilization or realization of the maximum possible technical level in Guangdong Province and local cities in the same period, that is, the problem of real competitiveness, and the latter reflects the improvement of the actual technical level of the unit in the intertemporal process, that is, the potential competitiveness problem. The combination of the two can fully reflect the competitiveness and changes of Guangdong Province and local cities.
4.1. Analysis of the Efficiency of Various Cities in Guangdong Province
Efficiency measures the relative relationship between production units and production frontier at a given time point, which belongs to static analysis. This paper selects 21 cities in Guangdong Province, calculates the economic development efficiency from 2000 to 2015, and decomposes the efficiency (TFPE) from three aspects: technical efficiency (ITE), scale efficiency (ISE) and range efficiency (RME). The results are listed in the table.
1) The province’s efficiency showed a trend of rising first and then decreasing. The technical efficiency and range efficiency have increased, while the regional scale efficiency has decreased. According to the results of Table 2, the overall efficiency level of Guangdong Province from 2000 to 2015 is below average level, with an average of 0.5119. Generally speaking, it shows a trend of rising first and then declining, with little fluctuation. Although the overall level has improved, the efficiency level remains at the middle level, which shows that Guangdong Province has not been able to make better use of resources. The efficiency value from 2000 to 2003 is less than 0.5, and there is serious inefficiency. Specifically,
Table 2. Changes in efficiency and their decomposition in various cities from 2001 to 2015.
Note: ITE indicates pure technical efficiency; ISE indicates scale efficiency; RME indicates range efficiency; efficiency value less than 1 indicates that there is inefficiency in the year of the city; efficiency value equal to 1 indicates that there is efficiency in the year of the city.
firstly, the average technical efficiency is 0.8626, with the minimum value of 0.8295 and the maximum value of 0.8920. There is little change in the sample interval, which is similar to the trend of TFPE and relatively stable on the whole. Secondly, the average scale efficiency is 0.7464, which is inefficient. From 2000 to 2005, there were more fluctuations than other years, but since 2006, the overall performance showed a weak decline. Finally, the average range efficiency was 0.7862, which has obvious volatility as a whole. The minimum value is 0.6430, and the maximum value is 0.8801. It remains stable in 2001-2003 and 2005-2008. The continuous improvement of range efficiency in recent years has played a reverse role in the decline of the overall efficiency level of Guangdong Province.
2) The Pearl River Delta region has obvious efficiency advantages, and the range efficiency has alleviated the decline of non-Pearl River Delta efficiency (Table 3). Comparing the regional efficiency of the Pearl River Delta region with the non-Pearl River Delta region, the average total factor productivity in the Pearl River Delta region during the sample period was 0.6234, which was much higher than the 0.4282 in the non-Pearl River Delta region. However, there are obvious inefficiencies in both areas. From a single point of view, for the Pearl River Delta, its efficiency level shows a phenomenon of alternating ups and downs, falling from 2000 to 2001, gradually rising from 2002 to 2007, slowly declining from 2008, and maintaining a relatively stable upward trend since 2013. However, there are still inefficiencies. The average values of pure technical efficiency, scale efficiency and range efficiency are 0.8758, 0.8605 and 0.8271 respectively, with little difference. To some extent, it can be inferred that the improvement of total factor productivity efficiency is mainly promoted by pure technical efficiency and scale efficiency. For the non-Pearl River Delta, the average efficiency is 0.4282. There is a very serious inefficiency during the whole sample period, especially in 2001, 2002 and 2003; the efficiency value is only about 0.3. The average pure technical efficiency is 0.8528, which is close to 0.8758 of the Pearl River Delta. The average of scale efficiency and range efficiency are 0.6608 and 0.7556, respectively. Therefore, it can be inferred that pure technical efficiency is the dominant force for the improvement of total factor productivity. Since 2011, pure technical efficiency and scale efficiency have shown a slow decline, only the range efficiency maintains a regular upward trend, which also alleviates the further decline of the overall efficiency in the non-Pearl River Delta region to a certain extent.
3) Shenzhen’s economic development efficiency leads Guangdong Province and has strong regional development competitiveness. In order to analyze the regional efficiency development in Guangdong Province more comprehensively, this paper selects Guangdong Province, Shenzhen, Guangzhou, Zhuhai and Shantou as further analysis objects. Shenzhen, Zhuhai and Shantou belong to the five special economic zones, so it is necessary to make a comparative analysis of the efficiency changes of the special economic zones. Guangzhou is a provincial capital of Guangdong Province, has maintained rapid economic growth for a long time. For this reason, this paper compares the efficiency changes of the above four cities and Guangdong Province.
According to the formula, efficiency can be considered as the ratio of the actual technical level to the maximum technical level (Figure 1). The development efficiency of a region depends largely on the economic environment, economic vitality or geographical factors in which it is located. Shenzhen is supported by the state’s policy, and its economic environment is good, which provides a good foundation for the substantial improvement of Shenzhen’s development efficiency. According to the illustration above, it can be found that the most obvious change in Shenzhen’s efficiency was from 2000 to 2015, from 0.2709 in 2000 to 0.9798 in 2015. In 2003, it began to surpass the provincial level and gradually widened the efficiency of Guangdong Province, which has achieved great growth. It also reflects the increasing efficiency of Shenzhen’s use of inputs and has greatly promoted the economic development of Shenzhen Special Economic Zone.
Guangzhou has similar efficiency trends with Shenzhen, but overall lower than Shenzhen’s development trend. After 2006, the difference of the efficiency between two cities gradually increased. As special economic zones, the efficiency of Zhuhai and Shantou maintained growth before 2007, but gradually declined
Table 3. Regional efficiency analysis from 2000 to 2015.
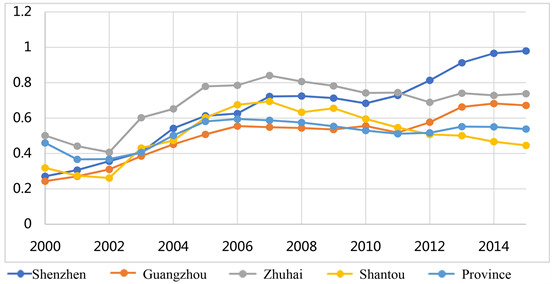
Figure 1. Comparative analysis of the efficiency of Guangdong Province, Shenzhen, Guangzhou, Zhuhai, and Shantou.
after 2007. However, the overall efficiency of Zhuhai is relatively high. In the process of decline, efficiency of Zhuhai was surpassed by Shenzhen in 2011. At the same time, Shenzhen has become the most efficient city in Guangdong Province and has continued.
4.2. Analysis of Total Factor Productivity in Various Cities of Guangdong Province
Unlike the static analysis of efficiency, total factor productivity analysis belongs to dynamic analysis. It can analyze not only the movement of effective frontier (technical progress), but also the relative position change (efficiency change) between production unit and production frontier. The Total Factor Productivity Index is an indicator of the total factor productivity growth.
This paper chooses 21 cities in Guangdong Province to calculate the changes of total factor productivity from 2000 to 2015, and decomposes the total factor productivity index (Hicks-Moorsteen TFP index) into Technology Progress Index (DTECH), Technological Productivity Index (DITE), Scale Productivity Index (DISE) and Range Productivity Index (DRME). The results of total factor productivity measurement are shown in Table 4 and Table 5. According to the calculation results, the following basic judgments can be obtained.
1) The total factor productivity of each city has a large fluctuation during the sample period, with an average level of 1.0165, which achieved an overall average annual growth of 0.38%. According to the decomposition of the Hicks-Moorsteen TFP index, except for the technology progress index, the average values of the technological productivity index, the scale productivity index and the range productivity index are all greater than 1, indicating that the TFP progress in 21 cities in Guangdong Province has not grasped technology progress well from 2000 to 2015, which has hindered the progress of total factor productivity to a certain extent. Specifically, from 2000 to 2015, the average annual technology decline in Guangdong Province was 1.3%, and the average technological progress index was 0.9870. Relatively speaking, technological productivity, scale productivity and range productivity are the driving force for promoting total factor productivity in Guangdong Province. Among them, the effect of range productivity is the most obvious, reaching an average annual rate of 3.55%. However, the effect of technological productivity is not obvious, the average annual rate is only 0.06%, and the scale productivity only increases 0.33% per year. It shows that Guangdong Province has achieved good results in the acquisition of scope economy, and the improvement of total factor productivity is mainly due to the improvement of range productivity. In terms of time variation, total factor productivity in most years has progressed to varying degrees. Only in 2001, 2002 and 2004, total factor productivity showed a decline of 3.27%, 1.86% and 0.39%.
2) The level of TFP in the Pearl River Delta region has certain advantages over the non-Pearl River Delta region. Overall, the Pearl River Delta region is superior to the non-Pearl River Delta region in terms of technological productivity and scale productivity. In terms of regions, the average total factor productivity of the Pearl River Delta region from 2000 to 2015 was 1.0187, which was slightly higher than the 1.0148 in the non-Pearl River Delta region. From a single point of view, the TFP in the Pearl River Delta region showed a 0.95% decline in 2003, mainly because the technology progress index declined by 22.62%, and maintained a good growth trend in the rest of the year. The average values of the technology progress index, the technological productivity index, the scale productivity index and the range productivity index are 0.9821, 1.0020, 1.0186 and
Table 4. 2000-2015 Hicks-Moorsteen TFP index change and its decomposition.
Table 5. 2000-2015 Regional hicks-moorsteen TFP Index Change and its decomposition.
1.0278 respectively, indicating that the average annual technical decline in the Pearl River Delta region is 1.79%. The increase in total factor productivity mainly depends on the scale productivity index and the range productivity index. It can be seen that the economic development of the Pearl River Delta region still needs to rely on technological progress. For the non-Pearl River Delta region, the average value of total factor productivity was 1.0148. In 2001, 2002, 2004 and 2015, TFP decreased by 6.15%, 3.49%, 1.77% and 0.95% respectively. The average value of the technology progress index was 0.9908, which was slightly higher than the 0.9821 in the Pearl River Delta. The average technological productivity index is 0.9995, and the average scale productivity index is 0.9918, which are both lower than the Pearl River Delta, indicating that the non-Pearl River Delta region does not exhibit a “catch-up effect” and in most years there has been diseconomies of scale. The average range productivity index is 1.0413, which is higher than the 1.0287 in the Pearl River Delta, indicating that range productivity has greatly promoted the overall total factor productivity in the non-Pearl River Delta region.
3) The economic development of Shenzhen has strong competitiveness and development potential. This paper selects the changes in total factor productivity of Guangdong Province, Shenzhen City, Guangzhou City, Zhuhai City, and Shantou City, reflecting the changes of economic development level in different cities across the period, and makes a comparative analysis.
The total factor productivity analysis can reflect the changes in the level of each city under the intertemporal period (Figure 2). The TFP changes in the three special areas, Guangzhou and Guangdong province are different, but the overall TFP level is quite similar. Among them, the TFP of Shantou City fluctuated greatly in each period, while the lowest TFP was 0.9271 in 2008 and the highest was 1.1875 in 2003. However, the TFP maintained a continuous downward trend after 2010. Guangzhou and Zhuhai’s overall changes and levels of TFP are relatively similar and remain at a relatively high level, and have remained at around 1.05 for a long time, indicating that Zhuhai City and Guangzhou City are relatively stable in the process of development and effectively improve their own development.
As the most efficient city in terms of development efficiency, Shenzhen does not have the strongest advantage in the level of total factor productivity. As for the TFP decomposition index, it can be found that the technical productivity index of Shenzhen maintains a level of 1 at all times, which is the highest level. At the same time, the range productivity index is also at the upstream level of Guangdong Province. It embodies the “catch-up effect” of Shenzhen and the advantages of scope economy, and has strong competitiveness and development potential.
4.3. Comprehensive Analysis
Based on the previous analysis, this paper further constructs the efficiency-total factor productivity growth matrix, and analyzes the competitive development of various cities in Guangdong Province from the aspects of efficiency and total factor productivity index. Efficiency is used to represent the current development
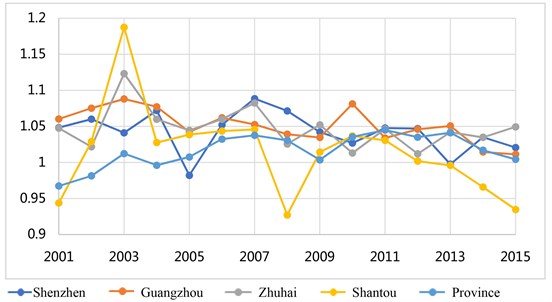
Figure 2. Comparative Analysis of Total Factor Productivity in Guangdong Province, Shenzhen City, Guangzhou City, Zhuhai City, and Shantou City.
status and total factor productivity growth is used to represent the future growth potential. Therefore, this paper divides Guangdong Province’s efficiency and total factor productivity index into H group whose efficiency (total factor productivity) is higher than the average and L group whose efficiency (total factor productivity) is lower than the average. Therefore, each province will be classified into the following squares: 1) H/H square matrix (both the efficiency and total factor productivity index are higher than the average); 2) H/L square matrix (efficiency is higher than average, total factor productivity index is lower than average); 3) L/H square matrix (efficiency is lower than average, total factor productivity index is higher than average); 4) L/L square matrix (both the efficiency and total factor productivity are lower than average).
According to the division above, Table 6 lists the distribution results of the efficiency―total factor productivity index matrix of various cities in Guangdong Province. Shenzhen City, Zhuhai City, Foshan City and Zhongshan City are in the H/H phalanx, indicating that these cities are not only in a relatively high position but also growing rapidly. On the whole, these cities are highly competitive. They should continue to maintain their competitive advantages and develop themselves rapidly. Huizhou City, Dongguan City, Jiangmen City, Maoming City and Zhanjiang City are in the H/L phalanx, these cities are in high positions, but the growth is weak. The risk of being overtaken is high. These cities should maintain their current efficiency advantages and take appropriate measures to enhance their future competitiveness and consolidate their own conditions. Although Guangzhou, Shaoguan City, Heyuan City and Zhaoqing City have poor performance in efficiency, they are outstanding in total factor productivity and have great potential for development. They are likely to enter the H/H group in the future. They should make full use of their current advantages in total factor productivity and improve themselves. In addition, there are 8 cities in the L/L matrix, including Shantou, Meizhou, Shanwei, Yangjiang, Qingyuan, Chaozhou, Jieyang, Yunfu. It shows that both the efficiency and total factor
Table 6. Efficiency―total productivity index matrix.
productivity of these cities are lower than the average level. Not only is the relative position low, but also the growth potential is small. If no measures are taken to improve the total factor productivity, the gap with other cities will be further widened.
5. The Conclusion
This paper takes the cities of Guangdong Province from 2000 to 2015 as the research object, and uses the Hicks-Moorsteen TFP index method to analyze the efficiency and total factor productivity of Guangdong Province. The empirical results show that:
First, during the sample period, the overall efficiency of Guangdong Province showed a trend of rising first and then decreasing. In recent years, it has rebounded. Although the overall level has improved, the efficiency level remains at a medium level, which shows that Guangdong Province has not been able to make better use of resources. From the specific situation of the sub-region, the level of efficiency is closely related to the economic environment and economic vitality of the region. The efficiency of the Pearl River Delta region is obviously superior to that of the non-Pearl River Delta region. Its technological efficiency, scale efficiency and scope efficiency are higher than that of the non-Pearl River Delta region. Further, this paper finds that Shenzhen has increased its efficiency value in 2002-2015 with its development advantages. It has taken the lead in all cities of Guangdong Province in recent years, reflecting its strong competitiveness. Secondly, from decomposition index of efficiency, technical efficiency and range efficiency have increased, while regional scale efficiency has declined.
Second, the total factor productivity of each city has a large fluctuation during the sample period, with an average level of 1.0165%, achieving an average annual growth of 0.38%. The improvement of scale efficiency and range efficiency is the driving force for the promotion of TFP, while the slow technological change is the main reason for the weakening of TFP. To some extent, the slow growth of technological progress has hindered the progress of total factor productivity. Secondly, the TFP level in the Pearl River Delta region has a slight advantage over the non-Pearl River Delta region. Furthermore, Shenzhen maintains a high level of total factor productivity in the whole province while maintaining its efficiency increasing year by year. Regarding to the TFP decomposition index, it can be found that the technical productivity index of Shenzhen has remained at the level of 1 at all times, that is, the highest level. The range productivity index is also at the upstream level of Guangdong Province, which reflects the “catch-up effect” of Shenzhen and the advantages of scope economy.
Thirdly, the analysis of the advantages and disadvantages of Guangdong Province shows that the development of various cities in Guangdong Province is concentrated. Most of the advantages are concentrated in the cities of the Pearl River Delta region, showing a situation of polarization. Such a pattern will not be conducive to Guangdong Province for the improvement of efficiency and total factor productivity. Therefore, the cities need to strive to achieve overall growth of their own efficiency and total factor productivity. Guangdong Province should focus on the effective allocation of resources, achieve rapid and sound regional development, and achieve economies growth of scope and scale. It should also pay attention to the improvement of technology progress and technological efficiency.
Conflicts of Interest
The author declares no conflicts of interest regarding the publication of this paper.
Cite this paper
Miao, J. (2018) Study on Regional Efficiency and Productivity of Guangdong Province―Based on Hicks-Moorsteen TFP Index. Modern Economy, 9, 2164-2180. https://doi.org/10.4236/me.2018.912134
References
- 1. O’Donnell, C.J. (2008) An Aggregate Quantity-Price Framework for Measuring and Decomposing Productivity and Profitability Change. Cepa Working Papers, University of Queensland, Brisbane.
- 2. Solow, R.M. (1957) Technical Change and the Aggregate Production Function. Review of Economics & Statistics, 39, 554-562. https://doi.org/10.2307/1926047
- 3. Farrel, M.J. (1957) The Measurement of Productive Efficiency. Journal of the Royal Statistical Society. Series A (General), 120, 253-290. https://doi.org/10.2307/2343100
- 4. Caves, D.W., Christensen, L.R. and Diewert, W.E. (1982) The Economic Theory of Index Numbers and the Measurement of Input, Output, and Productivity. Econometrica, 50, 1393-1414. https://doi.org/10.2307/1913388
- 5. Charnes, A., Cooper, W.W. and Rhodes, E. (1981) Evaluating Program and Managerial Efficiency: An Application of Data Envelopment Analysis to Program Follow Through. Management Science, 27, 668-697. https://doi.org/10.1287/mnsc.27.6.668
- 6. Fare, R., Grosskopf, S. and Knoxlovell, C.A. (1994) Production Frontiers. Cambridge University Press, Cambridge.
- 7. Li, J.W. and Zhong, X.Y. (1998) Frontiers of China’s Productivity Analysis. Social Sciences Academic Press, Beijing.
- 8. Zhang, J. and Shi, S.H. (2003) Changes in Total Factor Productivity of China’s Economy: 1952-1998. World Economic Papers, No. 2, 17-24.
- 9. Guo, Q.W. and Jia, J.X. (2004) Estimation of Potential Output and Output Gap in China. Economic Research Journal, No. 5, 31-39.
- 10. Li, B. and Zeng, Z.X. (2009) Re-Measurement of China’s Total Factor Productivity Change: 1978-2007. Journal of Quantitative and Technical Economics, No. 3, 3-15.
- 11. Zhang, S.H. and Jiang, W.J. (2014) Re-Measurement and Decomposition of China’s Energy Productivity Based on ISP Index. The Journal of Quantitative & Technical Economics, No. 6, 55-73.
- 12. Yan, P.F. and Wang, B. (2004) Technical Efficiency, Technological Progress and Productivity Growth: An Empirical Analysis Based on DEA. Economic Research Journal, No. 12, 55-65.
- 13. Zheng, J.H. and Hu, A.G. (2005) An Empirical Analysis of the Change of Inter-Provincial Productivity Growth in China during the Reform Period (1979-2001). Economics, Quarterly, 4, 263-296.
- 14. Peng, G.H. (2005) Analysis of Income Gap, Total Factor Productivity and Its Convergence in China. Economic Research Journal, No. 9, 19-29.
- 15. Fu, X.X. and Wu, L.X. (2006) Contribution of Total Factor Productivity to Regional Differences in China: A Discussion with Peng Guohua and Li Jing. World Economy, No. 9, 12-22.
- 16. Li, G., Zhou, C. and Jiang, J. (2010) Estimation of Regional Total Factor Productivity and Its Contribution to Regional Disparity. The Journal of Quantitative & Technical Economics, No. 5, 49-61.
- 17. Tu, Z.-G. and Geng, X. (2005) China’s Industrial Productivity Revolution: Decomposition and Analysis of Total Factor Productivity Growth of China’s Large and Medium-Sized Industrial Enterprises by Stochastic Frontier Production Model. Economic Research Journal, No. 3, 4-15.
- 18. Li, S. and Li, D. (2008) Fluctuation of Total Factor Productivity in China’s Industry: 1986-2005—Analysis of Stochastic Frontier Production Function of Three Inputs Based on Sub-sector. The Journal of Quantitative & Technical Economics, 25, 43-54.
- 19. Cheng, H. and Lu, J. (2014) An Empirical Analysis of the Impact of Intellectual Capital on Total Factor Productivity of Industrial Enterprises. Economic Research Journal, No. 5, 174-187.
- 20. Cai, Y. and Guo, M. (2009) Empirical Analysis of Total Factor Productivity of China’s Listed Commercial Banks. Economic Research Journal, No. 9, 52-65.
- 21. Jiang, Y. and Jiang, W. (2014) Research on Efficiency and Total Factor Productivity of Chinese Listed Commercial Banks—Based on an Analysis Framework of Hicks-Moorsteen TFP Index. China Industrial Economics, No. 9, 109-121.
- 22. Shen, Y. and Guo, P. (2015) Internet Finance, Technology Spillover and Total Factor Productivity of Commercial Banks. Financial Research, No. 3, 160-175.
- 23. Cheng, Y. and Zhang, Y. (2013) An Empirical Analysis of the Differences of Provincial Total Factor Energy Efficiency in China—A Case Study of Guangdong Province. Technology Economics, 32, 56-63.
- 24. Wang, X., Zhai, J., Zeng, W., et al. (2015) The Transformation of Economic Growth Mode in Central Cities from the Perspective of Total Factor Productivity—An Empirical Study Based on Panel Data of 17 Cities in China. Shanghai Journal of Economics, No. 3, 30-39.
- 25. Wang, Y., Chen, C. and Gao, S. (2016) Estimation and Analysis of Total Factor Productivity in Chinese Cities: 2000-2013. On Economic Problems, No. 8, 1-8.