Journal of Biophysical Chemistry
Vol. 3 No. 4 (2012) , Article ID: 25065 , 9 pages DOI:10.4236/jbpc.2012.34043
26S proteasome inhibitors inhibit dexamethasone-dependent increase of tyrosine aminotransferase and tryptophan 2,3-dioxygenase mRNA levels in primary cultured rat hepatocytes
![]()
1Department of Nutrition and Physiology, Nihon University College of Bioresource Sciences, Fujisawa, Japan
2Division of Biological Chemistry and Biologicals, National Institute of Health Sciences, Tokyo, Japan;
*Corresponding Author: niimi@nihs.go.jp
Received 2 September 2012; revised 5 October 2012; accepted 19 October 2012
Keywords: Glucocorticoid; 26S proteasome Inhibitor; Tyrosine Aminotransferase; Tryptophan 2,3-Dioxygenase Genes
ABSTRACT
Dexamethasone (Dex), a ligand for transcriptionnal enhancement of tyrosine aminotransferase (TAT) and tryptophan 2,3-dioxygenase (TO) genes, (100 nM) maximally increased these mRNA levels at 12 h and 7 h in primary cultured rat hepatocytes and the nuclear fraction, respectively. Lactacystin (5 μM) and epoxomicin (0.5 μM), 26S proteasome inhibitors, significantly suppressed the Dex-dependent maximum increase of TAT and TO mRNA levels in the cells and the nuclear fraction. Electrophoretic mobility shift assay demonstrated that lactacystin did not affect binding of glucocorticoid receptor to glucocorticoid responsive element. Furthermore, lactacystin did not affect the activation of GRE luciferase reporter by Dex transfected to the cells. The results demonstrate that 26S proteasome is positively involved in the Dex-dependent increase of TAT and TO mRNA levels in the cells and suggest that the mechanism of action of 26S proteasome may be degradation of some RNase(s), which breaks down TAT and TO mRNAs.
1. INTRODUCTION
Glucocorticoids stimulate transcription of target genes [1], including tyrosine aminotransferase (TAT) [2,3] and tryptophan 2,3-dioxygenase (TO) [4,5], by activating glucocorticoid receptor (GR). Activation of GR by glucocorticoids is a multiple-step process that involves the ability of GR to recognize and bind to glucocorticoids, to undergo glucocorticoid-dependent structural transformation, and to translocate into the nucleus, where it binds to specific DNA sequences, glucocorticoid response elements, which are associated with target genes [6,7].
Several findings indicate that 26S proteasome might suppress or stimulate GR-mediated transcriptional activation, as follows: 26S proteasome inhibition increases GR-mediated transcriptional activation by inhibiting proteolysis of GR [8,9], modifying histone and increaseing phosphorylated form of RNA polymerase II [10], stabilizing the binding of GR to the promoter [11], and reducing the mobility of the GR within the nucleus [8]. 26S proteasome degrades Stat3 [12,13] and GRIP-1 [14], the co-activators of GR-mediated transcriptional activetion [15,16]. On the other hand, 26S proteasome degrades c-fos and c-jun [17-19], the co-repressors of GR-mediated transcriptional activation [20-22].
There is one report showing that proteasome inhibitors block the degradation of RNase L caused by phorbor- 12-myristate-13-acetae in mouse L929 cells, suggesting that degradation of target mRNA may be stimulated by proteasome inhibitors [23].
TAT and TO genes are typical of genes for which transcription is enhanced by glucocorticoids. TAT and TO are also the main enzymes involved in gluconeogenesis in rat liver in vivo [24-26]. Primary cultured rat hepatocytes are a suitable model system for investigation of the physiological functions of 26S proteasome in rat liver in vivo [27-31].
In the present study, weinvestigated the effects of 26S proteasome on the dexamethasone (Dex)-dependent increase of TAT and TO mRNA levels using lactacystin and epoxomicin, 26S proteasome inhibitors, in primary cultured rat hepatocytes.
2. MATERIALS AND METHODS
2.1. Materials
Lactacystin was purchased from Kyowa Medical (Tokyo, Japan). Epoxomicin was purchased from Peptide Institute (Osaka, Japan).
2.2. Cell Isolation and Monolayer Cultures
Parenchymal hepatocytes were isolated from adult male Wistar rats, weighing 180 - 200 g, by in situ perfusion of the liver with collagenase [32]. All animal care and procedure protocols were approved by the care committee of national institute of health sciences. Hepatocytes were suspended at a density of 5 × 10⁵ cells/mL in Williams’ medium E containing 5% fetal bovine serum, 1 nM insulin, 30 μg/mL kanamycin sulfate, and 1 μg/mL aprotinin, and cultured at a density of 1 ×10⁵ cells/cm2 in a 10-cm dish precoated with collagen type-1 AC in a humidified chamber at 37˚C with 5% CO2 and 30% O2 air. After 2.5 h, the medium was replaced by hormone-free medium containing aprotinin (1 μg/mL), lactacystin (5 μM), epoxomicin (0.5 μM), and Dex (100 nM), were added to hormone-free medium and the cells were further cultured for various periods.
2.3. Total RNA Extraction
At 2.5 h after the plating, the medium was replaced by hormone-free medium containing aprotinin (1 μg/mL) in the presence or absence of lactacystin orepoxomicin. After 2 h, the cells were cultured in the presence or absence of Dex without changing the medium at the indicated time. Total RNA was extracted from cells or nuclear fractions using Trizol® reagent (Invitrogen, Cergy Pontoise, France) in accordance with the manufacturer’s protocol.
2.4. Isolation of Nuclear Fraction for Total RNA Isolation
At 2.5 h after the plating, the medium was replaced by hormone-free medium containing aprotinin (1 μg/mL) in the presence or absence of lactacystin. After 2 h, the cells were cultured in the presence or absence of Dex without changing the medium at the indicated time. Nuclear fractions were isolated from approximately 15 × 106 cells using Nuclei EZ PREP Nuclei Isolation kit (SigmaAldrich, St. Louis, Mo.) in accordance with the manufacturer’s protocol.
2.5. Real-Time Quantitative PCR
An equal amount of RNA (approximately 1 μg) in each experiment was reverse-transcribed using a Thermoscript™ RT-PCR System (Invitrogen, Cergy Pontoise, France) and oligo (dT)20 in a final volume of 40 μL, in accordance with the manufacturer’s protocol. Subsequently, 2 μL of cDNA was used as a template for realtime PCR analysis in a Light Cycler system (Roche Applied Science, Mannheim, Germany), in accordance with the manufacturer’s instructions. For TAT-1, TO-1 and 28S rRNA, the PCR program consisted of 40 cycles of 10 s at 94˚C, 10 s at 60˚C, and 12 s at 72˚C; for TAT-2, of 40 cycles of 10 s at 94˚C, 10 s at 60˚C, and 6 s at 72˚C; and for TO-2, of 40 cycles of 10 s at 94˚C, 10 s at 60˚C, and 6 s at 72˚C. The primer sequences of TAT-1 were 5’-TAC TCA GTT CTG CTG GAG CC-3’ and 5’-GCA AAG TCT CTA GAG AGG CC-3’ [33], those of TO-1 were 5’-AGA GTA CCT GTC TCC AGC AT-3’ and 5’-ACC AGG TAC GAT GAG AGG TT-3’, those of 28S rRNA were 5’-CCA GAG CGA AAG CAT TTG CCA-3’ and 5’-GGC ATC ACA GAC CTG TTA TTG CTC-3’, [34] those of TAT-2 were 5’ -CGA GAG GCA TGG ACT CCT AC-3’ and 5’-GGA CAT GTC AGA GGG TCT CA-3’, and those of TO-2 were 5’-TGG GAA CTT GAT TCT GTT CGT GAG-3’ and 5’-TCC AAG GCA GTC ATT GTT TCC A-3’. TAT-1 and TO-1 primers were used for total RNA extracted from the cells. TAT-2 and TO-2 primer were used for total RNA extracted from the nuclear fraction. TAT and TO levels were normalized to the levels of 28S rRNA.
2.6. Isolation of Nuclear Fraction for Electrophoretic Mobility Assay
At 2.5 h after the plating, the medium was replaced by hormone-free medium containing aprotinin (1 μg/mL) in the presence or absence of lactacystin (5 μM). After 2 h, Dex (100 nM) was added to the culture medium without changing the medium. The cells were cultured for 1h, and then nuclear fractions were prepared from approximately 5 × 10⁶ cells using NE-PER® Nuclear and cytoplasmic Extraction Reagents (Thermo Fisher Scientific, Waltham, MA, U.S.A.) in accordance with the manufacturer’s protocol.
2.7. Electrophoretic Mobility Shift Assay
Electrophoretic mobility assay was performed using the Light Shift® Chemiluminescent EMSA Kit (Thermo Fisher Scientific, Waltham, MA, U.S.A.) in accordance with the manufacturer’s protocol. GR probe is composed of a double-stranded DNA oligo with biotin labeling. The sequences of GR probe were 5’-AGG ATC TGT ACA GGA TGT TCT AGA TCC AAT-3’ and 5’-ATT GGA TCT AGA ACA TCC TGT ACA GAT CCT-3’. The product information shows the GR probe contains a DNA consensus sequence that binds to GR. Equal amounts of protein (approximately 2.5 μg) from each nuclear extract were incubated at room temperature for 20 min in 1X binding buffer (10 mM Tris, 50 mM KCl, 1 mM DTT, pH7.5, 2.5% Glycerol, 5 mM MgCl2, 0.05% NP-40, 50 ng Poly (dI-dC)) plus 2 pmol of GR probe labeled with biotin (GP-0019) (Signosis, Sunnyvale, CA, U.S.A.) in the presence or absence of 10 ng of competitor DNA in a final volume of 20 μL. Samples were loaded onto a prerun 5% (w/v) nondenaturing acrylamide gel (Bio-Rad, Hercules, CA, U.S.A.) in 0.5X TBE, electorophoresed for 35 min at 100 V, and electroblotted to an Amersham Hybond™-N+ (GE Healthcare, Chalfront St. Giles, UK) for 30 min at 380 mA (~100 V). The membrane was cross-linked for 10 min at 254 nm, and dried. Detection was performed using a Chemiluminescent Nucleic Acid Detection Module (Thermo Fisher Scientific, Waltham, MA, U.S.A.). Competitor DNA was synthesized by Hokkaido Bio System Co., Ltd. (Hokkaido, Japan). The sequences of the competitor DNA were the same as those for GR probe described above. 5’-AGG ATC TGT ACA GGA TGT TCT AGA TCC AAT-3’ and 5’-ATT GGA TCT AGA ACA TCC TGT ACA GAT CCT-3’. Recombinant GR protein (5.2 mg/mL), a component of Glucocorticoid Receptor Kit (Abcam, Cambridge, UK) was used as a positive control. Nuclear protein concentration was measured using the Bradford method (Bio-Rad, Hercules, CA, U.S.A.).
2.8. Western Blot Analysis of Albumin
Cytosol was prepared from approximately 5 × 10⁶ cellsin the final volume of 0.2 mL, as follows: Cells were washed with ice-cold PBS after 2.5 h of culture, harvested with a rubber policeman, suspended 20 times, sonicated 4 times for 15 s each, and centrifuged at 100,000 ´ g for 1 h. Nuclear fractions were isolated from approximately 5 × 10⁶ cells at the final volume of 0.2 mL by various procedures as described above. Fifteen microliters of each nuclear extract and cytosol were subjected to sodium dodecyl sulfate-polyacrylamide gel electrophoresis on a 7.5% gel and electroblotted to a PVDF membrane (GVHP; Millipore, Billerica, MA, U.S.A.). After blocking the membrane with 5% skimmed milk, Western blot analyses were performed using anti-albumin antibody (Cappel, Aurora, OH, U.S.A.). Detection was performed using an ECL detection system (Amersham Biosciences, Piscataway, NJ, U.S.A.).
2.9. Luciferase Assay
Cells (7.21 × 10⁴) were seeded in a 48-well tissue culture plate and prepared following the methods described above. After 2.5 h, the cells were washed two times with 100 μL of kanamycin, serum, and hormone-free WE. The medium was replaced by 100 μL of kanamycin, serum, and hormone-free WE containing aprotinin (1 μg/mL). Transient transfection of luciferase reporter plasmids pGL4.36 (Promega, Madison, WI, U.S.A.) was performed using 2 μg of the plasmids and Lipofectamine (Life Technologies Japan Ltd., Tokyo, Japan) in accordance with the protocol recommended by the manufacturer. After 18 h of culture, the medium was replaced with 90 μL of the medium in the presence or absence of lactacystin (5.55 μM). After 2 h, 10 μL of fresh medium in the presence or absence of Dex (1 μM) was added to the cells. After 24 h, luciferase assays were performed using the Pica Gene Dual Sea Pansy Luminescence kit (Toyo ink CO., Ltd., Tokyo, Japan) in accordance with the manufacture’s protocols. For protein measurement, similarly prepared cells were lysed with 100 μL of 1N NaOH instead of cell lysis buffer provided with the kit at 37˚C for 1 h, to avoid interference of the lysis buffer with the protein assay. Cell protein concentration was measured using the Lowry method (Bio-Rad, Hercules, CA, U.S.A.). Luciferase activity was expressed as relative light intensity per milligram of protein.
2.10. Statistical Analysis
Data were analyzed using Student’s t-test and p-values less than 0.05 were considered to be statistically significant.
3. RESULTS
3.1. Effect of Lactacystin and Epoxomicin on Dex-Dependent Increase of TAT and TO MRNA Levels in the Cells
Time courses of increase of TAT and TO mRNA levels by Dex showed that the increase of TAT and TO mRNA levels reached maximal levels; 9.8-fold and 130-fold after 12 h, respectively (Figures 1(a) and (b)). TAT and TO mRNA levels decreased gradually after 12 h.
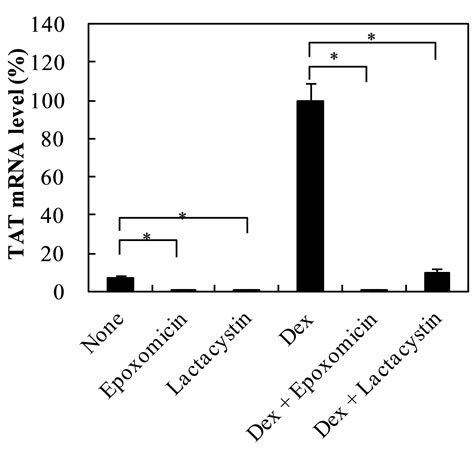
Lactacystin and epoxomicin inhibited Dex-dependent increase of TAT mRNA level at 12 h by approximately 90% and 99%, respectively (Figure 2(a)). Similarly, lactacystin and epoxomicin inhibited the control mRNA level by approximately 90%. Lactacystin and epoxomicin inhibited Dex-dependent increase of TO mRNA level by approximately 90% (Figure 2(b)). The control level was inhibited by lactacystin, but not by epoxomicin. These findings indicate that inhibition of Dex-dependent increase of TAT and TO mRNA levels was common to 26S proteasome inhibitors, but not specific to a certain 26S proteasome inhibitor. Based on these findings, lactacystin was used in the following experiments. Lactacystin or epoxomicin was routinely added at 2h before adding Dex, because preliminary results showed that the addition of lactacystin at 0 h or 2 h before the addition of Dex inhibited Dex-dependent increase of TAT activity by 64% or 75%, respectively, suggesting that the prior addition of lactacystin or epoxomicin at 2 h may more effi-
 (a)
(a)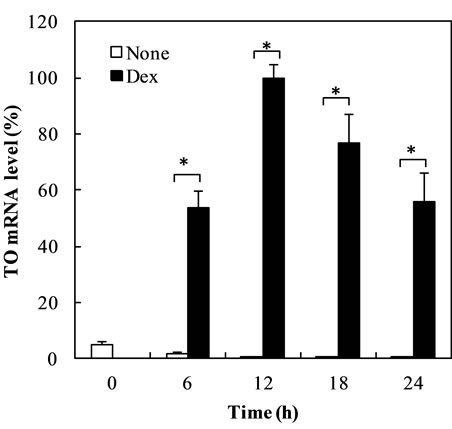 (b)
(b)
Figure 1. Time course of Dex-dependent increase of TAT and TO mRNA in the cells. (a) and (b) show the time course of Dex-dependent Increase of TAT and TO mRNA in the cells, respectively. The data are expressed as the mean ±S.D. of 3 independent experiments, using triplicate dishes in each experiment. The results are shown relative to the value produced by hepatocytes cultured for 12 h in the presence of Dex. *p < 0.01, compared with the value by hepatocytes cultured in the absence or presence of Dex.
ciently inhibit Dex-dependent increase of TAT and TO mRNA levels than that at 0 h before the addition. The morphologies of the cells were not different from each other in the presence or absence of these inhibitors based on microscopic observation (data not shown), suggesting that the suppression of Dex-dependent increase of TAT and TO mRNA levels by these inhibitors was not due to their cytotoxicity to the cells.
3.2. Effect of Lactacystin on Dex-Dependent Increase of TAT and TO MRNA Levels in the Nuclear Fraction
Dex-dependent increase of TAT mRNA level was
 (a)
(a) (b)
(b)
Figure 2. Effect of lactacystin and epoxomicin on Dex-dependent increase of TAT and TO mRNA levels in the cells. (a) shows the effect of lactacystin and epoxomicin on Dex-dependent increase of TAT mRNA level in the cells; (b) shows the effect of lactacystin and epoxomicin on Dex-dependent increase of TO mRNA level in the cells. The data are expressed as the mean ±S.D. of 3 independent experiments, using triplicate dishes in each experiment. The results are shown relative to the value produced by hepatocytes cultured in the presence of Dex. *p < 0.01, **p < 0.05, compared with the value by hepatocytes cultured in the absence or presence of Dex.
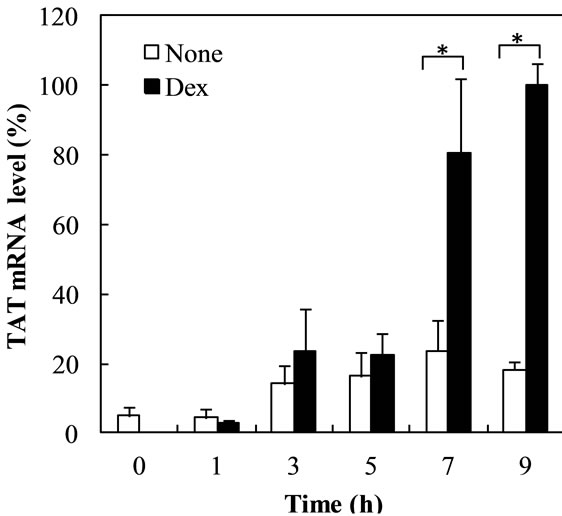
shown at 7 h, reaching approximately 3-fold (Figure 3(a)). TO mRNA level started to increase at 1 h, reaching 126-fold at 7h (Figure 3(b)).
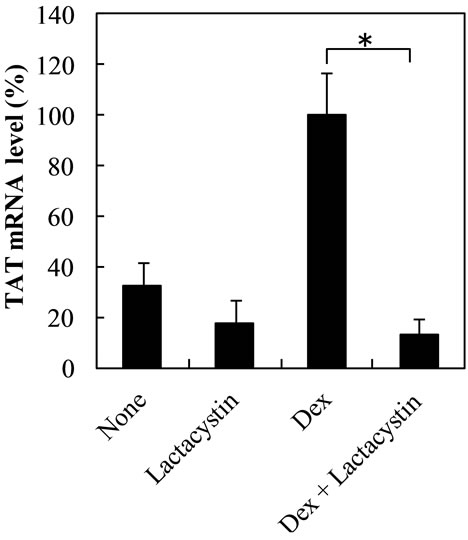
Lactacystin inhibited Dex-dependent increase of TAT and TO mRNA levels at 7 h by the level in lactacystin-treated cells and 60%, respectively, but did not affect the control levels (Figures 4(a) and (b)).The increase of TO mRNA level by Dex at earlier time points may more probably reflect the enhancement of transcription of TO gene by Dex. The result at 3 h showed that lactacystin did not affect Dex-dependent increase of TO mRNA levels or control levels at 3 h (Figure 5).On the other hand, the effect of lactacystin on TAT mRNA levels in Dextreated cells was not evaluated at 3 h, because Dex did not in crease TAT mRNA level until 6 h.
 (a)
(a) (b)
(b)
Figure 3. Time course of Dex-dependent increase of TAT and TO mRNA Levels in the nuclear fraction. Figures 3(a) and (b) show the time course of Dex-dependent increase of TAT and TO mRNA levels in the cells, respectively. The data are expressed as the mean ±S.D. of 3 independent experiments, using triplicate dishes in each experiment. The results are shown relative to the value produced by hepatocytes cultured for 9 h in the presence of Dex. *p < 0.01, **p < 0.05, compared with the value by hepatocytes cultured in the presence of Dex at each time point.
 (a)
(a) (b)
(b)
Figure 4. Effect of lactacystin on Dex-dependent increase of TAT and TO mRNA levels at 7 h in the nuclear fraction. Figures 4(a) and (b) show the effect of lactacystin on Dex-dependent increase of TAT and TO mRNA levels in the nuclear fraction, respectively. The data are expressed as the mean ±S.D. of 3 independent experiments, using triplicate dishes in each experiment. The results are shown relative to the value produced by hepatocytes cultured in the presence of Dex. *p < 0.01, compared with the value by hepatocytes cultured in the presence of Dex.
3.3. Effect of Lactacystin on GR Binding to Glucocorticoid Responsive Element in Nuclear Fraction
The results of electrophoretic mobility shift assay showed that GR-glucocorticoid responsive element (GRE) complex was formed between GR in the nuclear extract prepared from Dex-treated cells and GRE, because the band was detected at the same position in the positive control using GR (Figure 6, Lanes 1, 6). The specificity was confirmed by the disappearance in the presence of competitor DNA (Figure 6, Lanes 1-4). Lactacystin did not affect the intensity or position of GR-GRE complex (Figure 6, Lanes 1, 3).The observed non specific bands probably show the non specific complexes composing of GRE and some proteins other than GR.
3.4. Western Blot Analysis of Albumin in the Nuclear Fraction
The verification of the nuclear fraction preparations was performed by measuring the contamination of albumin. Albumin was detected at the position of its molecular weight of 63 kDa in the cytosolic fraction used as the positive control, but not detected in the nuclear fractions prepared for RT-PCR and electrophoretic mobility assay (Figure 7).
3.5. Effect of Lactacystin on GRE Promoter Activity in the Cells
Dex increased GRE luciferase reporter activation by approximately 9-fold. Lactacystin did not affect the activation of GRE luciferase reporter by Dex or the control levels (Figure 8).
4. DISCUSSION
The present study showed that lactacystin and epoxomicin inhibit Dex-dependent increase of TAT and TO
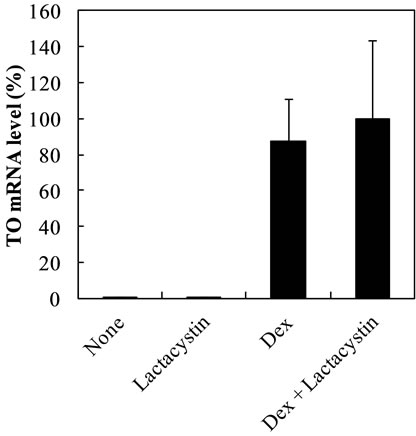
Figure 5. Effect of laactacystin on Dex-dependent increase of TO mRNA level at 3 h in the nuclear fraction. The data are expressed as the mean ± S.D. of 3 independent experiments, using triplicate dishes in each experiment. The results are shown relative to the value produced by hepatocytes cultured for 3 h in the presence of Dex.
mRNA levels in primary cultured rat hepatocytes, demonstrating that 26S proteasome is positively in volved

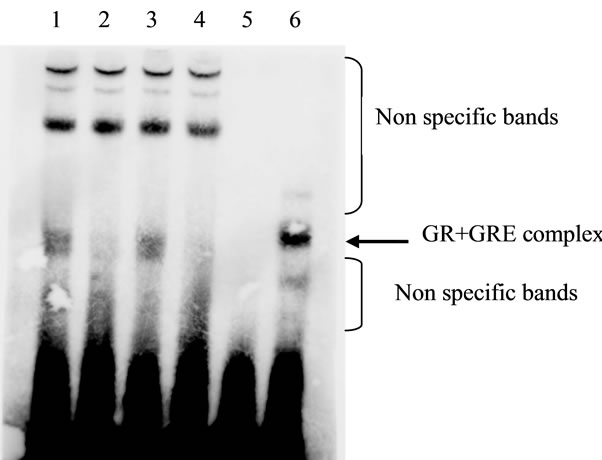
Figure 6. Effect of lactacystin on GR binding to GRE in nuclear Fraction using electrophoretic mobility assay. The data shown are representative electrophoretic mobility assay results. Similar results were obtained from three independent experiments. Lanes 1-2, nuclear extract prepared from the cells treated with Dex; Lanes 3-4, nuclear extract prepared from the cells treated with Dex and lactacystin; Lane 5, no addition; Lane 6, recombinant GR protein.
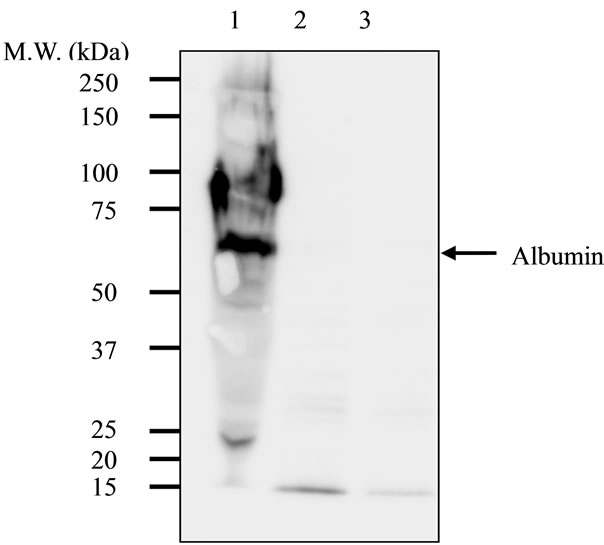
Figure 7. Western blot analysis of albumin in the nuclear fraction. The data shown are representative Western blot analysis results. Similar results were obtained from three independent experiments. Lane 1, cytosol as the positive control; Lane 2, nuclear extract prepared for RT-PCR; Lane 3, nuclear extract prepared for electrophoretic mobility assay.

Figure 8. Effect of lactacystin on Dex-dependent induction of GRE reporter luciferase activity in the cells. The data are expressed as the mean ± S.D. of 3 independent experiments, using triplicate wells in each experiment.
in the Dex-dependent increase of mRNA levels of TAT and TO, the main gluconeogenic enzymes.
Attempt was made to confirm the Dex-dependent enhancement of transcription of TAT and TO genes reported by others [2-5] using nuclear run-on assay [35] as the first step to investigate the effect of lactacystin on Dex-dependent enhancement of TAT and TO gene transcription. However, the enhancement was not reproducebly confirmed, and therefore the effect of lactacystin could not be investigated. The principle of the method for measuring transcription rate is based on the incorporation of biotin-labeled nucleotide in the transcript followed by its amplification by real time RT-PCR. It is probable that the time at which the transcriptional enhancement initiates reproducibly could not be established by our methods.
Instead, we measured the mRNA level in the nuclear fraction, because mRNA in the nuclei is relatively insusceptible to the regulation of its stability compared with that in the cytosol [36], and therefore the measurement of mRNA level at the appropriate time point in the nuclear fraction seems to more accurately reflect the transcripttion rate compared with that in the cells. Lactacystin also inhibited Dex-dependent increase of TAT and TO mRNA levels in the nuclear faction at 7 h, at which time the increase reached maximum. Stimulation of transcription of the TO gene by Dex in primary rat hepatocytes cultured for 2 h reached maximum at 2 h and then gradually decreased [5]. Therefore, the increase of TO mRNA level at 3 h may reflect the mRNA synthesized by the maximal transcriptional enhancement at 2 h. Lactacystin did not affect the increase of TO mRNA level at 3 h. The results suggest that lactacystin may not affect the enhancement of transcription by Dex. The mRNA at 3 h is that synthesized immediately after the transcriptional enhancement by Dex. Therefore, the degradation by some RNase(s) may have not have begun yet at 3 h. On the other hand, the inhibition of Dex-dependent increase of TO mRNA level by lactacystin at 7 h may have been caused by the subsequent degradation of the accumulated TO mRNA by some RNase(s). There is a report that proteasome inhibitors block the degradation of RNase L, as described in introduction[23]. However, it is uncertain whether the targets of RNase L were TAT and TO mRNA.
We further investigated the effect of lactacystin on GR binding to GRE in the nuclear fraction and GRE promoter activity in the cells. The results of electrophoretic mobility shift assay showed that lactacystin did not affect the intensity or position of GR-GRE complex in the nuclear fraction prepared from Dex-treated cells, indicating that lactacystin did not affect the GR-GRE interaction. Furthermore, lactacystin did not affect the activation of GRE luciferase reporter by Dex, suggesting that lactacystin may not affect the transcriptional enhancement of TO and TAT genes by Dex, as in the case of GRE luciferase reporter.
In the present study, we focused on the increases of TAT and TO mRNA levels by Dex as the target of the proteasome inhibitors, as described in Introduction. Whether increases of other mRNA levels by Dex are suppressed by the proteasome inhibitors in primary cultured hepatocytes is an issue for further investigation.
In conclusion, the present findings demonstrate that 26S proteasome is positively involved in the Dex-dependent increase of TAT and TO mRNA levels in primary cultured rat hepatocytes.
REFERENCES
- Beato, M., Truss, M. and Chavez, S. (1996) Control of transcription by steroid hormones. Annals of the New York Academy of Sciences, 784, 93-123. doi:10.1111/j.1749-6632.1996.tb16231.x
- Schmid, E., Schmid, W., Jantzen, M., Mayer, D., Jastorff, B. and Schutz, G. (1987) Transcription activation of the tyrosine aminotransferase gene by glucocorticoids and cAMP in primary hepatocytes. European Journal of Biochemistry, 165, 499-506. doi:10.1111/j.1432-1033.1987.tb11467.x
- Cake, M.H., Ho, K.K., Shelly, L., Milward, E. and Yeoh, G.C. (1989) Insulin antagonism of dexamethasone induction of tyrosine aminotransferase in cultured fetal hepatocytes. A correlation between enzyme activity, synthesis, level of messenger RNA and transcription. European Journal of Biochemistry, 182, 429-435. doi:10.1111/j.1432-1033.1989.tb14849.x
- Danesch, U., Hashimoto, S., Renkawitz, R., Schutz, G. (1983) Transcriptional regulation of the tryptophan oxygenase gene in rat liver by glucocorticoids. The Journal of Biological Chemistry, 258, 4750-4753.
- Nakamura, T., Niimi, S., Nawa, K., Noda, C., Ichihara, A., Takagi, Y., Anai, M. and Sakaki, Y. (1987) Multihormonal regulation of transcription of the tryptophan 2,3-dioxygenase gene in primary cultures of adult rat hepatocytes with special reference to the presence of a transcriptional protein mediating the action of glucocorticoids. Journal of Biological Chemistry, 262, 727-733.
- Zilliacus, J., Wright, A.P., Carlstedt-Duke, J. and Gustafsson, J.A. (1995) Structural determinants of DNAbinding specificity by steroid receptors. Molecular Endocrinology, 9, 389-400. doi:10.1210/me.9.4.389
- Newton, R. (2000) Molecular mechanisms of glucocorticoid action: What is important? Thorax, 55, 603-613. doi:10.1136/thorax.55.7.603
- Deroo, B.J., Rentsch, C., Sampath, S., Young, J., DeFranco, D.B. and Archer, T.K. (2002) Proteasomal inhibition enhances glucocorticoid receptor transactivation and alters its subnuclear trafficking. Molecular and Cellular Biology, 22, 4113-4123. doi:10.1128/MCB.22.12.4113-4123.2002
- Wallace, A.D. and Cidlowski, J.A. (2001) Proteasomemediated glucocorticoid receptor degradation restricts transcriptional signaling by glucocorticoids. The Journal of Biological Chemistry, 276, 42714-42721.
- Kinyamu, H.K. and Archer, T.K. (2007) Proteasome activity modulates chromatin modifications and RNA polymerase II phosphorylation to enhance glucocorticoid receptor-mediated transcription. Molecular and Cellular Biology, 27, 4891-4904. doi:10.1128/MCB.02162-06
- Stavreva, D.A., Muller, W.G., Hager, G.L., Smith, C.L. and McNally, J.G. (2004) Rapid glucocorticoid receptor exchange at a promoter is coupled to transcription and regulated by chaperones and proteasomes. Molecular and Cellular Biology, 24, 2682-2697. doi:10.1128/MCB.24.7.2682-2697.2004
- Daino, H., Matsumura, I., Takada, K., Odajima, J., Tanaka, H., Ueda, S., Shibayama, H., Ikeda, H., Hibi, M., Machii, T., Hirano, T. and Kanakura, Y. (2000) Induction of apoptosis by extracellular ubiquitin in human hematopoietic cells: Possible involvement of STAT3 degradation by proteasome pathway in interleukin 6-dependent hematopoietic cells. Blood, 95, 2577-2585.
- Malek, R.L. and Halvorsen, S.W. (1999) Ciliary neurotrophic factor and phorbol ester each decrease selected STAT3 pools in neuroblastoma cells by proteasome-dependent mechanisms. Cytokine, 11, 192-199. doi:10.1006/cyto.1998.0421
- Baumann, C.T., Ma, H., Wolford, R., Reyes, J.C., Maruvada, P., Lim, C., Yen, P.M., Stallcup, M.R., Hager, G.L. (2001) The glucocorticoid receptor interacting protein 1 (GRIP1) localizes in discrete nuclear foci that associate with ND10 bodies and are enriched in components of the 26S proteasome. Molecular Endocrinology, 15, 485-500. doi:10.1210/me.15.4.485
- Zhang, Z., Jones, S., Hagood, J.S., Fuentes, N.L. and Fuller, G.M. (1997) STAT3 acts as a co-activator of glucocorticoid receptor signaling. The Journal of Biological Chemistry, 272, 30607-30610. doi:10.1074/jbc.272.49.30607
- Hong, H., Kohli, K., Trivedi, A., Johnson, D.L. and Stallcup, M.R. (1996) GRIP1, a novel mouse protein that serves as a transcriptional co-activator in yeast for the hormone binding domains of steroid receptors. Proceedings of the National Academy of Sciences of the USA, 93, 4948-4952. doi:10.1073/pnas.93.10.4948
- Hermida-Matsumoto, M.L., Chock, P.B., Curran, T. and Yang, D.C. (1996) Ubiquitinylation of transcription factors c-Jun and c-Fos using reconstituted ubiquitinylating enzymes. The Journal of Biological Chemistry, 271, 4930-4936. doi:10.1074/jbc.271.9.4930
- Stancovski, I., Gonen, H., Orian, A., Schwartz, A.L., Ciechanover, A. (1995) Degradation of the protooncogene product c-Fos by the ubiquitin proteolytic system in vivo and in vitro: Identification and characterization of the conjugating enzymes. Molecular and Cellular Biology, 15, 7106-7116.
- Tsurumi, C., Ishida, N., Tamura, T., Kakizuka, A., Nishida, E., Okumura, E., Kishimoto, T., Inagaki, M., Okazaki, K., Sagata, N., Ichihara, A. and Tanaka, K. (1995) Degradation of c-Fos by the 26S proteasome is accelerated by c-Jun and multiple protein kinases. Molecular and Cellular Biology, 15, 5682-5687.
- Jonat, C., Rahmsdorf, H.J., Park, K.K., Cato, A.C., Gebel, S., Ponta, H. and Herrlich, P. (1990) Antitumor promotion and antiinflammation: Down-modulation of AP-1 (Fos/Jun) activity by glucocorticoid hormone. Cell, 62, 1189-1204. doi:10.1016/0092-8674(90)90395-U
- Yang-Yen, H.F., Chambard, J.C., Sun, Y.L., Smeal, T., Schmidt, T.J., Drouin, J. and Karin, M. (1990) Transcriptional interference between c-Jun and the glucocorticoid receptor: Mutual inhibition of DNA binding due to direct protein-protein interaction, Cell, 62, 1205-1215. doi:10.1016/0092-8674(90)90396-V
- Schule, R., Rangarajan, P., Kliewer, S., Ransone, L.J., Bolado, J., Yang, N., Verma, I.M. and Evans, R.M. (1990) Functional antagonism between oncoprotein c-Jun and the glucocorticoid receptor, Cell, 62, 1217-1226. doi:10.1016/0092-8674(90)90397-W
- Chase, B.I., Zhou Y.X., Xiang Y., Silverman R. and Zhou A. (2003) Proteasome-mediated degradation of RNase L in response to phorbol-12-myristate-13-acetate (PMA) treatment of mouse L929 cells. Journal of Interferon & Cytokine Research, 23, 565-573. doi:10.1089/107999003322485062
- Badawy, A.A. (1977) The functions and regulation of tryptophan pyrrolase. Life sciences, 21, 755-768. doi:10.1016/0024-3205(77)90402-7
- Dunn, A., Chenoweth, M. and Hemington, J.G. (1971) The relationship of adrenal glucocorticoids to transaminase activity and gluconeogenesis in the intact rat. Biochimica et Biophysica Acta (BBA)—General Subjects, 237, 192-202. doi:10.1016/0304-4165(71)90311-4
- Uwiler, A., Wetterberg, L. and Geller, E. (1970) Alterations in induction of tyrosine aminotransferase and tryptophan oxygenase by glucose pretreatment. Biochimica et Biophysica Acta (BBA)—General Subjects, 208, 428-433. doi:10.1016/0304-4165(70)90215-1
- Acharya, P., Engel, J.C. and Correia, M.A. (2009) Hepatic CYP3A suppression by high concentrations of proteasomal inhibitors: A consequence of endoplasmic reticulum (ER) stress induction, activation of RNA-dependent protein kinase-like ER-bound eukaryotic initiation factor 2alpha (eIF2alpha)-kinase (PERK) and general control nonderep-ressible-2 eIF2alpha kinase (GCN2), and global transla-tional shutoff. Molecular Pharmacology, 76, 503-515. doi:10.1124/mol.109.056002
- Acharya, P., Liao, M., Engel, J.C. and Correia, M.A. (2011) Liver cytochrome P450 3A endoplasmic reticulum-associated degradation: A major role for the p97 AAA ATPase in cytochrome P450 3A extraction into the cytosol. The Journal of Biological Chemistry, 286, 3815-3828. doi:10.1074/jbc.M110.186981
- Dominy Jr., J.E., Hirschberger, L.L., Coloso, R.M. and Sti-panuk, M.H. (2006) Regulation of cysteine dioxygenase degradation is mediated by intracellular cysteine levels and the ubiquitin-26S proteasome system in the living rat. Biochemical Journal, 394, 267-273. doi:10.1042/BJ20051510
- Faouzi, S., Medzihradszky, K.F., Hefner, C., Maher, J.J. and Correia, M.A. (2007) Characterization of the physiological turnover of native and inactivated cytochromes P450 3A in cultured rat hepatocytes: A role for the cytosolic AAA ATPase p97? Biochemistry, 46, 7793-7803. doi:10.1021/bi700340n
- Stipanuk, M.H., Hirschberger, L.L., Londono, M.P., Cresenzi, C.L. and Yu, A.F. (2004) The ubiquitin-proteasome system is responsible for cysteine-responsive regulation of cysteine dioxygenase concentration in liver. American Journal of Physiology—Endocrinology and Metabolism, 286, E439-E448. doi:10.1152/ajpendo.00336.2003
- Tanaka, K., Sato, M., Tomita, Y. and Ichihara, A. (1978) Biochemical studies on liver functions in primary cultured hepatocytes of adult rats. I. Hormonal effects on cell viability and protein synthesis. The Journal of Biological Chemistry, 84, 937-946.
- Gordon, G.J., Coleman, W.B. and Grisham, J.W. (2000) Temporal analysis of hepatocyte differentiation by small hepatocyte-like progenitor cells during liver regeneration in retrorsine-exposed rats. American Journal of Pathology, 157, 771-786. doi:10.1016/S0002-9440(10)64591-9
- Harashima, M., Harada, K., Ito, Y., Hyuga, M., Seki, T., Ariga, T., Yamaguchi, T. and Niimi, S. (2008) Annexin A3 expression increases in hepatocytes and is regulated by hepatocyte growth factor in rat liver regeneration. The Journal of Biological Chemistry, 143, 537-545. doi:10.1093/jb/mvm248
- Patrone, G., Puppo, F., Cusano, R., Scaranari, M., Ceccherini, I., Puliti, A. and Ravazzolo, R. (2000) Nuclear run-on assay using biotin labeling, magnetic bead capture and analysis by fluorescence-based RT-PCR. Biotechniques, 29, 1012-1014, 1016-1017.
- Kren, B.T. and Steer, C.J. (1996) Posttranscriptional regulation of gene expression in liver regeneration: Role of mRNA stability. The FASEB Journal, 10, 559-573.