Psychology
Vol.5 No.10(2014), Article ID:48880,7 pages
DOI:10.4236/psych.2014.510139
Validation of the Greek Version of Perceived Stress Questionnaire: Psychometric Properties and Factor Structure in a Population-Based Survey
Eva Karatza1*, Dimitra Kourou1*#, Michael Galanakis2, Liza Varvogli1, Christina Darviri1
1Postgraduate Course Stress Management and Health Promotion, School of Medicine, University of Athens, Athens, Greece
2Department of Psychology, Panteion University of Social and Political Sciences, Athens, Greece
Email: #kourou_d@hotmail.com
Copyright © 2014 by authors and Scientific Research Publishing Inc.
This work is licensed under the Creative Commons Attribution International License (CC BY).
http://creativecommons.org/licenses/by/4.0/


Received 12 May 2014; revised 8 June 2014; accepted 1 July 2014
Abstract
Perceived Stress Scale (PSQ) adaptation is a measuring tool of perceived stress and evaluation of its psychometric properties, on a population-based survey (Greece). Sample N = 1318 of people has anonymously completed the PSQ, comparing it to the Perceived Stress Scale (PSS) and Depressive, Anxiety and Stress Scale (DASS-21). The factor analysis, has shown that the PSQ includes five main factors (Overload, Worries, Joy, Tension/Fatigue, Harassment), which explain the 54.28% of the phenomenon variance. The Cronbach alpha index was 0.9 approaching the respective reliability factor at the original validation (alpha > 0.9). The test-retest reliability was highly statistically significant with an alpha = +0.86, close to the results of the original validation (r = 0.82). The criterion validity has shown high correlation with the PSS (r = 0.737), plus the fact that the results of the correlation with the DSS-21 (r = 0.597) were satisfactory. The satisfactory results, as it concerns the psychometric properties of the PSQ, make the questionnaire an appropriate measuring tool of the perceived stress of the Greek population.
Keywords:Perceived Stress Questionnaire, Validation, Psychometric Properties, Population-Based Survey

1. Introduction
Stress is a notion which has raised the interest of the scientific community over the last years, either because of its definition and its forms of measurement or of its impact on the harmonious function of each organism. More specifically, stress is defined as a state in which homeostasis is actually threatened or perceived to be so (Chrousos, 2009).
There are three basic approaches of stress. Firstly, the environmental approach is based on the external conditions (stressors) and contains the impact of stressful events. The psychological approach focuses on the perceived stress and its negative emotions. Finally, the biological approach is related to the measurement of biological indicators, such as cortisol and amylase of saliva (Fliege, Arck, Walter, Kocalevent, Weber, & Klapp, 2007). Since all the approaches above present some weaknesses, as far as the measurement of stress is concerned, their combination seems to be contributing to a more complete approach of its measurement and definition.
Furthermore, some other basic divisions concerning the criteria of measuring stress are defined in the following basic structures: 1) in external stressors in view of “major life events”, 2) in everyday events which cause stress (cumulative minor stresses or hassles), and 3) in the way of perception and coping of the external conditions by the person himself (coping) (Sanz-Carillo, Garcia-Campayo, Rubio, Santed, & Montoro, 2002). By extension, the measurement tools of stress are focused on these structures, raising many discussions in the scientific society based on if we have to limit our measurement in external stressors (major life events or stressors) or on the perception of a person of a stressful event and his emotional reaction to it (Kanner, Coyen, Schaefer, & Lazarus, 1981).
By relying on the researches conducted for this subject, a significant correlation seems to exist between the stressful events and the emergence of health problems. This correlation is even stronger when these events concern chronic and major changes in a person’s life. For this reason, the scientific interest is turning to the subjective perception and coping of the conditions by the actual person (Fliege, et al., 2005; Fliege, Rose, Arck, Levenstein, & Klapp, 2001).
A basic issue in the research of psychosomatic disorders is the impact of the stress on the physical and psychological health. A stressful factor can affect the immune system either by the emergence of any kind of health problem or by its evolution. By observing the interactions between the neural, endocrinologic and immune system, their common denominator seems to be the perceived stress (Lorentz, 2006).
During the last years, research has shown an important correlation between stress and depression. It has been observed that both acute and chronic stress is connected to the emergence, evolution or possible recrudescence of depression (Hammen, 2005; Kessler, 1997; Liu & Alloy, 2010). The question is why each stressful event can be experienced differently by each person? So, the interest of the research is detected in the factors that affect the way of coping situations. Individual factors, as the personality, beliefs, experiences, and also genetic factors seem to have an impact on the cognitional process of stressful events, altering its response to the person (Hammen, 2006). Based on the bibliography, depression is more often observed in women than that in men. Also, the percentages of its emergence in teenagers are high which renders the woman teenagers considerably vulnerable, in an age when the person is under the formation of his personality (Hammen, 2003).
The Perceived Stress Questionnaire (PSQ) of Levenstein et al. is orientated towards this direction. In fact, this measurement is based on the subjective perception of things and the emotional reaction to them (Levenstein, Pantera, Varvo, Scribano, Berto, Luzi, & Andreoli, 1993). For this reason, the format of the items is also based on this subjective perception, including many item wordings as following: “You feel...” Moreover, this questionnaire can be widely used without the restrictions based on the age, gender or profession of the participants. This way, it becomes more manageable to the general population and the content of the items can be answered for a considerable total of cases as well (Fliege et al., 2005).
Some other representative questionnaires of perceived stress are the Stress Appraisal Measure (SAM), the Impact of Event Scale (IES) and the Perceived Stress Scale (PSS), which are the most known and widespread questionnaires on this subject (Peackock & Wong, 1990; Horowitz, Wilner, & Alvarez, 1979; Cohen, Kamarck, & Mermelstein, 1983).
PSS, which was validated in 2011 in Greece, is based on 14 items about stressful events caused during last month and which were unexpected and out of the control of those being questioned. The content of the questions is mainly focused on gathering elements about the cognitive appraisal and the coping capability of the person (Andreou, Alexopoulos, Lionis, Varvogli, Gnardellis, Chrousos, & Darviri, 2011).
Additionally, in the current research the validation of the Perceived Stress Questionnaire (PSQ) of Levenstein et al. in Greece has been attempted. While the validation of a questionnaire for the perceived stress is very recent, PSQ is recommended as very useful and complete since it aims to gather elements about the subjective and emotional coping of each person of a stressful event and since it includes realistic external stressors. Besides, by using this questionnaire we tried to offer a more efficient approach in measuring and associating stress with the health problems. It finally offers the examination of different facets of perceived stress (Fliege et al., 2005; Levenstein et al., 1993). PSQ, as a tool of measurement of perceived stress, has been applied to a wide range of researches on physical and psychological disorders as well as on healthy population (Kocalevent, Levenstein, Fliege, Schmid, Hinz, Brahler, & Klapp, 2007; Bergdahl & Bergdhal, 2002; Levenstein, Pantera, Varvo, Scribano, Andreoli, Luzi, Arca, Berto, Milite, & Marcheggiano, 2000; Wikgren, Maripuu, Karlsson, Nordfall, Bergdahl, Hultdin, Del-Favero, Roos, Nilsson, Adolfsson, & Norrback, 2012; Keefer, Kielbes, Kwiatek, Palsson, Taft, Martionovich, & Barrett, 2012; Krohn, Listing, Tjahjono, Reisshauer, Peters, Klapp, & Rauchfuss, 2011; Levenstein, Pantera, Varvo, Scribano, Andreoli, Luzi, Arca, & Berto, 1994; Rosenberger, Elsenbruch, Scolle, Greiff, Schedlowski, Forsting, & Gizewski, 2009).
PSQ is consisted of 30 closed questions and it was published in 1993. It is already validated in Italian, English, Spanish and German (Kanner et al., 1981; Fliege et al., 2001; Levenstein et al., 1993). The initial validation of Levenstein et al. with the scale of 30 rates was conducted to 230 people of clinical population (meaning people with chronic disease and health professionals). As a result from this validation, seven factors were obtained: harassment, irritability, lack of joy, fatigue, worries, tension and overload, respectively (Levenstein et al., 1993).
In the current research, the aim included the validation of PSQ in Greek, destined to adult people of the general population, from all the socio-economical classes. The reason why people from the general population were chosen was the fact that we wanted to examine if PSQ could measure the levels of stress to healthy people, where the detection and the measurement of stress are a demanding procedure. At the same time, the examination of a possible correlation between stress and depression was aimed, as obvious by the bibliography.
2. Methods
This research is an attempt to adjust the Perceived Stress Questionnaire (PSQ) from English to Greek language. It has been decided to use, in general population, the version of the questionnaire which concerns last month’s events (recent PSQ). In the original article Levenstein et al. have focused particularly on the stress of the clinical sample. As a result, stress related to the stressful situation of the health problems and symptoms were detected and measured. However, stress related to more recent events was not detected (Liu & Alloy, 2010). Moreover, the researchers mentioned that if they had not used Life Events Scale questionnaire and Daily Hassles Scale questionnaire, the correlation between the current/recent perceived stress would probably not have been found (Levenstein et al., 1993; Kocalevent et al., 2007). Additionally, its correlation with another tool measuring stress, the Cohen Perceived Stress Scale and with the scales of measuring depression as well seem to be significant. (Fliege et al., 2005; Sanz-Carrillo et al., 2002; Kocalevent et al., 2007).
The bibliography indicates that the response to a stressful factor appears to be a “personal case” which depends on the nature of the stressor, the assessment of the situation and the existence or not of the necessary sources (Lazarus & Folkman, 1984; Chrousos, 1998; Lazarus, 1993). All the above have risen the question of whether this questionnaire can reliably measure the perceived stress. In conclusion, goal of the statistical analysis is to query if the factors tested corroborate the proposed model in the general Greek population.
2.1. Participants
In the presented research 1318 adults participated, mainly citizens from Attiki and Argolida state but also from other rural areas (Xanthi, Santorini, Chaniaetc). Male percentage was 42% (N = 554) and female 58% (N = 764), mean average age of the sample was 38 years with ages varying between 18 and 81 years old and standard deviation 12.5. Concerning the marital status, 47.2% of the sample (N = 622) stated “not married” and 47.7% (N = 618) “married”. “Divorced” and “widow/-er” counted for 4.6% (N = 60) and 1.5% (N = 20) respectively. As for the educational level of the participants, 48.2% (N = 635) were University graduates, 30.5% (N = 402) Lyceum graduates and 15.7% (N = 207) had a postgraduate degree. Only 3.3% (N=43) were High School graduates and 2.3% (N = 30) primary school graduates. The majority of the participants (35.3%, N = 465) were working in the Public Sector whereas the 21.2% (N = 279) were working in the Private Sector. 16% (N = 211) states “freelancer”, 11.9% (N = 117) “student”, 7.9% (N = 104) “unemployed”, 4.4% (N = 58) “retired”, 3 % (N = 39) “housekeeping” and finally 3.4% (N = 45) states “something else”. Finally, as for the residency, 55.4% (N = 730) lives in Attiki and the rest 44.6% (N = 446) lives in the province.
2.2. Tools
The participants were provided with the Perceived Stress Questionnaire, the Greek adjusted questionnaires for depression and perceived stress measurement―DASS21 and PSS respectively―as well as a form concerning the demographic data of the participants.
Demographic data: In this sheet the participants filled in data concerning gender, age, marital status, educational level, occupation and residency.
Perceived Stress Questionnaire (Levenstein, 1993): It is a tool that calculates the perceived stress in a specific situation and the response to that in regard to the cognitive (experience, resources etc.) and emotional level (Liu & Alloy, 2010: Appendix I). The final validation was addressed to 230 individuals of English and Italian origin, which were selected among healthy but also clinical population. It consists of 30 elements which are based on 7 factors: harassment, irritability, lack of joy, fatigue, worries and tension. The participants answer on a Likert 4- point scale (1: almost never, 2: sometimes, 3: often, 4: usually). The form of the questionnaire is provided in two separate types; the general one which is about the events of the last two years (General Version) and the recent one which asks about the last month. The sum of the test answers is added in a total score (raw-score = 30 - 120) which represents the stress-degree of each participant.
The PSQ has been translated in German (Fliege et al., 2001) and Spanish (Sanz-Carrillo et al., 2001). It must be mentioned that in the German adjustment the model of the questionnaire is loaded in only 4 factors ( worries, tension, joy and demands) and is shorter, consisting of only 20 elements.
In this particular research a Greek version of the PSQ has been used. The first part of the research was the translation from English to Greek, following the suggestions of Brislin (Brislin, 1970). The method used was that of reverse translation. In the beginning two bilingual translators, who were not aware of what the test was to examine, translated from English to Greek, creating two new different Greek versions of the test. Subsequently the aforementioned translators met each, compared the two versions, discussed on the controversial points and concluded in a final new version of the questionnaire. This final version was translated from Greek back to English by a third bilingual person (Appendix II).
DASS21: It is a 21 items tool, being a short version of the Depression Anxiety Stress Scale which consists of 42 elements (Lovibond & Lovibond, 1995a). The final version of the 21 items regards the ones that load more the factors being tested, whereas the multivariate analysis showed satisfactory convergent and deviant validity and high internal coherence for the clinical and the general population as well.
DASS21 is a self-reference questionnaire which measures the negative effect of the “distress” based on three main symptoms: depression, anxiety (e.g. psychological stimulation) and stress (e.g. cognitive reconstruction). The aforementioned symptoms are differentiated simultaneously with the final score. The participants reply, based on their experience from the described situations during last week, in a 4-point scale (0: not valid for me, 1: valid at a certain degree or a specific time-period, 2: valid for me at high degree or for a long time-period, 3: especially valid for me or most of the times). In our research the Greek version of the questionnaire has been used, which presents high correlation with the initial test (Lyrakos, Arvaniti, Smyrnioti, & Kostopanagiotou, 2011).
Perceived Stress Scale (Cohen): It is a tool of measuring perceived stress; the participants reply on how they experienced (frequency of reactions and thoughts) some situations during last month (Cohen et al., 1983). It consists of 14 elements in a Likert 5-point scale (1: never, 2: almost never, 3: sometimes, 4: frequently, 5: very frequently). There are also shorter versions of the questionnaire with 10 and 4 elements. The questionnaire has been loaded in other languages, such as Spanish, Turkish, Swedish, Chinese, Japanese and Arabic. In our research the Greek version has been used (Andreou et al., 2011).
2.3. Procedure
After the approval of Dr. Levenstein for the use of the questionnaire, we worked on the linguistic and cultural copy of the tool in the Greek language. At the beginning a trial took place by 20 people who filled in the test in order to detect possible mistakes. Subsequently, the data collection started, lasting from May until October 2012. The participants were mainly family and friends but also employees in the Public and Private sector.
The entire sample (N = 1318) filled the PSQ in. From the total of the participants N = 453 were provided at the same time with the PSS in order to evaluate the criterion validity (Concurrent Validity). In order to evaluate the construct validity (Convergent Validity) of the questionnaire, we evaluated the levels of depression in a part of the sample, N = 451 by giving the DASS-21. We were expecting that the participants with high levels of depression would present stress of medium-high level. Moreover, the PSQ was provided, for a second time in onemonth interval (test-retest), to a part of the participants (N = 212) in order to evaluate the stability in time. Due to the anonymity of the questionnaires, we created passwords for the individuals who were retested so that the proportionate correlations could be made. The one month interval was considered proper so that the participants would have forgot the questions but also in order to avoid vast changes in their lives.
3. Results
The statistical programs SPSS (21.0) and AMOS (21.0) were used for the statistical analysis of the data.
As far as the basic variables of our survey are concerned the averages and standard deviations are depicted in Table1 In particular the average of our sample in PSQ was 73.29 and the standard deviation 15, the average in DASS was 36.85 and the standard deviation 11.04, while the average in PSS was 41.05 and the standard deviation 7.23.
In the first stage we performed item analysis, in order to explore the variance per item and find out whether all possible answers are systematically chosen by the participants. The results have shown that all items had satisfactory variance (0.6 up to 0.9), while all possible answers were chosen for each item (Tables 2-7).
As far as the scale reliability is concerned, we used the Cronbach alpha criterion, which is an internal consistency index, in parallel with the test-retest method at the same sample with one-month temporal distance.

Table 1. Average and standard deviation in PSS, DASS, PSQ.
Table 2. Average, standard deviation, variance and median of PSQ items.
Table 3. Average, standard deviation, variance and median of PSQ items.
Table 4. Average, standard deviation, variance and median of PSQ items.
Table 5. Average, standard deviation, variance and median of PSQ items.
The coefficient cronbach alpha was 0.9 (Table 8) in our survey, similar to the respective one in the original validation (alpha > 0.9). Similar results of cronbach alpha index come out in the rest validations of the tool (Table 9). The item deletion analysis, performed in order to raise the internal consistency index, led to the conclusion that this exception does not raise the index (Table 10).
Table 6. Average, standard deviation, variance and median of PSQ items.
Table 7. Average, standard deviation, variance and median of PSQ items.
Table 8. Internal consistency reliability index for PSQ in 1318 persons sample.
Table 9. Internal consistency reliability index for PSQ of all validations.
3.1. Reliability
Table 10. Analysis of items exception so that the internal consistency index is raised in PSQ.
Reliability analysis using the test-retest method showed that the questionnaire is reliable, since the analysis of the consistency using the Pearson r correlation coefficient was equal to r = 0.867 and the level of statistical significance is equal to 0.01 (Table 11). The results of the test-retest analysis concerning the scale reliability were very encouraging, since they are similar to those of the original validation (r = 0.82).
3.2. Validity
Table 11. Reliability analysis results of the test-retest method for PSQ
As far as the validation of the scale is concerned, we firstly attempted to confirm construct validity by using the total score of depression based on DASS-21 scale. The criterion validity was measured based on the total score of stress of the PSS scale.
A statistically significant positive correlation of moderate strength between PSQ and DASS was expected according to the bibliography for the relationship between depression and stress. A statistically significant positive correlation between PSQ and PSS was also expected. Despite the fact that both tools measure perceived stress, we predict no high positive correlation between them, because of the fact that PSQ also measures expanded environmental factors.
According to the results in Table 12, PSQ has satisfactory construct validity using as a criterion the depression scale DASS21 (r = 0.597, p < 0.01) and the stress scale PSS (r = 0.737, p < 0.01) as well.
Moreover as far as content validity is concerned, we performed factor analysis to verify the original one. We measured the inter―correlations between the items, in order to determine if the specifications for performing factor analysis are satisfying. According to the methodological rule for performing factor analysis, the correlations between the items must in principle be positive and weak to moderate (0.2 - 0.5). Furthermore, the KMO and Bartlett’s Test of Sphericity were checked as to data distribution and its results showed that we can move forward with analysis (Table 13).
We performed exploratory factor analysis using the principal component method and after rotated component matrix the analysis results are depicted in Table 14, Table 15 and in Figure 1.
Based on the factor analysis results PSQ seems to consist of five principal factors which explain the 54.28% of phenomenon variance. These factors are: Overload, Worries, Joy, Tension-Fatigue, and Harassment. More particularly, in the first factor (Overload), items 2, 4, 11, 16, 18, 25, 28, 30 are loaded. In the second factor (Worries), items 9, 12, 15, 20, 22, 23, in the third factor (Joy) items 1, 7, 13, 17, 21, 29, in the fourth factor (Tension-Fatigue) items 3, 5, 8, 10, 14, 26, 27 are loaded and lastly in fifth factor the items 6, 19, 24.
Table 12. Criterion validity analysis for PSQ using as a criterion the depression scale DASS 21 and the stress scale PSS.
Note: **Correlation is significant at the 0.01 level (2-tailed).
Table 13. Preliminary analysis based on KMO and Bartlett’s Test of Sphericity for performing factor analysis.
Note: **Correlation is significant at the 0.01 level (2-tailed).
Table 14. Factor analysis for the total of PSQ items with principal component method and after rotated component matrix
Table 15. PSQ items loads per factor.
Note: Extraction method: principal component analysis.
. Factors and items according factor analysis of English, German, Spanish and Greek validationsNote: Extraction Method: Principal Component Analysis. Rotation Method: Varimax with Kaiser Normalizationa. aRotation converged in 6 iterations.
This solution differs from 7 factors solution of the original validation in which the following factors were found: Worries, Tension, Lack of joy, Overload, Harassment, Irritability, Fatigue.
Nevertheless, the solution of fewer factors arises in respective validation occasions in Spain and Germany apparently because of cultural reasons
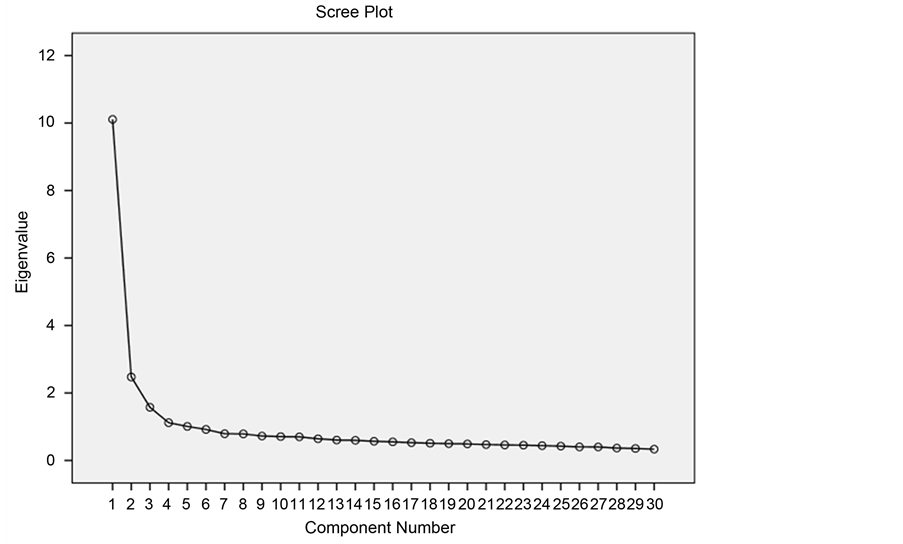
Figure 1. Dendrogram of PSQ factors after rectangular axes rotation.
3.3. Confirmatory Factor Analysis (CFA)
Table 17. Confirmatory Factor Analysis (CFA) of sevenand fivefactorial solution of the PSQ.
Concerning the factor analysis confirmation, the statistical method of confirmatory factor analysis was used. Two different models were compared: 1) the model of seven factors, which also corresponds to the initial model of the researchers (Figure 2), and 2) the model of five factors (Figure 3).
For the confirmation of the validity of each model the following indexes of good adjustment were used: 1) CFI (Comparative Fit Index), 2) AGFI (Adjusted goodness of Fit), 3) NFI (Normal Fit Index), and 4) RMSEA (RootMean Square Error of Approximation). For the comparison of both models we used the index AIC (Akaike Information Criterion). In Table 17, the indexes of good adjustment of each model were presented comparatively.
Note: CFI = Comparative Fit Index; AGFI= Adjusted goodness of Fit; NFI= Normal Fit Index; RMSEA = Root-Mean Square Error of Approximation; AIC = Akaike Information Criterion.
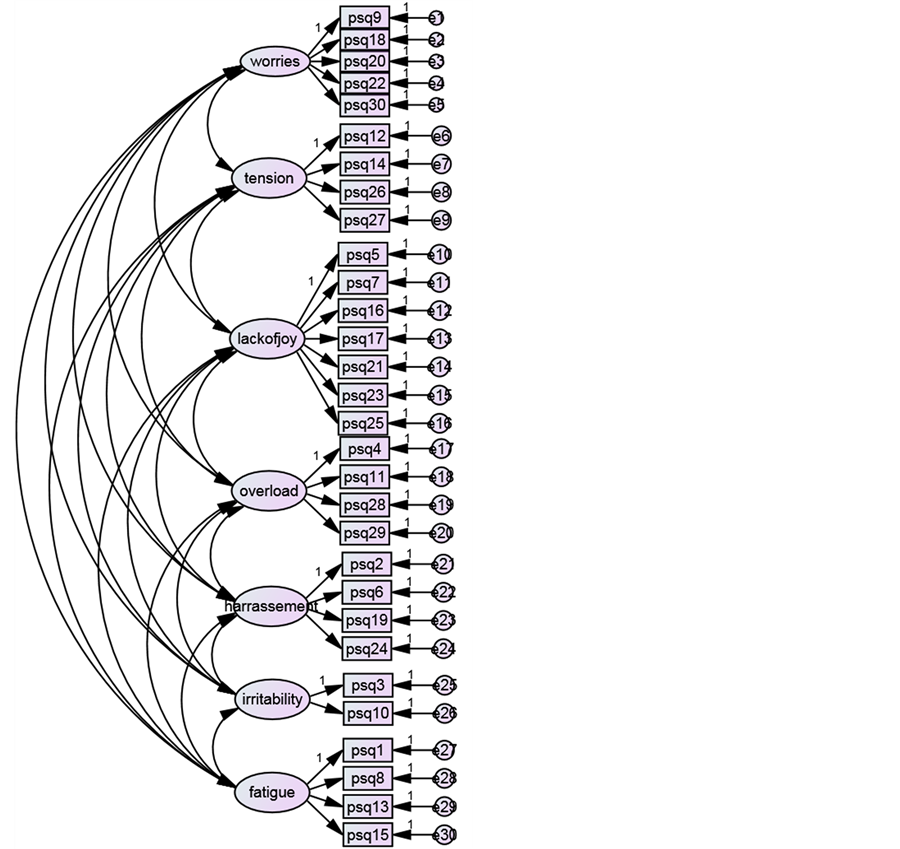
Figure 2. Seven-factor model.
As the table above presents the indexes of good adjustment for the model of seven factors are: χ2(384, Ν = 1318) = 3785.75, p < 0.001, CFI = 0.78, AGFI = 0.73, NFI = 0.76, RMSEA = 0.08. By comparing the figures that the indexes are supposed to have, we can observe that the model of seven of the factors is not satisfying. On the contrary, the model of five factors gives comparatively better results: χ2(395, Ν = 1318) = 2701.59, p < 0.001, CFI = 0.85, AGFI = 0.83, NFI = 0.83, και RMSEA = 0.06.
Finally, by comparing the index AIC of both models we have AIC7-factor = 3947.75 and AIC5-factor = 2841.59. So, this gives us AIC5-factor < AIC7-factor, which means that the model of five factors suits more the Greek facts.
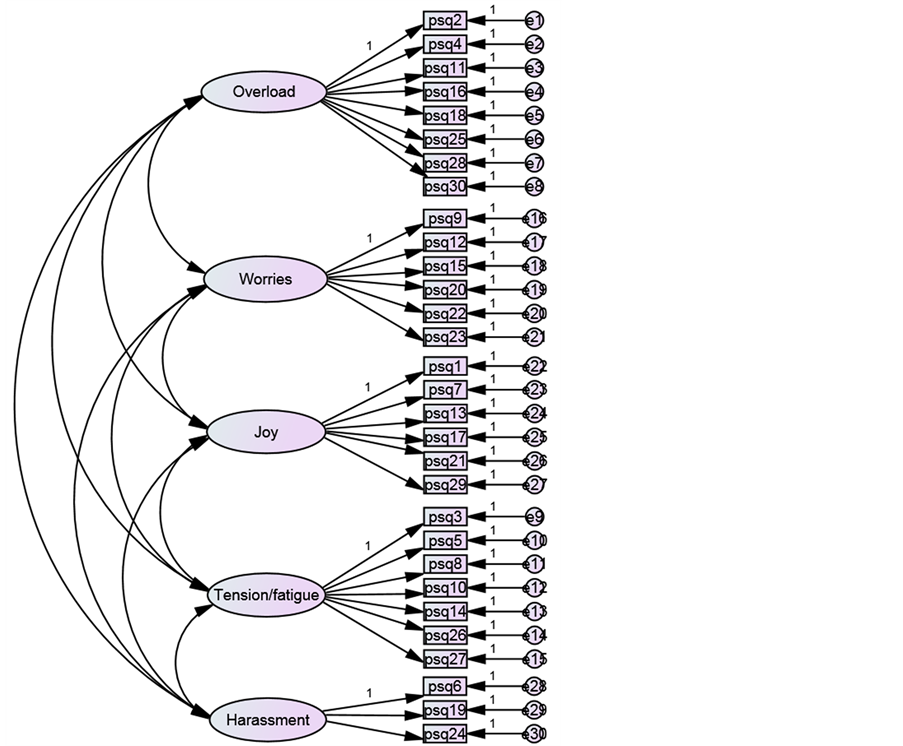
Figure 3. Five-factor model.
4. Discussion
The purpose of this research was the adjustment Perceived Stress Questionnaire (PSQ), a scale of measurement of perception of stress, from English to Greek standards. It is about a process of linguistic correspondence and cultural transfer of the questionnaire. It presupposes as well a chain of statistic methods for the validity of the psychometric properties of the tool.
For the validation of the reliability of the PSQ scales two ways of control were used. Firstly, by measuring the reliability of the Internal Consistency, in order to validate the homogeneity and consistence of the elements, the index Cronbach alpha was used, which showed satisfying results approaching the corresponding figures of the initial validation. For the evaluation of the stability in time, the process of test-retest was applied to Ν = 212 people of the sample, in the period of one month. Finally, we had two sets of figures-responses for each of these people, which were also compared. In this case also, the figures were close to the standards of the initial model (Original English validation r = 0.82—Greek validation r = 0.86).
For the evaluation of the Convergent Validity PSS was given to Ν = 453 people of the sample with the PSQ. By using the index of correlation Pearson r, the scales of both tools were compared, which revealed us a strong correlation. It should be noted that in every scale significant statistical correlations were found.
Furthermore, for the evaluation of the Convergent Validity, DASS 21 was also given to Ν = 451 people of the sample. The statistic analysis showed a considerable correlation between the two scales, which is proved by the bibliography as well (Hammen, 2005; Hammen, 2006; Hammen, 2003; Lyrakos et al., 2011).
For the evaluation of the factor analysis of our questionnaire, the Confirmatory Factor Analysis (CFA) was used with the rotated component matrix. The result did not confirm completely the original factor analysis. The number of the factors seems to be less in the original validation, while the loadings of the items vary showing different construct validities and different structural perception of these factors in the Greek society. A similar diversification on the factor analysis is also met in both German and Spanish validation. More particularly, the original validation recognizes in the test a structure of seven factors: worries: 9, 18, 20, 22, 30, tension: 12, 14, 26, 27, lack of joy: 5, 7, 16, 17, 21, 23, 25, overload: 4, 11, 28, 29, harassment: 2, 6, 19, 24, irritability: 3, 10 and fatigue: 1, 8, 13, 15. On the contrary, in the German validation a structure of four factors is revealed: worries: 5, 6, 9, 12, 15, 18, 19, 20, 22, 23, 24, 28, tension: 1, 8, 10, 14, 26, 27, joy: 7, 13, 17, 21, 25, demands: 2, 4, 16, 29, 30, while items 3 and 11 do not load any factor and have been erased from the final form of the tool. A similar phenomenon is met in the Spanish validation as well, where the items finally load less factors (6 factors) than in the initial edition (7 factors). What is more, new factors are discovered which did not exist in the original validation: fear/anxiety: 22, 28 and self-realization/satisfaction: 7, 9, and 23. In the Greek validation the solution of the five factors was judged as the most satisfying. In fact, these factors explain the 54.28% of the variance of the phenomenon. From the original factor analysis the factors Overload, Lack of joy, Harassment and Worries were kept without any change. Nevertheless, in our sample the other two factors Tension and Fatigue of the original validation seem to exist into a common factor: Tension/Fatigue. Even though in the original questionnaire the factors above are loaded separately, in the Greek validation they are loaded in common, while the content of the items seems to be consistent. For example, the questions “Do you feel tired?” and “Do you find it difficult to relax?” which in the original validation are loaded in two different fatigue and tension, in the Greek validation they are expressed by one common factor.
Additionally, as far as the factor analysis is concerned the question 8 (Do you feel tired?) seemed to be loaded in both factors fatigue/tension and Overload. This question was chosen, instead of being deleted, to be added to the final score of the factor fatigue/tension, because of its notional-lexical connection with it.
Finally, as far as the question twenty-three is concerned (“Do you feel that you are doing things because you have to and not because you want to?”) in the initial validation, it seems to depend on the factor Lack of Joy, obviously based on the fact that the performance of unwanted actions does not bring satisfaction. Nevertheless, in the Greek validation the item is not loaded in the respective factor, but it is double-loaded in the factor Worries and in the factor Irritation. The double-loading is probably explained by the fact that people from the sample considered that the pressure for the performance of unwanted actions is caused by a third person (see Harassment), while the rest people probably considered that the pressure was caused by themselves and because of it Worries for the final result are caused.
In the current validation we decided that the item should be included into the factor Worries, even though this loading is not characterized by a significant difference.
5. Conclusion
The conclusions of this research and the factor analysis of PSQ could be expanded or constitute the basis for researches in other cultural and linguistic approaches, where relevant construct validities could be compared. Due to different facts, concerning matters of language and culture, a further research is highly recommended in both norms and psychometric properties of the tool. Still, a further research is also proposed in our validation. If a bigger sample was used, the results could be even stronger concerning the generalization. However, a significant differentiation in the homogeneity of the sample is considered to be possible, since the psychometric characteristics of the tool are in satisfying levels, compared also to the results of the initial validation. Another limitation of the research is the absence of clinic sample. In future possible studies of PSQ in Greek population, the examination of the clinical sample could contribute to the research of the psychosomatic symptoms.
Based on bibliographic references, it is evident that stress is related to various psychosomatic disorders. In particular, the existence of high levels of stress could either constitute the cause of the emergence of a health problem or could contribute to its negative evolution. Perceived Stress Questionnaire is a tool of measuring the perceived stress, which is proposed as an essential and valuable tool given the ability to help in both diagnosis and intervention, concerning the clinic aspect. Additionally, it could contribute as well to the section of prevention and health promotion in a large number of demands and needs, in the general population. Let us hope that the current research, despite its limitations, will constitute a useful tool in other intercultural studies of validation and norms construction.
References
- Andreou, E., Alexopoulos, C. E., Lionis, C., Varvogli, L., Gnardellis, C., Chroussos, G. P., & Darviri, C. (2011). Perceived Stress Scale: Reliability and Validity Study in Greece. International Journal of Environmental Research and Public Health, 8, 3287-3298. http://dx.doi.org/10.3390/ijerph8083287
- Bergdahl, J., & Bergdahl, M. (2002). Perceived Stress in Adults: Prevalence and Association of Depression, Anxiety and Medication in a Swedish Population. Stress and Health, 18, 235-241. http://dx.doi.org/10.1002/smi.946
- Brislin, W. R. (1970). Back-Translation for Cross-Cultural Research. Journal of cross-cultural Psychology, 1, 185-216. http://dx.doi.org/10.1177/135910457000100301
- Chrousos, P. G. (2009). Stress and Disorders of the Stress System. Nature Reviews Endocrinology, 5, 374-381. http://dx.doi.org/10.1038/nrendo.2009.106
- Chrousos, G. P. (1998). Stressors, Stress, and Neuroendocrine Integration of the Adaptive Response. The 1997 Hans Selye Memorial Lecture. Annals of the New York Academy of Sciences, 851, 311-335. http://dx.doi.org/10.1111/j.1749-6632.1998.tb09006.x
- Cohen, S., Kamarck, T., & Mermelstein, R. (1983). A Global Measure of Perceived Stress. Journal of Health and Social Behavior, 24, 385-396. http://dx.doi.org/10.2307/2136404
- Fliege, H., Rose, M., Arck, P., Levenstein, S., & Klapp, B. F. (2001). Validierung des ’’Perceived Stress Questionnaire’’ (PSQ) an einerdeutschen Strichprobe. Diagnostica, 47, 142-152. http://dx.doi.org/10.1026//0012-1924.47.3.142
- Fliege, H., Rose, M., Arck, P., Walter, B. O., Kocalevent, R., Weber, C., & Klapp, B. (2005). The Perceived Stress Questionnaire (PSQ) Reconsidered: Validation and Reference Values From Different Clinical and Healthy Adults Samples. Psychosomatic Medicine, 67, 78-88. http://dx.doi.org/10.1097/01.psy.0000151491.80178.78
- Hammen, C. (2006). Stress Generation in Depression: Reflection on Origins, Research and Future Directions. Journal of Clinical Psychology, 62, 1065-1082. http://dx.doi.org/10.1002/jclp.20293
- Hammen, C. (2003). Research Report. Interpersonal Stress and Depression in Women. Journal of Affective Disorders, 74, 49-57. http://dx.doi.org/10.1016/S0165-0327(02)00430-5
- Hammen, C. (2005). Stress and Depression. Annual Review of Clinical Psychology, 1, 293-319. http://dx.doi.org/10.1146/annurev.clinpsy.1.102803.143938
- Horowitz, M. J., Wilner, N., & Alvarez, W. (1979). Impact of Event Scale: A Measure of Subjective Distress. Psychosomatic Medicine, 41, 209-218. http://dx.doi.org/10.1097/00006842-197905000-00004
- Kanner, A. D., Coyen, J. C., Schaefer, C., & Lazarus, R. S. (1981). Comparison of Two Models of Stress Measurement: Daily Hassles and Uplifts versus Mayor Life Events. Journal of Behavioral Medicine, 4, 1-39. http://dx.doi.org/10.1007/BF00844845
- Keefer, L., Kielbes, L. J., Kwiatek, A. M., Palsson, O., Taft, H. T., Martionovich, Z., & Barrett, A. T. (2012). The Potentioal Role of a Self-Management Intervention for Ulcerative Colitis: A Brief Report from the Ulcerative Colitis Hypnotherapy Trial. Biological Research for Nursing, 14, 71-77. http://dx.doi.org/10.1177/1099800410397629
- Kessler, R. C. (1997). The Effects of Stressful Life Events on Depression. Annual Review of Psychology, 48, 191-214. http://dx.doi.org/10.1146/annurev.psych.48.1.191
- Kocalevent, R., Levenstein, S., Fliege, H., Schmid, G., Hinz, A., Brahler, E., & Klapp, B. F. (2007). Contribution to the Construct Validity of the Perceived Stress Questionnaire from a Population-Based Survey. Journal of Psychosomatic Research, 63, 71-81. http://dx.doi.org/10.1016/j.jpsychores.2007.02.010
- Krohn, M., Listing, M., Tjahjono, G., Reisshauer, A., Peters, E., Klapp, F. B., & Rauchfuss, M. (2011). Depression, Mood, Stress, and Th1/ Th2 Immune Balance in Primary Breast Cancer Patients Undergoing Classical Massage Therapy. Supportive Care in Cancer, 19, 1303-1311. http://dx.doi.org/10.1007/s00520-010-0946-2
- Lazarus, R. S. (1993). Coping Theory and Research: Past, Present and Future. Psychosomatic Medicine, 55, 234-247. http://dx.doi.org/10.1097/00006842-199305000-00002
- Lazarus, R. S., & Folkman, S. (1984). Stress, Appraisal, and Coping. New York: Spinger.
- Levenstein, S., Pantera, C., Varvo, V., Scribano, M. L., Andreoli, A., Luzi, C., Arca, M., & Berto, E. (1994). Psychological Stress and Disease Activity in Ulcerative Colitis: A Multidimensional Cross-Sectional Study. American Journal of Gastroenterology, 89, 1219-1225.
- Levenstein, S., Pantera, C., Varvo, V., Scribano, M. L., Andreoli, A., Luzi, C., Arca, M., Berto, E., Milite, G., & Marcheggiano, A. (2000). Stress and Exacerbation in Ulcerative Colitis: A Prospective Study of Patients Enrolled in Remission. The American Journal of Gastroenterology, 95, 1213-1220. http://dx.doi.org/10.1111/j.1572-0241.2000.02012.x
- Levenstein, S., Prantera, C., Varvo, V., Scribano, L., Berto, E., Luzi, C., & Andreoli, A. (1993). Development of the Perceived Stress Questionnaire: A New Tool for Psychosomatic Research. Journal of Psychosomatic Research, 37, 19-32. http://dx.doi.org/10.1016/0022-3999(93)90120-5
- Liu, T. R., & Alloy, L. (2010). Stress Generation in Depression: A Systematic Review of the Empirical Literature and Recommendation for Future Study. Clinical Psychology Review, 30, 582-593. http://dx.doi.org/10.1016/j.cpr.2010.04.010
- Lorentz, M. (2006). Stress and Psychoneuroimmunology Revised: Using Mind-Body Intervention to Reduce Stress. Alternative Journal of Nursing, 11.
- Lovibond, P. F., & Lovibond, S. H. (1995a). The Structure of Negative Emotional States: Comparison of the Depression Anxiety Stress Scale (DASS) with the Beck Depression and Anxiety Inventory. Behaviour Research and Therapy, 33, 335-343. http://dx.doi.org/10.1016/0005-7967(94)00075-U
- Lyrakos, G. N., Arvaniti, C., Smyrnioti, M., & Kostopanagiotou, G. (2011). P03-561-Translation and Validation Study of the Depression Anxiety Stress Scale in the Greek Population and in a Psychiatric Patient’s Sample. European Psychiatry, 26, 1731. http://dx.doi.org/10.1016/S0924-9338(11)73435-6
- Peackock, E. J., & Wong, P. T. P. (1990). The Stress Appraisal Measure (SAM): A Multidimentional Approach to Cognitive Appraisal. Stress Medicine, 6, 227-236. http://dx.doi.org/10.1002/smi.2460060308
- Rosenberger, C., Elsenbruch, S., Scolle, A., Greiff, A., Schedlowski, M., Forsting, M., & Gizewski, E. R. (2009). Effects of Psychological Stress on the Cerebral Processing of Visceral Stimuli in Healthy Women. Neurogastroenterology & Motility, 21, 740-747. http://dx.doi.org/10.1111/j.1365-2982.2009.01295.x
- Sanz-Carrillo, C., Garcia-Campayo, J., Rubio, A., Santed, M. A., & Montoro, M. (2002). Validation of the Spanish Version of the Perceived Stress Questionnaire. Journal of Psychosomatic Research, 52, 167-172. http://dx.doi.org/10.1016/S0022-3999(01)00275-6
- Wikgren, M., Maripuu, M., Karlsson, T., Nordfall, K., Bergdahl, J., Hultdin, J., Del-Favero, J., Roos, G., Nilsson, L. G., Adolfsson, R., & Norrback, K. F. (2012). Short Telomeres in Depression and the General population Are Associated with a Hypocortisolemic State. Biological Psychiatry, 71, 294-300. http://dx.doi.org/10.1016/j.biopsych.2011.09.015
NOTES

*These authors contributed equally and shared first authorship.
#Corresponding author.