Journal of Environmental Protection
Vol. 4 No. 7A (2013) , Article ID: 34715 , 6 pages DOI:10.4236/jep.2013.47A012
Evaluation of Water Quality Index in Lerma River Upper Basin
![]()
1Área de Química y Fisicoquímica Ambiental, División de Ciencia Básicas e Ingeniería, Universidad Autónoma Metropolitana Unidad Azcapotzalco, Mexico City, Mexico; 2Facultad de Ciencias Químicas, Universidad Autónoma de Nuevo León, San Nicolás de los Garza, Mexico; 3Centro Universitario de Ciencias Exactas e Ingenierías, Universidad de Guadalajara, Guadalajara, Mexico.
Email: *ibarceloq@gmail.com
Copyright © 2013 Icela D. Barceló-Quintal et al. This is an open access article distributed under the Creative Commons Attribution License, which permits unrestricted use, distribution, and reproduction in any medium, provided the original work is properly cited.
Received May 13th, 2013; revised June 18th, 2013; accepted June 28th, 2013
Keywords: Water Quality Index; Lerma River Upper Basin; BOD5; Nitrates; Phosphates
ABSTRACT
The Lerma River Upper Basin is located between Almoloya del Rio shallow lakes and Atlacomulco Municipality in the State of Mexico; is a natural resource essential to human activities in its surroundings and serves as a source of electricity and drinking water for Mexico City. However, this river is threatened by over-exploitation of its aquifers, disappearance of many of its wellsprings and uncontrolled discharges of wastewater from all sorts. Thus, the aim of this work was to evaluate the water quality in the Upper Lerma River Basin using WQI proposed by the NSF and compare these results with those obtained by the National Water Commission of Mexico (CNA). WQI was calculated using seven parameters: dissolved oxygen, pH, DOB5, temperature change, total phosphates, nitrates, and total solids obtained in four different sampling campaigns carried out in 2005, 2006 and 2012. The results showed that water quality in the Upper Lerma River is bad, mainly associated with high levels of BOD5, nitrates and phosphates found. The results obtained with WQI yielded the same diagnosis that the studies carried out by the CNA, in which water quality was unacceptable. It is worth noting that there is a significant water quality deterioration in the Upper Lerma River Basin with the course of the years, because in 2012 were observed the lower index values regarding 2005 and 2006, so it is imperative to implement measures to restore and preserve the water quality of this important river.
1. Introduction
The Lerma River originates from three shallow lakes located in the Almoloya del Rio Municipality in the State of Mexico, traverses northwest Toluca Valley and leads into Lake Chapala. It has a length of 708 km and drains an area of 47,116 km². The fluvial system Lerma RiverChapala Lake-Santiago is the second longest river in Mexico, with 1281 km, if it is considered from its source to its mouth at the Pacific Ocean [1]. The Lerma River is a natural resource which is essential to human activities in its surroundings and also serves as a source of electricity and drinking water for Mexico City [2]. The Lerma River Upper Basin is located in central Mexico (Figure 1), between Almoloya del Rio shallow lakes and Atlacomulco Municipality in the State of Mexico. This watershed drains an area of 2137 km2, covering 33 municipalities
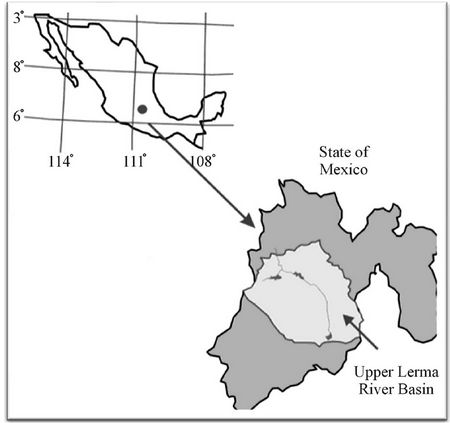
Figure 1. Upper Lerma River Basin localization.
and the river has a length of 175 km [1].
This basin was considered, until the middle of last century, the most fertile area of the Toluca Valley (capital of the State of Mexico), with a wide variety of flora and fauna and large volumes of water issuing from shallow lakes in the valley and runoffs from the peak of the snow-capped mountain of Toluca [3]. However, after the establishment of an agreement which allowed the Mexico City population to exploit the shallow lakes and groundwater of Lerma River, there has been an over-exploitation of its aquifers and depletion or disappearance of many shallow lakes [1]. In addition, uncontrolled wastewater discharges from municipal, industrial and agricultural sources threaten water quality throughout the basin.
In 1970, the National Sanitation Foundation (USA) developed the Water Quality Index (WQI) when 142 scientists answered a survey, in which they chose nine water quality parameters that should be included in the index from a list of 35 [4]. WQI has been tested in a variety of water bodies with different degrees of contamination and located in different geographic places [5]. It is a practical method to represent the problem of pollution in a water body and summarizes several parameters in a single number that can be used for comparison and determination of trends over time. Also, WQI is a useful tool for water management, as it allows to appreciating the state of a water body easily and to making suggestions for a more efficient basin management [6].
Also, the National Water Commission of Mexico (CONAGUA) analyzes runoff water quality at different points of interest located in Mexican territory through a systematic monitoring using its own water quality index (ICA) in order to detect changes in water characteristics and propose solutions. In the State of Mexico, the water quality monitoring program began in 1980 and sampling has been conducted at about 50 points. In some sites, it has been applied systematically and continuously, taking from three to eleven samples annually, while other sites have been monitored irregularly.
Thus, the aim of this work was to evaluate the water quality in the Upper Lerma River Basin using the WQI proposed by the National Sanitation Foundation (USA) with data from the different sampling campaigns and compare these data with those obtained by the National Water Commission of Mexico.
2. Methodology
2.1. Study Area
Sampling points were established in the Lerma River Upper Basin, which feeds the José Antonio Alzate Dam. These points were based on the Lerma River and its tributaries flow and on the morphology of the dam as shown in Figure 2.
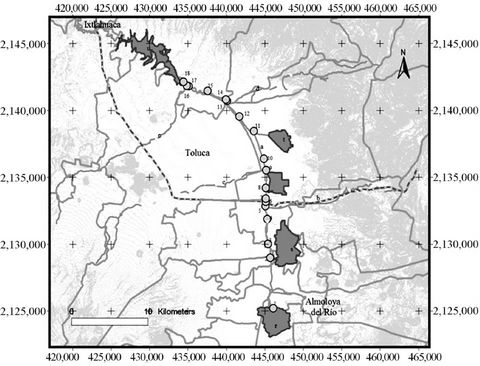
Figure 2. Sampling points established in the Lerma River Upper Basin: 1) Almoloya del Rio Shallow Lakes, 2) Tenango Municipality, 3) Mezapa Creek, 4) Guadalupe Neighborhood, 5) San Mateo Municipality, 6) Ocoyoacac Municipality, 7) Mexico-Toluca Highway, 8) Reciclagua WWTP, 9) Ameyalco Village, 10) Totoltepec Village, 11) Xonocatlán Municipality, 12) Toluca-Naucalpan Highway, 13) Santa Catarina Village, 14) San Lorenzo Village, 15) Verdiguel Creek, 16) Tejalpa Creek, 17) Toluca-Temoaya Road, 18) Jose Alzate Dam, 19) Ixtlahuaca Municipality.
2.2. Sampling Campaings
Sampling was conducted with support from the National Nuclear Research Institute of Mexico (ININ) and the Coordinating Committee for the Restoration of the Lerma River Basin (CCRECRL) in the following periods:
• February 2005, the beginning of the dry season with a sunny day and no wind.
• March 2006, during the dry season, the day was very sunny and windless.
• October 2006, sunny day and light winds.
• October 2012, sunny day with no wind.
2.3. Parameters Determined in Field
• Temperature: Determined with a calibrated thermometer integrated into Corning Equipment (Modelo).
• pH: Carried out according to EPA-600/4-79-020 150.1 [7], with a potentiometer coupled to Corning Equipment, previously calibrated. The potentiometer was recalibrated periodically with buffers.
• Dissolved oxygen: Dissolved oxygen was measured using the protocol EPA-600/4-79-020 EPA 360.2 [7] with a digital oximeter YSI, model 58. Each measurement was carried out four times.
In order to obtain reliable results, water never was put in contact with air.
2.4. Collection and Sample Preservation
Water was sampled using a van Dorn bottle, Beta Horintal Model 1920-G65 (Wildco Instruments, USA). For collection, clean polypropylene containers were used. During the sampling, these containers were rinsed several times with sampled water. The samples were preserved with HNO3 (pH < 2) and refrigerated at 4˚C.
2.5. Parameters Determined in Laboratory
The DOB5, nitrates, phosphates and total dissolved solids were determined according to the methods proposed in the Standard Methods for the Examination of Water and Wastewater [8].
2.6. WQI Calculations
The mathematical expression for WQI is the Equation (1):
 (1)
(1)
where i is the subscript for the i-th parameter of water quality, Qi is the value obtained for each parameter from its corresponding scale, Wi is the weight (in terms of importance) associated with the i-th parameter and p is the number of parameters taken into account in the index calculation [4].
The parameters usually employed to calculate the index are dissolved oxygen (DO), fecal Coliforms, pH, DOB5, temperature change, total phosphates, nitrates, turbidity and total dissolved solids. Since at the sampling campaigns fecal Coliforms and turbidity were not determined, the WQI was calculated by weighting the other seven parameters.
It was considered the temperature change as the temperature difference between the source of the river and the respective sampling point.
From the numerical result obtained in the previous calculation, the water quality is classified according to Table 1.
2.7. Water Quality Index of National Water Commission of Mexico
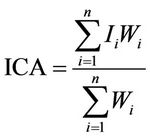
The results obtained in the water quality monitoring program were analyzed by the National Water Commission using a weighting procedure via a set of coefficients to obtain an indicator that represents the Water Quality Index (ICA) for each sample [9]. The mathematical expression for ICA is the Equation (2):
 (2)
(2)
where Ii is the quality index for the i-th parameter and Wi is the weight (in terms of importance) associated with the i-th parameter.
The parameters employed to calculate this index are: BOD5, nitrate, DO, fecal coliforms, total coliforms, methylene blue active substances, conductivity, suspended solids, phosphorous, oil and grease, ammonia, alkalinity, color, total hardness, pH, chloride, dissolved solids and turbidity. The National Water Commission also defined a scale to determine the water quality and its suitability for different uses (Table 2).
3. Results
3.1. Samplings Carried Out in 2005, 2006 and 2012
Tables 3 and 4 show the results obtained of dissolved oxygen, pH, BOD5, temperature shift, total phosphates, nitrates and total solids in the different sampling cam-
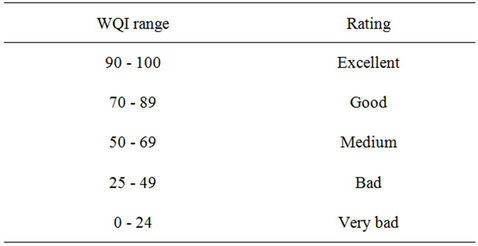
Table 1. WQI Interpretation.
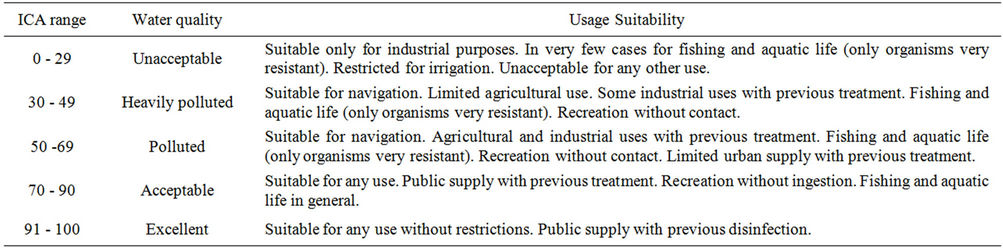
Table 2. National water commission scale for ICA.
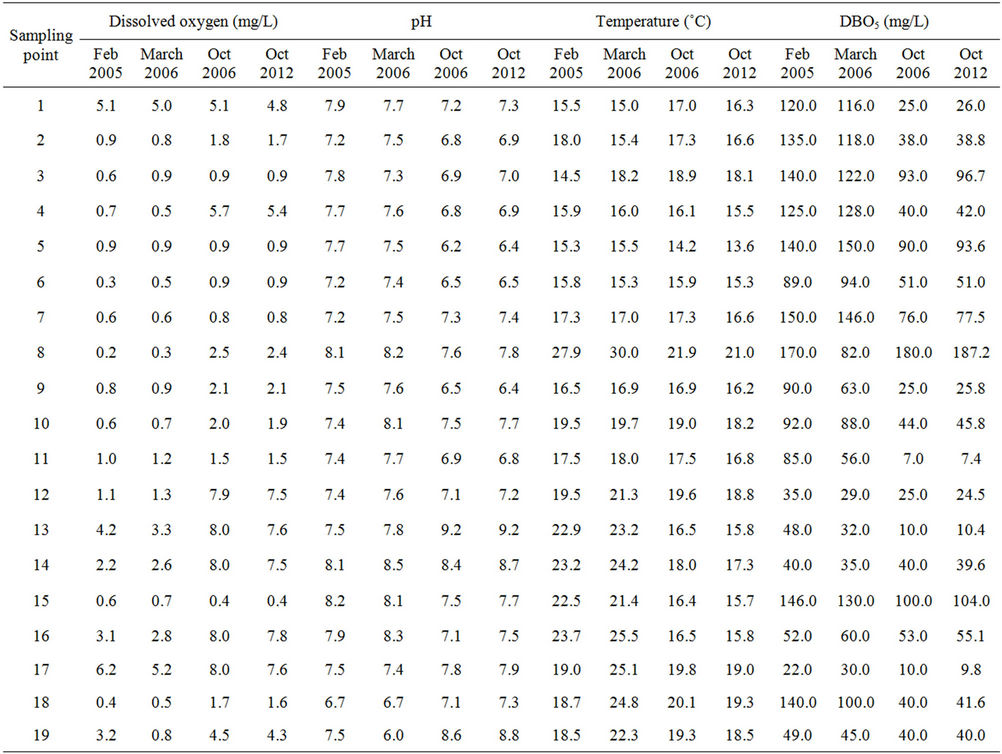
Table 3. Results obtained for dissolved oxygen, pH, BOD5 and temperature in the different sampling campaigns.
paigns.
During the dry season (samples taken in February 2005 and March 2006), the river showed the highest value of DO (5 mg/L) at its source in the Almoloya del Rio Municipality; but elsewhere, the river had concentrations very close to zero (from 0.2 to 0.5 mg/L); in those points also were observed the highest values of BOD5 (between 130 to 170 mg/L).
The pH ranged between 6 and 8.2 and the temperature between 15.3˚C and 23.7˚C throughout the river. In all sampling points, except at its source in Almoloya del Rio, there were found high phosphate values (greater than 30 mg/L), associated with runoff of agricultural activities, with a tendency to increase them along the course of the river. The reverse trend was observed in nitrates, which decreased along the riverbed, finding the highest value of these in Almoloya del Rio Municipality (47 mg/L) and lowest in the Municipality of Ixtlahuaca (12 mg/L).
In the samples taken just after the end of the rainy season (October 2006 and October 2012), the DO values were higher at various points of the river compared to those that were found in the dry season, registering values close to 8 mg/L at points as Toluca Norte, Santa Catarina and San Lorenzo. The BOD5 values found were lower than those registered at the dry season, due to dilution caused by the rainy season, however at the Reciclagua WWTP sampling point, this parameter increased to 170 - 180 mg/L. The pH varied in a wider range than in the dry season (between 6.5 and 9.2), while the temperature presented less variation (between 15.9˚C and 21.9˚C).
Phosphates and nitrates had similar trends to those found in the dry season, although the recorded concentrations were slightly higher. The total dissolved solids concentration was much higher in the post-dry season, probably due to the solids drag during the rainy season.
3.2. Evaluation of Water Quality Index
The WQI values obtained for all sampling points are shown in Figure 3.
During the dry season all points presented WQI values between 25 and 50; these results show that the Upper Lerma River presents bad water quality along its riverbed.
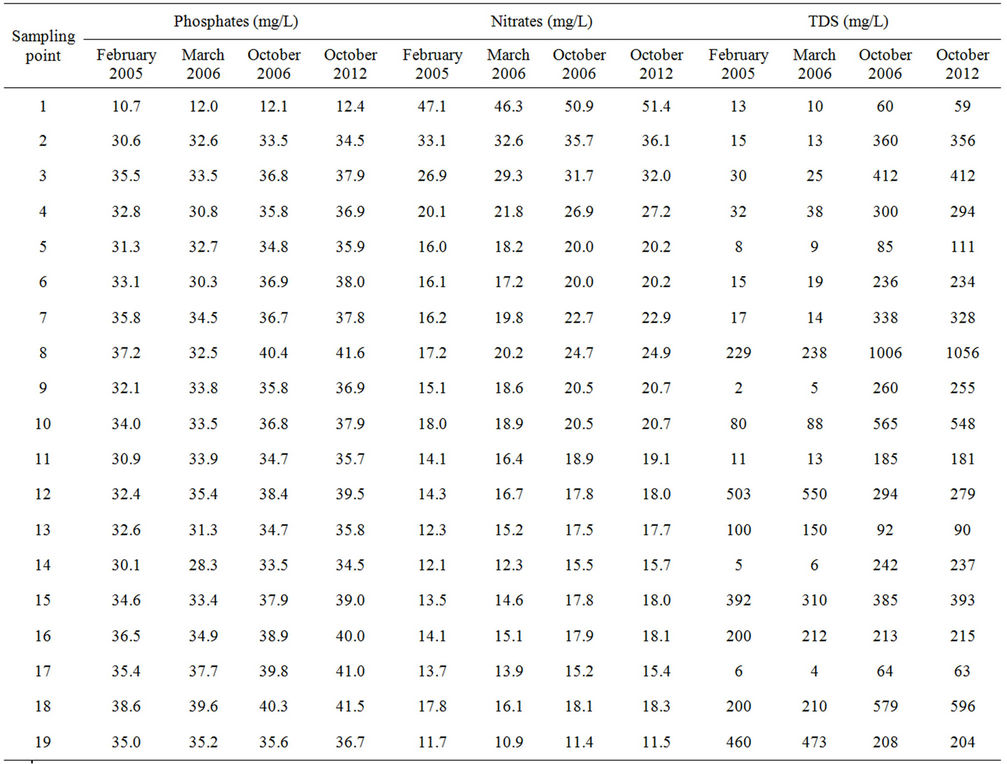
Table 4. Results obtained for phosphates, nitrates and total solids in the different sampling campaigns.
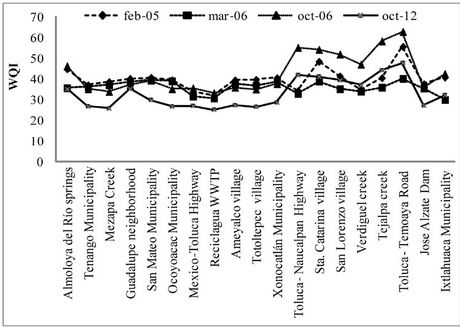
Figure 3. WQI values obtained for all sampling points.
The points with the worse quality were Mexico-Toluca highway, Reciclagua WWTP and Ixtlahuaca Municipality.
In the samples taken just after the end of the rainy season, 5 sampling points had WQI values between 50 and 75 (Toluca Norte, Santa Catarina, San Lorenzo, Temoaya and Tejalpa), i.e., medium quality and, at the other points, WQI values were between 25 and 50, which means that their quality was bad. The points with the worst quality were Mezapa Creek, Tenango Municipality and Reciclagua WWTP.
It is worth mentioning that there is a significant water quality deterioration in the Upper Lerma River Basin with the course of the years, since in the sampling campaign carried out in 2012 were found the lowest index values regarding 2005 and 2006; so it is imperative to implement measures to restore and preserve the water quality of this important river.
3.3. Water Quality Index (ICA) of the National Water Commission of Mexico
The results obtained in eight stations located along the Upper Lerma River in 2000, 2005 and 2010 show that water is heavily polluted, except in Atlacomulco and Mezapa stream where water quality is unacceptable (Figure 4). National Water Commision studies also reveal that water quality has worsened over time [10].
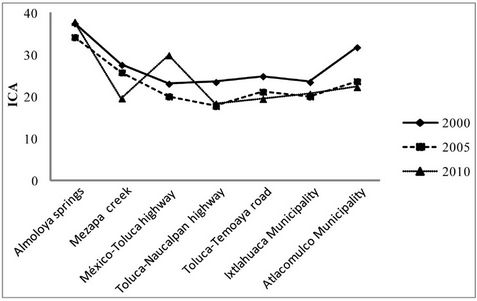
Figure 4. Results of Water Quality Indexes (ICA) of the National Water Commission of Mexico.
Classified by group, the main river pollutants are organic and coliforms (fecal and total), although it is also reported the presence of oil and grease. The results obtained at the monitoring stations reveal that Upper Lerma River water is inadequate for public water supply, recreation, fish and aquatic life [10].
For 2010, Lerma River had average values of 37.97 ICA in its upper portion, near Almoloya del Rio shallow lakes.
Downstream from Mezapa Creek in the metropolitan area of Toluca, water pollution of the Lerma River presents its highest levels, since the ICA values are lower than 19.7 and are the result of wastewater discharges from this city.
Following the mainstream, water quality improved to 22.4 in Atlacomulco Municipality and up to 39.6 in Solis Dam, located in Guanajuato State [10].
Although for WQI calculations are considered less parameters than for the ICA proposed by the National Water Commission, both indices yielded the same diagnosis about Lerma River quality. This is because all quality parameters taken in account in the WQI, except the temperature change, are contemplated in the ICA of the National Water Commission.
4. Conclusion
The WQI calculation revealed that water quality in the Upper Lerma River basin is bad, mainly associated with the high levels of BOD5, nitrates and phosphates found in it. The WQI calculations yielded the same diagnosis that the ICA from the National Water Commission of Mexico, in which was confirmed that along the Upper Lerma River, water quality is unacceptable. This problem is related to the overexploitation of aquifers and the serious deterioration in water quality due to uncontrolled discharge of municipal, industrial and agricultural wastewater, so it is imperative to implement strategies for the recovery and protection of this valuable resource.
REFERENCES
- Secretaría de Medio Ambiente y Recursos Naturales, “Water Statistics in Mexico (Estadísticas del Agua en México),” SEMARNAT, Mexico City, 2011.
- E. García and D. Falcón, “New Atlas Porrua of Mexico ( Atlas: Nuevo Atlas Porrúa de la República Mexicana),” Porrúa, Mexico City, 1974.
- I. D. Barceló-Quintal, “Study of Mobility of Ca, Cd, Cu, Fe, Mn, Pb and Zn in Sediments of José Antonio Alzate Dam in the State of Mexico (Estudio de la Movilidad de Ca, Cd, Cu, Fe, Mn, Pb y Zn en Sedimentos de la Presa José Antonio Alzate en el Estado de México),” Ph.D. Thesis, Autonomous University of the State of Mexico, 2000.
- R. M. Brown, N. I. McLelland, R. A. Deininger and M. F. O’Connor, “A Water Quality Index—Crashing the Psychological Barrier,” Indicators of Environmental Quality, Vol. 1, No. 1, 1972, pp. 173-178. doi:10.1007/978-1-4684-2856-8_15
- G. Bonanno and R. L. Giudice, “Application of Two Quality Indices as Monitoring and Management Tools of Rivers. Case Study: The Imera Meridonale River, Italy,” Environmental Management, Vol. 45, No. 4, 2010, pp. 856- 867. doi:10.1007/s00267-010-9450-1
- A. Akkoyunlu and M. E. Akiner “Pollution Evaluation in Streams Using Water Quality Indices: A Case Study from Turkey’s Sapanca Lake Basin,” Ecological Indicators, Vol. 18, No. 1, 2012, pp. 501-511. doi:10.1016/j.ecolind.2011.12.018
- L. E. P. Keith, “Sampling and Analysis Methods,” Lewis Publishers, Inc., Ann Arbor, 1992.
- APHA, AWWA, WEF, “Standard Methods for the Examination of Water and Wastewater,” 20th Edition, American Public Health Association, Washington DC, 1998.
- Comisión Nacional del Agua, “Ecological Criteria for Water Quality (Criterios Ecológicos de Calidad del Agua),” Diario Oficial de la Federación, Mexico City, 1989.
- Comisión Coordinadora para la Restauración de la Cuenca del Río Lerma, “Atlas of Lerma River Basin in the State of Mexico (Atlas de la Cuenca del Río Lerma en el Estado de México),” Biblioteca Mexiquense del Bicentenario, Toluca, 2011.
NOTES
*Corresponding author.