Journal of Environmental Protection
Vol. 4 No. 5 (2013) , Article ID: 31491 , 11 pages DOI:10.4236/jep.2013.45058
Rationalizing the Use of Water in Industry—Part 2: Instruments Developed by the Clean Technology Network in the State of Bahia
![]()
Federal University of Bahia (UFBA), Clean Technology Network of Bahia (TECLIM), Industrial Engineering Program (PEI), Rua Aristides Novis, Salvador, Brazil.
Email: asher@ufba.br, karlaesquerre@ufba.br, kalid@ufba.br, eas@ufba.br, engeuqui@gmail.com
Copyright © 2013 Asher Kiperstok et al. is an open access article distributed under the Creative Commons Attribution License, which permits unrestricted use, distribution, and reproduction in any medium, provided the original work is properly cited.
Received March 14th, 2013; revised April 17th, 2013; accepted May 15th, 2013
Keywords: Water; Effluent; Rationalization; Industry; Cleaner Production; Clean Technology Network (TECLIM)
ABSTRACT
The instruments developed by the Clean Technology Network of Bahia (TECLIM) at the Federal University of Bahia (UFBA) (cited in Part 1 of this paper) are presented. Factors regarding water management in industry were examined, on the basis of experience acquired over the period of a decade in cooperative research projects with large industrial process plants located mostly in the Camaçari Petrochemical Complex, Bahia State, Brazil. The main results consist of training about 1700 industry professionals in CP, the identification of about 500 ideas for the rationalization of water use, the presentation and publication of 90 articles in journals, conferences and other academic events, identification of ideas with potential water savings estimated at around 1400 t·h–1 and the reduction of at least 500 t·h–1 in effluents. Other sectors that make use of water, for example public buildings, commercial buildings, homes, shopping centers and airports can adapt and use the TECLIM method as will be exemplified.
1. Introduction
As cited by Kiperstok et al. (Part 1) [1], during the course of cooperative projects with industry, the Clean Technology Network (TECLIM) has developed a method for the optimization of water use in industries. This method is based on CP principles and is composed of some of its own instruments and others adapted from literature [2-5]:
I1. The merging of academic and operational/Industrial knowledge;
I2. The inclusion of CP concepts by means of continuous large-scale training;
I3. Construction of reconciled aqueous stream balances considering uncertainties in measurements;
I4. Compilation of a digital database of ideas that takes into account cultural, environmental and economic factors in evaluating the potential use and drawbacks of opportunities;
I5. The introduction of a geographical information system (GIS) to identify the sources of water (by producers or consumers) within the context of companies and in the region;
I6. Optimization of Mass Exchange Networks;
I7. Analysis of the region’s hydro and hydro-geological characteristics;
I8. Drawing up conceptual projects for reducing the use of water and generation of effluents;
I9. Auditing of the sources that give rise to the effluxents.
These instruments are described in the following sections considering their respective goals and results.
2. Instruments
2.1. The Merging of Academic and Operational/Industrial Knowledge
University-industry partnerships in the field of science and technology aim to transfer the knowledge generated within the universities to industries with a beneficial impact for society in general and local business/industry in particular. In these cooperative projects, the university increases its contribution to research through public and private financing and experiences current practice in industry [6,7].
There are clear differences between the culture of industrial and academic environments. Each has their own distinct objectives and working conditions, both in general terms and in the ways they seek to bring about environmental sustainability. Whereas the industrial sector faces situations that have to be deal with short or medium terms, with regard to creating, following and consolidating current practice and procedures, the academic world designs projects to be undertaken over a longer period of time. While the industrial sector requires immediate action, the academic world devotes time to formulating new theories. Evidently, bringing these two kinds of knowledge together can be of immense value to both areas, as there is already a great deal of mutual respect and willingness to achieve common goals [3].
To lower the barriers between academia and industry, a balance between academic goals and industrial priorities, involvement and commitment of the partners, mutual trust, and effective communication are the key factors. The quality of project management must respond to external changes or strategic addition of large doses of patience and hard work [8,9].
In the Industry-TECLIM partnerships the analysis of the water management in each company consists of an initial constructive stage for each research project. The objectives and expected results can thus be defined by taking this examination into account, together with the instruments that have been developed.
The team responsible for undertaking each project (called Eco-team) comprises graduate, post-graduate, master’s and doctorate researchers in chemistry, and in chemical, electrical, mechanical and environmental engineering, as well as engineering trainees. This Eco-team is supervised and supported by a team of coordinators (university lecturers) and facilitators from the industry.
In general terms, the activities can be divided into two distinct stages: In the first stage, the researchers concentrate their activities at the university and seek to gather information about the processes and historical background of the use of water and the generation of effluents. In the second stage, when the researchers have gained a degree of autonomy, they begin to work inside the battery limits of the industries. Computer-based support tools are used in the planning phase. This process is periodically kept under review and updated to take into account new information and the guidelines developed through the experience of approaching academic and operational knowledge.
Some managers and partners from both sides take part in an Advisory Council which is set up to monitor the preliminary policies and offer guidance to both the preparatory phase and the progress of the studies. This council plays a key role in the allocation of the company’s resources, mainly the work schedule of participants on the project, as the allocation of the funds are generally dealt with by the team leaders.
Another kind of interaction between the university and companies occurs through weekly meetings that are held with researchers and facilitators from the industry. These meetings are designed to oversee the progress of the studies, make recommendations and set out new actions. There are also less frequent meetings with the Advisory Council which, in turn, takes a close look at the suggestions made by the researchers involved in the project in the operational areas under study. In a project lasting two years, for example, the Advisory Council usually holds six meetings.
The monitoring of the environmental performance of the company with regard to its water consumption and generation of effluents is carried out by means of indicators dealing with the water consumption, the amount of effluent generated and the rate of production in the same period. The causes of the variations of these indicators are analyzed as a part of an optimization strategy to determine levels of water use and the reduction of the generation of effluents.
It should be stressed that 50% to 60% of the time spent on the project is invested in the collection, compilation and validation of the information collected.
2.2. Insertion of the CP Concepts through Continuous Large-Scale Training (I2)
To implement CP principles in industry all the employees should be involved, if possible [10]. Successfully implementation of this practice requires also appropriate training of all the Eco-team from the industry and the university [11].
The guidelines laid down by the Cleaner Production (CP) are used to oversee the work carried out in each company and to identify the causes of unnecessary water usage and the generation of effluents inside the battery limits (and not just on the margins). The purpose of this activity is to heighten the awareness of the operators and engineers about how water is managed inside the Industry. It requires stopping the delegation of issues concerning water usage and the generation of effluents to third parties.
The personnel are placed at the forefront of the challenge of creating environmental sustainability by employing eco-efficient factors (Factor 10 and Factor X, according to Graedel and Allenby [12]). This approach highlights the inefficiency associated with the end of pipe solutions and stresses the need to find a solution that addresses the core of the problem—the source of the water waste. Only after reducing the problems at the source can new ways be sought by the Eco-team for the reuse and recycling of effluents. In all circumstances, effluent must be regarded a fluid that forms part of the production processes despite its inferior quality. Alternative forms of treatment and disposal may also be considered, but only as a last resort.
The complexity of the processes and the lack of and often poorly organized information available are among the difficulties to be overcome, thus requiring both structured and systemic method of data collection and management. The inclusion of the CP concepts presupposes a change in the culture of the company. How can the cultural barriers be broken to allow the CP concepts to be effectively incorporated? How can people be dislodged from their respective comfort zones and moved to a region where they must learn and create? Changes of such magnitude may arise from the knowledge of the flows handled by the operators, structured by a water balance, and with large-scale training of professionals through a culture of continuous learning.
In the developed method, the concepts of CP are usually taught in courses lasting for 12 hours and running in 2 stages. The course is offered to the whole group of operators and engineers, although it can and should be extended to all the company (including the third-party companies).
In the first stage of the course, an attempt is made to increase the awareness of the participants in matters regarding the consumption of natural resources and to shift their attention from the so-called end of pipe technology to the source of inefficient water use in the upstream and downstream processes themselves and their relations with other processes in the productive sector. There is a review of a conceptual and simplified version of the method for CP offered by UNEP/UNIDO/CNTL [UN Environment Program/UN Industrial Development Organization/National Center for Clean Technologies] (FIESP—Federation of Industries in the State of São Paulo [13]). After dividing the participants into assorted teams (reflecting different sectors of the process) of four or five people, each team is encouraged to develop a project by using CP concepts to find new ways to improve the environmental performance of the company, including in the operational and administrative areas.
The teams have a one-month deadline to carry out this project, and then they show the results in the second stage of the course. The researchers on the project also attend the course and support the teams by structuring the new opportunities that have been found. After the teams have explained their ideas and suggestions, environmental, operational and economic factors are raised such as the area and equipment involved, the estimated savings of water and the funding required for their implementation.
The ideas are registered and assorted in a digital database of ideas (see instrument I4) which is periodically analyzed by the Eco-team to determine the technical and financial feasibility of these ideas and whether (after examining them in greater depth) they might lead to conceptual projects which can be carried out by researchers together with a specialist team of technicians from the company. This training fosters each participant to seek eco-efficiency in the workplace as well as in their own private lives.
Apart from the CP course, the members of the Ecoteam undergo an intensive training sessions which are given at the beginning of the project. These courses and lectures are open to the whole university and to every company employee. Table 1 shows a list of the main courses generally undertaken.
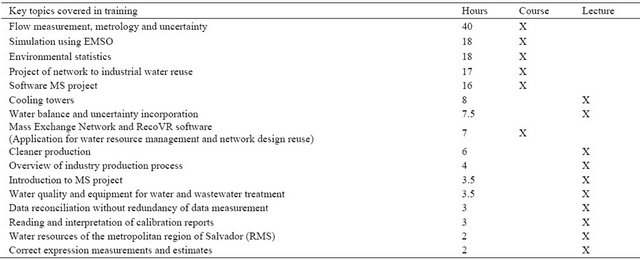
Table 1. List of training offered in the beginning of the projects.
2.3. Water Balance and Data Reconciliation (I3)
The lack of measurement of water flows in processes is a constant source of problems in industrial plants. This arises either because there is a lack of measuring devices or from the fact that they are not handled correctly. Both cases reflect the low priority attributed to water management in industry. This scenario has been addressed by constructing water balances using the few measured aqueous flows, and the other values being estimated.
This instrument represents the rate of the aqueous flow at the entrance and exit points with an approach that involves various control volumes (for example regional, industrial plant, areas and units of production).
The study of the mass flow of aqueous streams either in the form of water supply (untreated, clarified, demineralized and drinkable), steam (under various thermodynamic conditions), condensate (clean or contaminated) or effluents (of the most varied kinds) allows the team to trace a water profile in the factory and thus enable improvements in the management of this resource. As a result, all kinds of data about the flow can be used whether they originate from measuring devices which are rarely calibrated, or estimates of the flow obtained by means of mass balance, effective spot measurements, project data, theoretical estimates, simulation or even information collected in the unit through interviews with the operators. This search for information together with the involvement of the company’s personnel to find ways to reduce water use constitutes one of the most important stages in the whole process.
Each source of information is assigned a score (QI)— the degree of reliability or the Quality of Information. A macro-perspective can be obtained from the global Water Balance. This covers the most comprehensive control volumes at the entrance and exit points of the industrial plant, see Figure 1. More specific perspectives can be obtained by identifying the currents at the entrance and exit points of each unit or piece of equipment.
All the data in the Water Balances (viewed in general terms and per unit of operation) are compiled in electronic spreadsheets and represented in the form of a block diagram. Each block represents one of the production
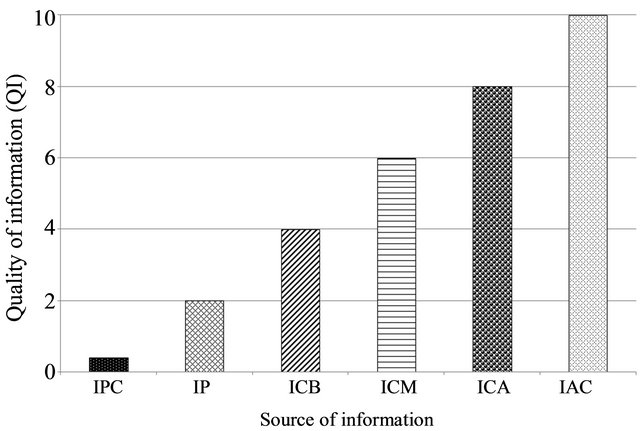
Figure 1. Global Balance—the main entrance and exit currents. Source: Kiperstok et al. [2].
units or even each kind of equipment (identified through its Business Identity Code—ID or TAG number). Each connecting line in these blocks indicates the aqueous currents that flow in or out and the arrows indicate the direction of the flow. The lines are represented in different ways depending on the type of current-dashed, colored or with an acronym in the caption.
To compare the currents, the data are represented on a continuous base-line in t/h. A quality of information (QI) score is linked to each part of the information about the flow. Information uncertainty, which is in inverse proportion to the QI, can be attributed to the method used to obtain this information. Initially, the QI values between 0.4 and 10 are given for each aqueous current under consideration [5] where the score of 0.4 refers to a rough estimate and a score of 10 is given in cases where there is a calibrated measuring device (Figure 2).
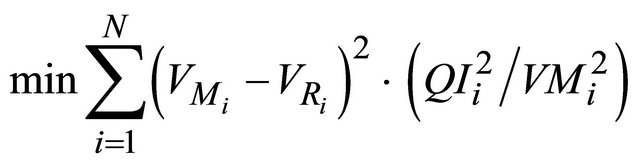
One possible way of assessing the value of the global QI of the various control volumes is to make a calculation of a representative QI of the amount under consideration by weighing the values of the flow and the QI of the known currents (Equation (1)).
Figure 2. Attributed values for the Quality of Information (QI) of the rates of flow that are taken into account in the Water Balance. Source of Information: UI: unreliable information—based on rough estimates; PI: information of slight reliability—simulation and/or based on old projects and rough measurements; ILR: information of low reliability based on operational and descriptive records of outdated processes; estimates made by engineers or operators who have worked in the unit or based on a device used for detecting lack of calibration; IAR: information of average reliability—information supplied by engineers and operators with little experience and metering in normal operating conditions; HRI: highly reliable information—information which is validated by the operation and/or engineering and current simulation or project, and with a history of metering in normal operating conditions; ERI: extremely reliable information—measuring with a calibration device, simulation of the processes validated by the engineer and information supplied by engineers and operators who have a good deal of experience and are still active in the area.
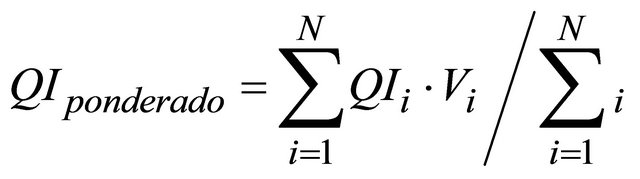 (1)
(1)
where QI is the quality of information attributed to the value of the flow i; Vi is the value of flow of the water current i and N is the number of streams considered.
One way to improve uncertainty distributions and ensure that the information complies with the determined restrictions imposed on the process (Deviation = 0) consists of applying the data reconciliation of the mapped flow rates [14]. On the basis of the flow data associated with its quality (QI), data reconciliation seeks new flow values that can satisfy the mass balance equations by means of mathematical optimization techniques. This operation reduces the difference between the original values and the reconciled flow values.
The difficulty in using a typical formulation for the problem of data reconciliation lies in the need to know the uncertainty of the estimated data [15]. To overcome this difficulty we developed a relationship between QI and the uncertainty of the data [5] as shown in Equation (2).
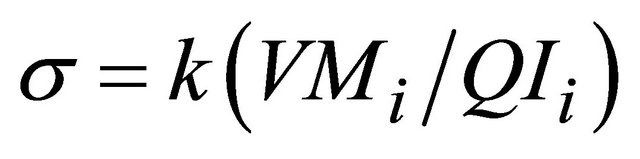 (2)
(2)
The k parameter is constant in a water balance, so the objective function of the data reconciliation can be rewritten in terms of QI and without this parameter, see Equation (3).
The TECLIM/UFBA method suggests a way of circumventing this problem by using the formulation outlined in Equation 3 that regards the QI as having a behavior that is the inverse of uncertainty. The problem of optimization can be solved, for example, by using the optimization toolbox from the MATLAB software and introducing the flow data and the QI that is available in the electronic spreadsheets. This stage of the data reconciliation is essential to increase the reliability of the mass balance.
 (3)
(3)
where: VR and VM are the flow rates that are reconciled and mapped (or presumed to be mapped) with reference to current i; N is the number of currents involved.
After reconciliation the uncertainty and QI can be evaluated by propagation on uncertainty [16,17].
2.4. Implementation of a Bank of Ideas (I4)
Environmental optimization of industry involves extensive work in identifying opportunities to improve productive processes and thus the management of these opportunities becomes of decisive importance when making use of the creative potential of the participants and collaborators. A Bank of Ideas was developed to allow a continuous flow of records to be kept for subsequent analysis of prospective ideas/suggestions facilitating the participants and collaborators from the companies to become involved in the process of rationalizing water use.
The instrument is set within the vision of the method Front-End Loading (FEL) for project management. FEL was developed by IPA (Independent Project Analysis) and is mainly applied in investment projects in order to reduce the risks involved in decision-making as well as costs related to reworking and redesigning [18,19]. This method is applied as a lever in the early stages of a project (initiating and planning) that directly impact the success of the project. The Bank of Ideas in TECLIM’s Method was developed with the same goals as FEL; to increase the likelihood that only the ideas that are well developed become conceptual projects (Instrument I8).
The structure of the Bank of Ideas involves a database in which the information of each idea and user can be stored. The operation of this database can be divided into two periods. The first involves the registering of suggestions by the users and the second the administrative work carried out by the Eco-team. The users are asked to register their ideas and carry out periodic check-ups, while relying on the Eco-team to help them to proceed with their studies. In contrast, the Eco-team has to make a disclosure of the contents of the database, correct any mistakes in the ideas already registered, encourage and publish an assessment of the ideas, and seek sources that can lead to improvements to make each idea more viable.
In the evaluation stage, the ideas that have the greatest potential to be turned into opportunities are identified. This is done by sorting the ideas into the different Industrial areas to which they are linked. At the same time, the Eco-team selects employees from the company to assess the ideas that correspond to their respective areas. When the idea concerns more than one area of the industrial plant or can be applied to the whole industry, the group of assessors is composed of researchers who are involved in the project and company employees that have comprehensive knowledge of the productive process. An evaluation form was structured to give support to the stage of assessing the ideas suggested. In undertaking this, three aspects of each idea are assessed:
1) Environmental factors: regarding the reduction of water consumption or wastewater generation, for example;
2) Cultural (or psycho-social) factors such as changes in attitude and behavior both within and outside the industrial plant;
3) Economic/financial factors: the estimated financial return that can be made on an investment by putting a new opportunity into effect.
Table 2 shows an example of the percentage bands and approximate values (in R$) which are used to carry out the assessment of the respective environmental, cultural and financial factors. On a scale of 1 to 5, the ideas that are technically the easiest to implement and that can have the most beneficial effect on environmental Industrial relations are given the highest scores.
The weighted averages of the scores assigned to each idea by the evaluators are calculated and shown in the graph displaying the ranking of opportunities, see Figure 3.
The ideas located in the upper left-hand square are, theoretically, those whose implementation would bring about the most positive effects with the least financial investment being made, suggesting that they should have priority for study. As for the ideas placed in the upper right-hand square, these require more funding, although they show the same positive effects. In contrast, the lower left-hand square brings together the ideas that require less financial investment and have a less attractive effect while in the lower right-hand square, the ideas are not appealing. This stage completes the final objective of the management of the Ideas Bank: to identify the ideas that have the best prospects of being turned into opportunities.
2.5. The Geographical Information System—GIS (I5)
The spatial representation of the area under study is of crucial importance in giving assistance both to decisionmaking on how to use the aqueous flows at each point of the process as well as to design strategies to improve the use of the hydric resources available in the surrounding area of each company and region.
The Geographical Information System (GIS) is introduced with the aim of providing an integrated view of the area where each project takes place and, more specifically, of forging links between the sources and consumers of water, which are represented by geographical coordinates. The purpose of this instrument is to serve as a basis for making an assessment of the costs incurred in linking up the effluent flows with their destinations.
Important information for water reuse modeling includes: equipment and process unity location (to determine the distance between points), relative elevation (to determine the need for pumping) and water properties such as quality at the input and output of a particular process or equipment. Based on this information GIS creates possible paths of exchange, which will be evaluated by the Eco-team for their ability to minimize water and wastewater costs and reduce environmental impacts [20].
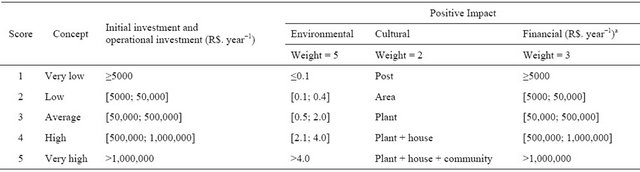
Table 2. Scores to evaluate the positive effects of an idea.
aThe range of values should be compatible with the total assets of the industrial plants.
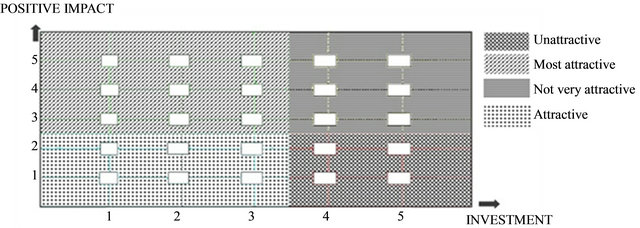
Figure 3. Graph showing the ranking of opportunities. Source: www.TECLIM.ufba.br/ideia.
The system is also capable of determining which localities are the most suitable for the installation of equipment that can restore the quality of the aqueous currents being reused. This instrument allows an exploratory analysis of information to be undertaken through an aggregation of spatial representation and its respective attributes of alphanumeric data linked to a database. Furthermore, it may allow new scenarios to emerge and thus facilitate decision-making.
The construction of an Information System Platform for the industrial management of water and effluents can be divided into three stages:
• The reproduction of the real world (the companies) in an analytical virtual world: characterization of the companies based on the productive sources of water and effluents, the points of water consumption, and the particular hydro and hydro-geological features of the locality and the region.
• The setting up and utilization of the database with information gathered from the company or even external sources of data, including information concerning the water availability of the region.
• Identification and analyses of the opportunities regarding rational use of water and the reduction of the generation of effluents, as well as integration of the data from the conceptual projects proposed from the application of the instruments I4 and I8.
After this stage, GIS becomes a constant feature and every new piece of data should be incorporated. This instrument may be used as an aid for the water management and/or monitoring system
2.6. Optimization of the Mass Exchange Network (I6)
Water consumption reduction practices when dealing with a great amount of streams generally imply the synthesis of Mass Exchange Networks (MEN). These either use generalized optimization methods [21-24] or the water pinch analytical method, as outlined by Alva-Argáez et al. [25], Smith and Petela [26],Wang and Smith [27] and Ruiz [28].
According to Smith and Petela [26], the traditional procedures for reducing water use, such as changes in washing systems, have achieved a reduction of 30% - 60% of untreated water consumption in industrial applications when complemented with the water pinch method. An alternative method makes use of the Water Sources Diagram—WSD [29,30] to reduce the consumption of water and generation of effluents. In both cases, most of the time, some additional equipment is required to treat some streams to allow their reinsertion on the process.
The objectives of the optimization of MEN consist of developing and applying technologies, and methods that can make industrial processes more eco-efficient. This is achieved by using synthesis and optimization tools, economic engineering, and thermodynamic principles of mass exchange to design MENs with the minimum use of natural resources.
After constructing the water balance, the information is compiled in a table called a Challenge Table, which contains a detailed list of the information of every stream taking part in the hydric balance.
The following information can be obtained from the Challenge Table, after using techniques for integrating the processes: the required capacities for the treatment operations of the effluents, an estimate of the financial investment needed, and an estimate of the reduction in water consumption.
In the early stages, research groups were invited to work directly with optimization by using a Water Sources Diagram (WSD) [31]. One of the reasons for this was to make it easier for the engineers in the plants to understand and to adopt the method.
Some work has been carried out with the aid of the WSD methodology, including some Master’s degree dissertations under the combined supervision of the lecturers of the Clean Technology Network (UFBA) and academics from outside UFRJ (Federal University of Rio de Janeiro) [30]. Despite the difficulty of working with real cases, with multi-component streams, poor measuring devices and historical data that have not been consolidated, the application of the method can identify a wide range of opportunities to reuse intermediate streams or other external sources of water. This can increase the efficiency in water use, if the final recommendations are put into effect.
Complete development of the MEN synthesis has not yet been reached for any of the industrial plants where they have been put into effect. The three main reasons for this are as follows: a lack of proper information regarding the aqueous flows at the level of the process, difficultties in attributing values to the maximum concentrations of a particular pollutant that has to be taken into account in the water that enters the processes, and finally, the fact that the methods that are applicable to the multicomponent processes are still at an early stage of development. Despite this, some recommendations were implemented to a lesser extent, with success in some of the TECLIM partners’ sites.
2.7. Analysis of the Insertion of the Company in the Regional Hydrological Cycle (I7)
The main purpose of the studies undertaken regarding the influence of the company activities on the regional water cycle is to assess the effectiveness of measures taken for the protection, preservation and remediation of surface and subterranean water resources in the region. These activities take into account the assessment of the hydrological and hydrogeological features of the region and make it possible to set out the extent of the beneficial effects that any reduction in water consumption and generation of effluents can have beyond the boundaries of the company.
In addition, conducting a survey of the potential supplies of water in the region can enable the Eco-team to draw up strategies based on the Life Cycle Analysis (LCA) to improve water usage, taking into account its quality and the logistical factors involved in its use, as well as the need to find alternative sources of water supply and effluent disposal in the area, if needed.
2.8. Conceptual Project Design (I8)
The conceptual projects reflect the results of incorporating P + L concepts in the company and are based on the ideas registered in the Database of Ideas (Instrument I4). They undergo a preliminary analysis and take into account the spatial representation of the area under study (Instrument I5). At this stage, a multidisciplinary team is desirable, together with a training scheme, to deal with the different technical requirements of each company in preparing a conceptual project design.
Among other activities, these requirements involve working out strategies for introducing the idea, preliminary economical/financial feasibility studies, Hazards and Operability Analysis (HAZOP) and Failure Mode and Effects Analysis (FEMEA). Obviously, a review of the data regarding the consumption of utilities and raw materials, the effluents generated and the disposal systems is essential.
The schemes for the reduction and reuse of water and effluents within the units of the production process are drawn up based on project data, operating manuals, stream data from the Water Balance and the quality of the water and effluents found in the Challenge Table, as well as the information derived from various discussions with engineers and operators. As the aim of the TECLIM method does not include the development of detailed or engineering projects, it is usual to remain in contact with collaborators from the company for assistance.
2.9. Auditing Sources of Effluent (I9)
The aim of auditing effluent streams is to define actions and procedures to reduce the volume of both organic and inorganic effluents within each process unit. Another objective is to improve the quality of effluent by minimizing the undesirable loss of products through these streams.
The method uses the techniques mentioned in Avila [32,33]. One expected result from the application of this method consists of increasing the load and continuity of the production process due to its higher stability. It is also expected to improve the Eco-efficiency with a reduction of losses thereby improving the company’s image internally and externally with increased customer satisfaction
3. Results
General results in terms of reduction in water use and effluent generation were shown in the first part of this paper [1]. Further specific benefits obtained through the application of the instruments described here were presented. At least 90 technical articles directly related to the projects have already been published in journals, conferences and other academic events.
The estimated environmental benefits in terms of water and wastewater reductions based on the identified opportunities are summarized in Table 3.
The results shown in Table 3 consist of training about 1700 industry professionals in CP, the identification of about 500 ideas for the rationalization of water use and identification of ideas with potential water savings estimated at around 1400 t·h−1 and reduction of at least 500 t·h−1 of effluents.
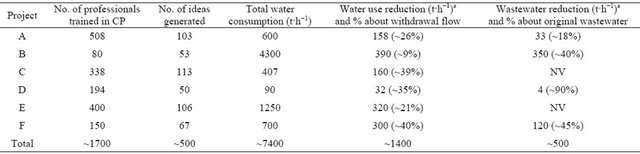
Table 3. Environmental benefits related to each research project.
Avalues may change in ±20%; NV = not valued.
The attribution of the Quality of Information (QI) is a means itself of improving the efficiency of the process, and helps to establish priorities during the optimization step. The water balance has helped in the identification of the water flows (and their respective QI) which has to be considered for improvements an each process unit. In mapping out the aqueous flows, for example, company B found that 20% of them had not been taken into account by its information system [34].
With regard to the data reconciliation of the water balance, the big difference between the method developed by TECLIM and traditional methods is that the divergent information is not just eliminated from the objective function but is considered for a re-evaluation of its QI. This approach allows the data reconciliation to occur without any redundancy of measurement, which is normally required in the composition of the water balances.
The reconciliation of the water balance has already revealed serious errors of measurement that were not noted by the measurement systems of the companies being studied. For example, an error of 10% or more in the measurement of a flow of effluent sent to a treatment plant in a calibrated instrument was found. This value was of significance to the company owing to the volume of effluents generated (about 500 t·h−1) and the considerable cost of the treatment. Another failing identified by the reconciliation was in a company that had operated for many years on the basis of two aqueous currents that had been mixed up. The reconciliation revealed this error and discussions between the UFBA team and the company staff led to the discovery of the existence of a mixed measurement in the DSDC (Digital System of Distributed Control) following an inspection of the system.
Apart from the data collection and the attribution of the quality of information, attempts have also been made to tackle the problem of finding the best effluent allocation such as the water used in the process, by employing the geographical information system.
GIS enables engineers to make a quick assessment of the necessary logistical issues (distance, quotas, removal of obstacles, free passage) for mass exchange from one point of the plant to another. In this way, ideas that are less viable can be swiftly rejected. GIS was also used to define the areas that could benefit from the use of collected rainfall and it also identifies the companies that are impacting the water cycle of the region where they are based more. This instrument was very useful in all the projects carried out.
The analysis of the way the company is incorporated in the hydrological cycle led to a reduction in the water withdrawal from the water sources that supply the Industrial Complex where most of the companies being studied are situated. The search for alternative water supplies in this complex led to the identification of three contention basins of rainfall and inorganic effluents [35,36] and a hydraulic barrier system with 9 extraction points of contaminated ground water [35] that are potential alternative water suppliers.
These alternative water sources offer ways of managing the water flow to the companies by broadening the forms of supply and releasing it from its dependency on the actual water sources, while at the same time increasing the water supply to the region during periods when there are seasonal fluctuations of availability.
The potential use of water provided by two basins when combined corresponds to 24% of the total amount of water required by the Industrial Complex [36]. Apart from a reduction in the amount of water extracted, the studies revealed a reduction in expenditure on energy in water withdrawal, and effluent (and contaminated rain water) treatment and disposal.
Some improvements may continue to be made in the all companies after the end of each project with UFBA due in part to the ideas that emerged and became conceptual projects which were routinely entered in the portfolio of the company’s projects. The auditing of the sources of effluents allows the companies to reduce generation by controlling the source of waste, one of the most important assumptions of CP. In most cases, the company was able to lower its effluent treatment costs, reduce raw materials and input flows resulting from the minimization of discharges and leaks, and ceases to pay burdensome fines for releasing high amounts of contaminants that exceed the levels permitted by the environment regulations.
The method developed in projects with industry has been adapted and expanded to other sectors that make use of water. Several projects have been carried out by TECLIM in urban settings such as public buildings, an airport, shopping centers and homes (www.teclim.ufba. br).
The method is currently being improved and new instruments are in development in current projects such as: environmental modeling and simulation of industrial processes; calculation of environmental indicators and its uncertainty from reconciled mass balance; supervision and monitoring of water consumption through the virtual system AGUAPURA (www.teclim.ufba.br/aguapura) and evaluation of impacts of projects in company after termination.
4. Conclusions
The TECLIM/ UFBA team is mainly concerned with conducting detailed investigation which involves identifying, analyzing and making recommendations on Industrial water systems, and thus breaking the pattern of inertia inside the industries regarding the close monitoring of water use.
The main results consist of the training of about 1700 industry professionals in Cleaner Production concepts, the identification of about 500 ideas of rationalization in water use, presentation and publication of 90 articles in journals, conferences and other academic events, identification of ideas with estimated potential savings of water of around 1400 t·h−1 and reducing effluent by at least 500 t·h−1.
The instruments developed and presented here have led to the expansion of the method to home water reuse and urban issues that are also under consideration by the TECLIM Network.
5. Acknowledgements
The authors gratefully acknowledge the financial support given by FINEP (State Agency for Innovation) and the industries for the financial and technical support. Special thanks go to all the researchers which were part of the project’s teams.
REFERENCES
- A. Kiperstok, R. Kalid, K. P. Oliveira-Esquerre, E. Sales and G. Oliveira, “Rationalizing the Use of Water in Industry—Part 1: Summary of the Instruments Developed by the Clean Technology Network in the State of Bahia and Main Results Obtained,” Journal of Environmental Protection, 2013.
- A. Kiperstok, A. H. Tanimoto, D. Fontana, E. H. B. C. Silva, J. Mendonça, L. P. Lacerda, L. Pustilnik, L. F. Cardoso, R. Kalid and A. Teixeira, “The Fundamental Principles of Clean Production. Silver House: Introducing Clean Production in Bahia,” Clean Technology Network (TECLIM), Federal University of Bahia (UFBA), Bahia, 2008, 446 p.
- A. Kiperstok, G. L. Oliveira, K. P. Oliveira-Esquerre and R. Kalid, “Conservation of Water Resources in Semi-Arid Region Compared to Industrial Development,” In: S. S. Medeiros, H. R. Gheyi, C. O. Galvão and V. P. S. Paz, Eds., Hydric Resources in Arid and Semi-Arid Regions, National Institute of Semiarid, Campina Grande, 2011, pp. 207-247.
- K. P. Oliveira-Esquerre, A. Kiperstok, E. Cohim, R. Kalid, E. A. Sales and V. M. Pires, “Taking Advantage of Storm and Waste Water Retention Basins as Part of Water Use Minimization in Industrial Sites,” Resources, Conservation and Recycling, Vol. 55, No. 3, 2011, pp. 316- 324. doi:10.1016/j.resconrec.2010.10.004
- M. Martins, C. Amaro, L. Souza, R. Kalid and A. Kiperstok, “New Objective Function to Data Reconciliation of Water Balance,” Journal of Cleaner Production, Vol. 18, No. 12, 2010, pp. 1184-1189. doi:10.1016/j.jclepro.2010.03.014
- L. L. Massay and S. J. Udoka, “Industry-University Partnerships: A Model for Engineering Education in the 21st Century,” Computers & Industrial Engineering, Vol. 29, No. 1-4, 1995, pp. 77-81.
- R. M. Davies, “Industry-University Collaborations: A Necessity for the Future,” Journal of Dentistry, Vol. 4, No. 1-2, 1996, pp. 3-5. doi:10.1016/0300-5712(95)00005-4
- T. Barnes, I. Pashby and A. Gibbons, “Industry Interaction: A Multi-Case Evaluation of Collaborative R&D Projects,” European Management Journal, Vol. 20, No. 3, 2001, pp. 272-285. doi:10.1016/S0263-2373(02)00044-0
- J. Bruneel, P. D’Este and A. Salter, “Investigating the Factors That Diminish the Barriers to University-Industry Collaboration,” Research Policy, Vol. 39, No. 7, 2010, pp. 858-868. doi:10.1016/j.respol.2010.03.006
- J. Venselaar, “Environmental Training: Industrial Needs,” Journal of Cleaner Production, Vol. 3, No. 1-2, 1995, pp. 9-12. doi:10.1016/0959-6526(95)00030-I
- S. Herat, “Education and Training for Cleaner Production; a Feasible Learning Approach,” Journal of Cleaner Production, Vol. 8, No. 5, 2000, pp. 361-364. doi:10.1016/S0959-6526(00)00038-X
- T. E. Graedel and B. R. Allenby, “Industrial Ecology,” Prentice Hall, New Jersey, 1995.
- FIESP—Federation of Industries of the State of São Paulo, “Water Use and Conservation: Manual to Orient Industrial Sector,” 2009. http://www.fiesp.com.br/publicacoes/pdf/ambiente/reuso.pdf
- J. A. Romagnoli and M. C. Sánchez, “Data Processing and Reconciliation for Chemical Process Operations,” Academic Press Inc., San Diego, 2000.
- D. Fontana, R. Kalid, A. Kiperstok and M. A. S. Silva, “Methodology for Wastewater Minimization in Industries in the Petrochemical Complex,” Proceedings of the 2nd Mercosur Congress on Chemical Engineering and 4th Mercosur Congress on Process Systems Engineering, Rio de Janeiro, 14-18 August 2004.
- L. S. de Souza, “Propagation of Uncertainty in the Data Reconciliation with Linear Constraints,” Monograph (Specialization in Industrial Automation with Emphasis in Computer Science, Instrumentation, Control and Optimization of Continuous Processes), Federal University of Bahia, Salvador, 2011.
- L. S. Souza, R. A. Kalid, M. A. F. Martins, A. Kiperstok, K. Oliveira-Esquerre and L. Queiroz, “Propagation of Uncertainties in Data Reconciliation Without Redundancy Measurement,” The 6th Brazilian Congress of Metrology, Natal, 27-30 September 2011.
- R. Batavia, “Front-End Loading for Life Cycle Success,” Offshore Technology Conference, Texas, 30 April-3 May 2001.
- L. Saputelli, L. Lujan, L. Garibaldi, J. Smyth, A. Ungredda, J. Rodriguez and A. S. Cullick, “How Integrated Field Studies Help Asset Team Make Optimal Field Development Decisions,” Proceeding of the Society of Petroleum Engineering, 31 March-02 April 2008.
- C. E. Nobel and D. T. Allen, “Using Geographic Information Systems (GIS) in Industrial Water Reuse Modeling,” Chemical Engineering Research & Design, Vol. 78, No. 4, 2000, pp. 295-303.
- M. M. El-Halwagi and V. Manousiouthakis, “Synthesis of Mass Exchange Networks,” General & Introductory Chemical Engineering, Vol. 35, No. 8, 1989, pp. 1233-1244. doi:10.1002/aic.690350802
- K. P. Papalexandri, E. N. Pistikopoulos and C. A. Floudas, “Mass Exchange Networks for Waste Minimization: A Simultaneous Approach,” Chemical Engineering Research & Design, Vol. 72, No. A3, 1994, pp. 279-294.
- P. N. Sharratt and A. Kiperstok, “Environmental Optimisation of Releases from Industrial Sites into a Linear Receiving Body,” Computers & Chemical Engineering, Vol. 20, Suppl. 2, 1996, pp. 1413-1418. doi:10.1016/0098-1354(96)00242-6
- A. A. Ulson de Souza, H. L. Forgiarini, M. F. Xavier, F. L. P. Pessoa and S. M. A. Guelli de Souza, “Application of Water Source Diagram (WSD) Method for the Reduction of Water Consumption in Petroleum Refineries,” Resources, Conservation and Recycling, Vol. 53, No. 3, 2009, pp. 149-154. doi:10.1016/j.resconrec.2008.11.002
- A. Alva-Argáez, A. C. Kokossis and R. Smith, “The DeSign of Water-Using Systems in Petroleum Refining Using a Water-Pinch Decomposition,” Chemical Engineering Journal, Vol. 128, No. 1, 2007, pp. 33-46. doi:10.1016/j.cej.2006.10.001
- R. Smith and E. Petela, “Water Minimisation in the ProcEss Industries. Parts 5: Utility Waste,” The Chemical Engineer, Vol. 523, Part 5, 1992, pp. 32-35.
- Y. P. Wang and R. Smith, “Wastewater Minimisation,” Che- mical Engineering Science, Vol. 49, No. 7, 1994, pp. 981- 1006.
- J. A. C. Ruiz, “Decision Support Tools for Environmental Conscious Chemical Process,” Thesis, Massachusetts Institute of Technology, Cambridge, 2000.
- F. L. P. Pessoa, “Water Source Diagram. Course Handout on Methodology for Optimizing Environmental TECLIM. Tools to Minimize Water Use in an Industrial Environment,” Federal University of Bahia, Salvador, 2008.
- R. C. Moreira, “Reduction of Effluents in the Industrial Water Treatment Unit,” Master’s Dissertation, Federal University of Bahia, Salvador, 2009.
- E. M. Queiroz and F. L. P. Pessoa, “Water Source Diagram Procedure: Wastewater Reduction for Single Contaminant,” 17th International Congress of Chemical and Process Engineering, Praga, 27-31 August 2006.
- S. F. Ávila, “Methodology for Minimizing Waste at Source from the Investigation of Abnormal Operating,” Master Dissertation, Federal University of Bahia, Salvador, 2004.
- S. F. Ávila, “Control Processes in the Generation of Organic Effluent,” 35th Brazilian Congress of Chemical Engineering, Salvador, 1995.
- K. P. Oliveira-Esquerre, A. Kiperstok, R. A. Kalid, E. Sales, L. Teixeira and V. M. Pires, “Water and Wastewater Management in a Petrochemical Raw Material Industry,” 10th International Symposium on Process Engineering, Salvador, 16-20 August 2009, pp. 1047-1052.
- K. P. Oliveira-Esquerre, A. Kiperstok, P. R. C, Penalva, R. Kalid and P. P. Quirino, “Study of the Potential for the Reuse of Exploited Water by the Hydraulic Barrier System of Camaçari Industrial Pole of Bahia,” 8th Symposium Luso-Brazil of Sanitation and Environmental Engineering, Silubesa Belém, 10-14 March 2008.
- K. P. Oliveira-Esquerre, A. Kiperstok, E. Cohim, R. Kalid, E. A. Sales and V. M. Pires, “Taking Advantage of Storm and Waste Water Retention Basins as Part of Water Use Minimization in Industrial Sites,” Resources, Conservation and Recycling, Vol. 55, No. 3, 2011, pp. 316-324. doi:10.1016/j.resconrec.2010.10.004