Journal of Environmental Protection
Vol. 3 No. 2 (2012) , Article ID: 17470 , 8 pages DOI:10.4236/jep.2012.32028
Agrochemical Concentration Level in Zaria Dam Reservoir and Ground Waters in the Environs
![]()
1Department of Civil Engineering, Ahmadu Bello University, Zaria, Nigeria; 2Department of Mass Housing, Federal Capital Territory Development Authority (FCDA), Abuja, Nigeria.
Email: hamidap01@yahoo.co.uk
Received November 21st, 2011; revised December 25th, 2011; accepted January 19th, 2012
Keywords: Surface and Ground Water Qualities; Agrochemicals; Mean Concentration Levels
ABSTRACT
This study examines the effect of agrochemical used for faming in the Galma Dam area on the quality of water in the reservoir and well water around the reservoir. Nine sampling points upstream of the Galma Dam were randomly selected for the study. Also, six hand dug wells in use by adjacent communities were identified for ground water samples. The study covered the period July to September 2011. All measurements were in accordance with the Standard Methods for the Examination of Water and Wastewater. The parameters measured and their mean concentrations from the reservoir are in the order of: Chlorides (0.600 - 0.900 mg/l); Nitrates (0.009 - 0.019 mg/l); Bicarbonates; 0.444 - 1.900 mg/l); Total Phosphates (0.173 - 3.077 mg/l); Sulphates (0.617 - 3.587 mg/l); and pH (6.4 - 7.5). For the well water samples, the results ranged from 1.58 - 3.10 mg/l; 0.14 - 0.03 mg/l; 0.60 - 2.73 mg/l; 0.08 - 1.89 mg/l; 0.33 - 2.66 mg/l and 6.05 - 7.0 respectively in the order previously listed. The results were statistically analyzed using ANOVA at 95% confidence level. Chlorides showed no significant variation between sampling points but significant variation with dates of sampling for surface and well waters. Nitrates variations with both sampling points and dates of sampling were insignificant. Bicarbonates variations with sampling points and dates of sampling were highly significant. Total Phosphates and Sulphates variations with sampling points and dates of sampling were insignificant and significant respectively. pH values variations with sampling points and dates of sampling were insignificant and highly significant respectively. Generally, the mean concentrations are within the WHO maximum limits of the parameters in drinking water and recommendations were made regarding the use of agrochemicals for farming in the area.
1. Introduction
Zaria dam was constructed in 1975 on the river Galma to carter for Zaria township water supply and other benefits. The dam has a designed live reservoir capacity of 15.875 million m3, length of 900 metres and a maximum height of 15 metres from the river bed [1].
Although the dam was constructed mainly for water supply, farming activities mainly by people living around the reservoir has been substantial over the years. These farmers use varieties of agrochemicals including fertilizers and pesticides. Among the indicators for the presence of fertilizers are Nitrates and Phosphates [2,3].
Pesticides include herbicides, insecticides, fungicides, rodenticides, pediculicides, biocides, etc. [4]. The correct application of agrochemical to specified guidelines was found to enhance crop yield to about fourfold the amount spent on pesticides [5] but not without consequences on the environment and rural water sources. Failure to apply pesticide on the farm was observed to reduce crop yield by about 10% [6] while its application in excess of plant requirements leaves the excess to find their way into the soil or water sources. Recent studies have assessed various levels of concentration of agrochemicals in air, sand dust and soils, blood, breast milk, semen and urine of people handling agrochemicals [3] and [7,8]. In addition when pesticides are applied in quantities less than required, it could give rise to pesticide resistant pests which would ultimately result in economic loss to the farmers as suggested by [9].
The presence of agrochemicals in concentrations in excess of the World Health Organization (WHO) minimum acceptable in water sources could impair the health of plants, animals and human beings.
A study by the Centre for Disease Control and Prevention in United States showed that an average person living in United States had 13% pesticides in their bodies. The study also revealed that women and children of child bearing age carried the heaviest loads of pesticides in which 6 - 11 years carrying about four times the acceptable levels of organophosphorus. Organophosphorus pesticides were found to interfere with signals transmission by nerves in the brain and the nervous system making them potent neutron-toxins. Consumption of agrochemicals have been linked with a range of conditions including cancer, decrease in male fertility, fetal abnormality, chronic fatigue syndrome in children etc. [10-12].
High concentrations of nitrates in human system could cause methenoglobinemia (blood disorder) and death [13, 14]. High nitrates levels could affect people of all ages especially infants and pregnant women. Excessive consumption of nitrates could also result in gastroenteritis and diarrhea. Nitrates stored in the human body could be converted into carcinogenic compounds resulting into cancer tumors, birth defects etc. [12].
World Health Organization and United Nations Environment Program estimated three million workers in Agriculture in developing Worlds experience severe poisoning from pesticides, about 18,000 of who die [15]. Another study observed that self-poisoning by pesticides by method of choice is about one third of the Worlds suicides, thus restrictions on the type of pesticides that are more harmful to human beings is necessary especially areas lacking knowledge on utilization [16].
The increasing scarcity of water, the gradual destructtion of water sources and the aggravated pollution in many regions of the World require effective water source planning and management. This study intends to assess the concentrations of agrochemicals in the Zaria dam reservoir and ground water of the adjacent communities.
2. Study Area
Zaria dam is located on latitudes 11˚07'45"E to 11˚08'20"E and longitudes 07˚46'N to 07˚48'N [17].
Two settlements (Shika and Anguwan Bello) are located immediately upstream on the right and left side of the reservoir where the raw water intake is located. These settlements depend to some extent on hand dug shallow wells and hand pumped boreholes for immediate water needs. The hand dug wells are shallow wells of depth not more than 10 metres. The wells are all not lined covered with wooden logs without impervious aprons. Hand dug well (GS60) is located in the streets and could be vulnerable agrochemicals washed from the farms close to the settlement as it was not covered properly. Well (GS40) is hand pumped well fitted with apron and it serves as drinking water source for Shika settlement. The surface water sampling points were located upstream and located approximately 500 meters from each other along the river bank where the flow downstream is very low (see location map Figure 1).
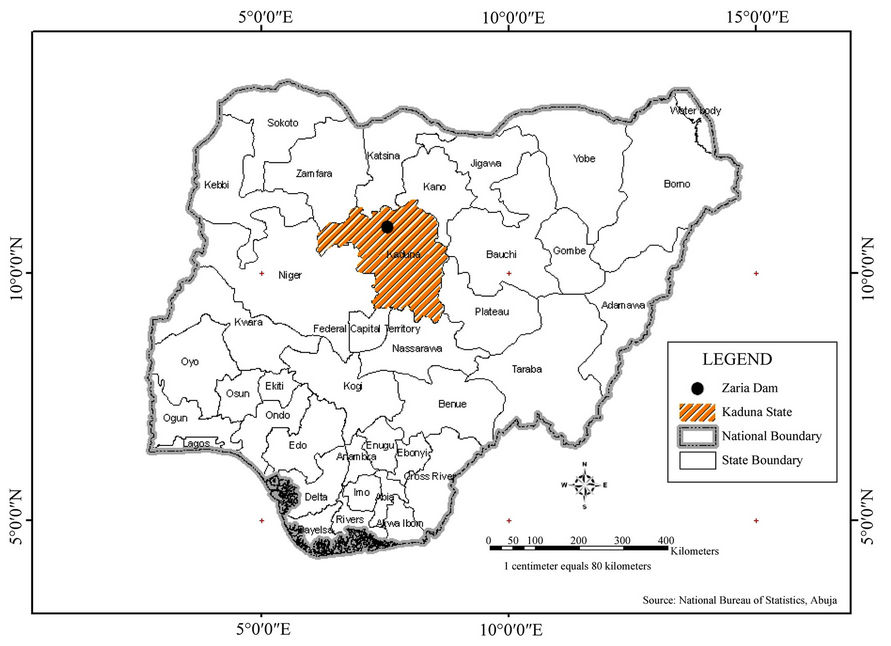
Figure 1. Map of Nigeria showing Kaduna state where the study area is located (Zaria).
The river Galma covers a catchment area of about 3237.50 square kilometers and starts from the foot hills of Jos Plateau after traversing approximately 225 kilometers [1]. The study area has annual peak rainfall of 1854 mm and average of 1143 mm [1]. The rainfall usually starts and ends in April and October respectively with rare cases in the months of March and November.
3. Materials and Methods
Plastic sampling bottles of capacity 60 ml were used to collect both surface and well water samples at designated points positioned by means of Geographical Positioning System (GPS). Nine sampling points were selected for surface water (SS) upstream and six hand-dug community wells for ground water (GS).
Water sampling and analysis were carried out between July and September. Samples were taken every two weeks throughout the period except explained specifically when a heavy rainfall was experienced. The sampling period coincided with the period of heavy rainfall to ensure large flows into the reservoir and also with the peak of the farming season when agrochemicals application was high. Figure 2 shows the sampling locations.
The samples were analyzed at the Institute for Agricultural Research, Soil and Water Laboratory, Ahmadu Bello University Zaria, for the following parameters: pH, Nitrates, Chlorides, Sulphates, Bicarbonates and Total Phosphate. The procedures for the analysis based on [18-20] briefly described below.
1) pH determination: The pH metre was first calibrated with buffer solution and the acidity read directly from the metre [19].
2) Nitrates (NO3): Determination was by steam distillation using Kjeldahl apparatus [19].
3) Chloride (Cl): Titrimetric method involving Silver Nitrate [18]. Chloride concentration could be calculated from Equation (1).
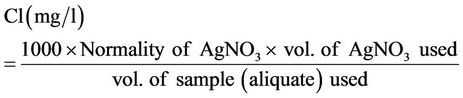 (1)
(1)
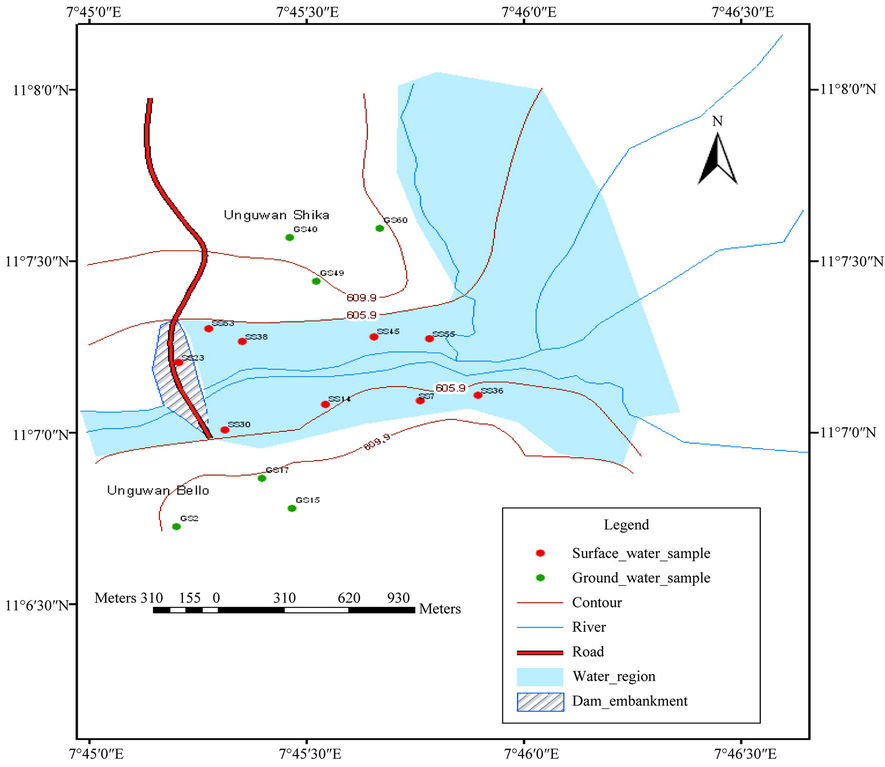
Figure 2. Map showing sampling points for Zaria dam.
4) Sulphates (SO4): Determined using turbidity method [18]
5) Bicarbonates (HCO3): Was determined by titration [18]. The bicarbonates in mg/l was calculated using Equation (2).
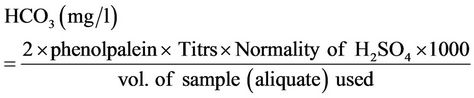 (2)
(2)
6) Total Phosphates (TP): Determined using ammonium Molybdate/Metavanadate also called Yellow method [20].
The surface water samples were designated as follows for easy identification: SS30, SS14, SS7, SS36, SS23, SS53, SS38, SS45, and SS55 for samples at points 1 to 9.
The well water samples were also designated as follows: GS15, GS17, GS2, GS49, GS60 and GS40 samples at points 1 to 6.
4. Results and Discussion
The mean concentrations of Chlorides, Nitrates, Bicarbonates, Phosphates, Sulphates and pH values are shown in Tables 1 and 2. The values were plotted using MicroSoft Excel as shown in Figures 3-8.
4.1. Chlorides
The mean concentrations of chlorides were found to range from 0.600 - 0.900 mg/l and 1.583 - 3.10 mg/l and for sampling points it ranged from 0.400 - 2.300 mg/l and 0.400 - 9.700 mg/l surface and ground waters respectively. Analysis of variance (ANOVA) of the mean concentrations at 95% confidence level was tested. The variation of the mean concentrations of chlorides with respect to sampling points and dates when samples were taken for both surface and well waters indicated Equations (3) and (4) limits. An effect due to a particular factor, is its mean square (NS = SS/df) is usually large and F = MS (factor)/MSE is large.
 (3)
(3)
 (4)
(4)
where, F is the test factor. Fcalculted refer to the calculated factor at 95% confidence level, Fcritical refer to the critical factor from table of values at 95% confidence level and the p-value.
From Equations (3) and (4), the mean concentrations of chlorides have no significant variation with respect to sampling points but have significant variation with sampling dates.
Although the mean concentrations of chlorides in the study area are below the [21] maximum standard of 250 mg/l, the general increasing trend with time in Figure 3 needs to be controlled and kept within tolerable limits. Chloride is one of the major anions when in water in form of sodium chloride gives taste to the water. Studies have also shown that human exposure to Vinyl Chloride Monomer (VCM) can cause serious liver disease and angiosarcoma (a very rare liver cancer) as observed by [21-24]. High chloride concentrations in water could affect steel distribution pipes and cement structures when in contact with them.
4.2. Nitrates
The mean concentration of nitrates ranged from 0.009 - 0.019 mg/l and 0.014 - 0.034 mg/l while that for sampling points ranged from 0 - 0.028 mg/l and 0.007 - 0.063 mg/l for surface and well waters respectively. The mean concentration of Nitrate for the samples taken on the 58th day showed a decline because some of the Nitrates might have been decomposed off by the soil microbes after application since there was no enough flow to wash the excess nitrates into the water sources (See Figure 4).
ANOVA test showed that the mean concentrations of Nitrates with sampling points and with increasing dates of sampling for both surface and well waters indicated Equations (4) and (5) limits respectively.
 (4)
(4)
 (5)
(5)
Equations (4) and (5) indicate that the mean concentrations of Nitrates showed no significant variation with respect to sampling points and increasing dates of sampling for both surface and well waters.
Studies showed that High concentrations of nitrates in human system could cause methenoglobinemia, an ailment that can cause blood disorder and death [10,11]. High nitrates levels could affect people of all ages especially infants and pregnant women. Excessive consumption of nitrates could also result in gastroenteritis and diarrhea. Nitrates stored in the human body could be converted into carcinogenic compounds resulting into cancer tumors, birth defects etc. [12]. Although the maximum recorded concentration in this study is below the [25] maximum allowable limit of 250 mg/l, source control of the present concentrations for both surface and well waters is necessary. Figure 4 showed concentrations increased from about 0.015 mg/l to a maximum value of about 0.035 mg/l after which the value dropped to about 0.025 mg/l for ground water with even lower values for surface waters. This may be explained by the fact that dilution might have occurred in the reservoir and the wells due to the heavy down pour experienced just
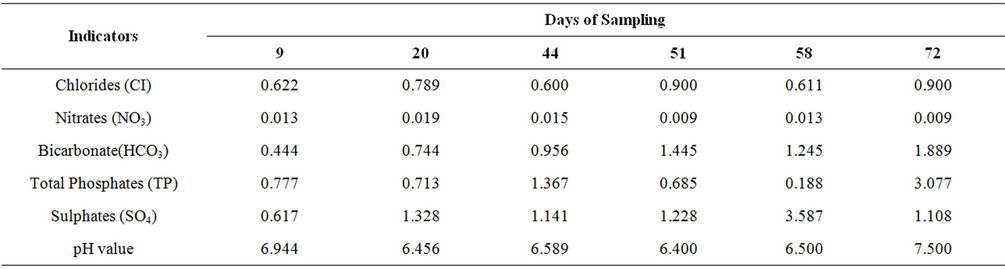
Table 1. Mean concentrations of the agrochemical indicators for surface water in mg/l.
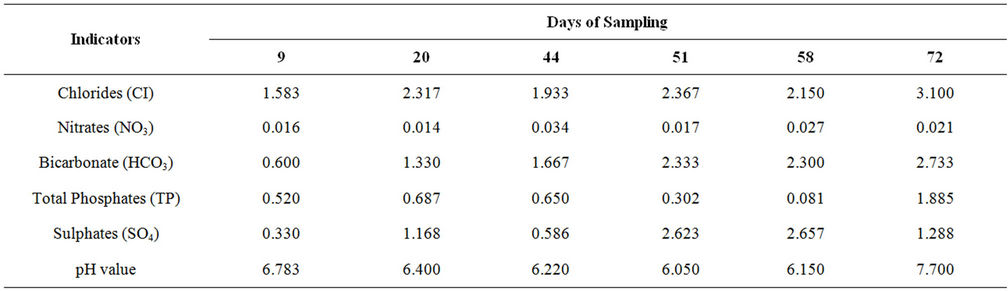
Table 2. Mean concentrations of the agrochemical indicators for ground water in mg/l.
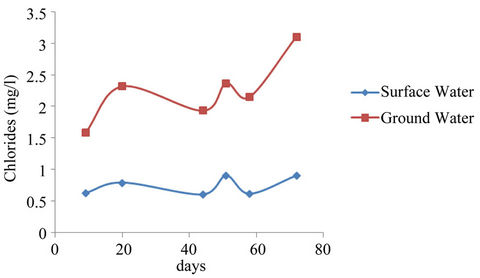
Figure 3. Chloride mean concentrations for surface and well waters.
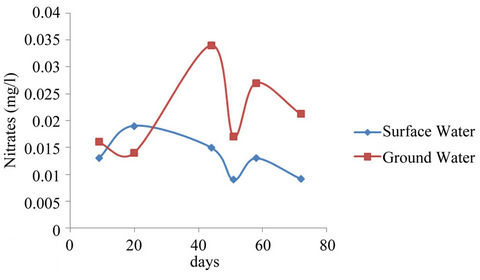
Figure 4. Nitrates mean concentrations of surface and ground waters.
before sampling.
4.3. Bicarbonates
The mean concentrations of bicarbonates for the study area ranged from 0.444 - 1.889 mg/l and 0.600 - 2.733 mg/l while that for sampling points ranged from 0.200 - 2.400 mg/l and 0.400 - 6.600 mg/l for surface and well waters respectively.
Variance analysis (ANOVA) at 95% confidence showed that the mean concentrations of bicarbonates at various sampling points and dates of sampling for both surface and well water indicated Equations (6) and (7) limits respectively.
 (6)
(6)
 (7)
(7)
Equations (6) and (7) indicate that the variation of mean concentrations of bicarbonates with respect to sampling points and sampling dates for both surface and ground are highly significant.
Ground water showed higher concentration of bicarbonates relative to the surface water concentrations (See Figure 5) perhaps because the Geologic formations are characterized with limestone. Although the recorded concentrations for both surface and ground waters are below the [26] standards of 400 mg/l, the raising trend shown in Figure 5 need to be curtailed.
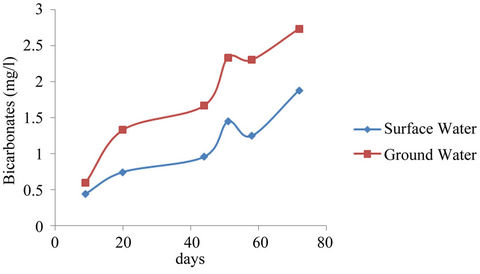
Figure 5. Bicarbonates mean concentrations surface and ground waters.
Carbonates generally have characteristic of poor lathering with soap resulting in domestic economic loss in washing. Industrial boilers could be left with scales on their surfaces. It was observed by [11] that in some cases high bicarbonates concentration is associated with low pH values. This correlation was not observed for the present study.
4.4. Total Phosphates
The mean concentrations of total phosphates ranged from 0.617 - 3.587 mg/l and 0.330 - 2.657 mg/l and that for the sampling points ranged from 0 - 4.680 mg/l and 0 - 3.120 mg/l for surface and well waters respectively during the study period. The surface water concentrations showed higher values relative to the ground water values. The difference could have been due to fertilizer application and the subsequent washing off by erosion of the excess fertilizers into the surface water and from detergents used by the communities adjacent to the reservoir during washings. Figure 6 however indicated very low mean concentrations for the samples taken on the 58th day. The may have resulted because of dilution of the water sources after the heavy down pour experienced just before sampling. Analysis of variance (ANOVA) of the mean concentrations of total phosphates with respect to sampling points and dates of sampling for both surface and well water indicated Equations (8) and (9) limits.
 (8)
(8)
 (9)
(9)
Equations (8) and (9) show that the mean concentrations of total phosphates have no significant variation with respect to sampling points but had significant variation with respect to sampling dates for both surface and well waters.
4.5. Sulphates
The average concentrations ranged from 0.617 - 3.587
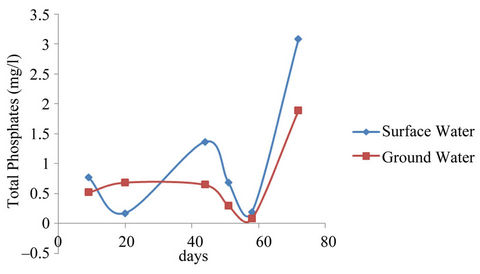
Figure 6. Total phosphates mean concentrations surface and ground waters.
mg/l and 0.330 - 2.57 mg/l for surface and ground waters respectively as shown in Figure 7. The concentrations for the sampling points ranged from 0 - 6.04 mg/l and 0 - 13.02 mg/l for surface and ground waters respectively.
The ANOVA of the mean concentrations of sulphates with respect to sampling dates of sampling for both surface and well water indicated the following statistical results in Equations (10) and (11)
 (10)
(10)
 (11)
(11)
Equations (10) and (11) show that the mean concentrations of sulphates have no significant variation with respect to sampling points but significant variation with sampling dates for both surface and well waters.
The results indicated that ground water is slightly higher in concentrations than the surface water concentrations. Although the concentrations fall below the maximum allowable by [26] of 500 mg/l, has not been exceeded, there is need to control the sulphate concentrations as shown in Figure 7.
4.6. pH Value
The mean values for the study area ranged from 6.40 - 7.50 and 6.05 - 7.70 for surface and ground waters respectively (See Figure 8). The values for the sampling points ranged from 5.90 - 7.80 and 5.60 - 8.40 for surface and ground waters respectively. The [25] permissible range of 6.5-8.5 was not exceeded in the study area.
The ANOVA of the mean pH values with respect to sampling points and dates of sampling for both surface and well waters indicated the statistical limits in Equations (12) and (13).
 (12)
(12)
 (13)
(13)
Equations (12) and (13) show that the pH values have no significant variation with respect to sampling points
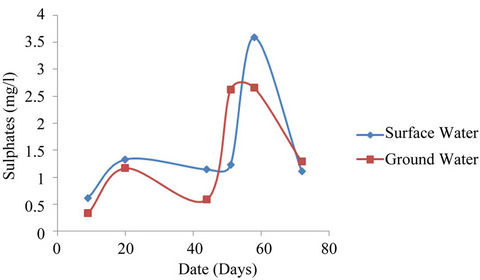
Figure 7. Sulphates average concentrations surface and ground waters.
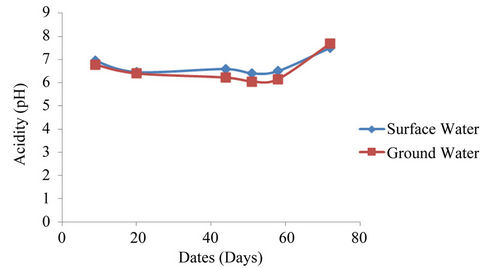
Figure 8. Acidity average concentrations surface and ground waters.
but highly significant with sampling dates for both surface and well waters.
It was opined by [11] that pH of water has no direct implication on human health but suggested that high values could cause bitter taste in water and encrustation of metallic pipes and appliances. Water at pH value of less than 5 could hinder most fish eggs from hatching and much lower values could even kill some adult fish [27]. High values could also depress the effectiveness of chlorine disinfection in water. Low values of pH could suggest the presence of biological lives as most of them thrive in a quite narrow and critical pH range.
Generally, the mean concentrations and pH values of the water sources studied were below the maximum [25,26] limits, however, ionic dominance suggested by [28] in Equation (14) was not observed.
 (14)
(14)
The ionic dominance observed for surface and well waters are shown in equations followed the following dominance.
Lower mean concentration range for surface and well waters are as follows:
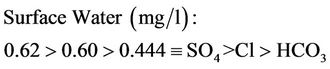 (15a)
(15a)
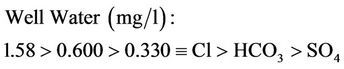 (15b)
(15b)
Upper mean concentration range for surface and well waters are as follows:
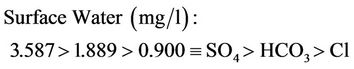 (16a)
(16a)
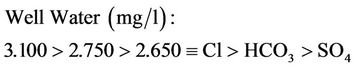 (16b)
(16b)
5. Conclusions and Recommendations
5.1. Conclusions
Traces of fertilizer concentrations were found in Zaria dam reservoir and in ground water from hand dug wells and hand pumped borehole in the communities near the reservoir (Anguwan Bello and Mai Anguwan Shika).
The mean concentrations for both surface and ground waters monitored for the period of July to September were found to be below the [15,16] maximum acceptable levels. Oral interview of the farmers and the distributing agents showed that they were mostly ignorant of the guidelines on the storage, distribution application of the agrochemicals and disposal of wastes.
5.2. Recommendations
Since traces of agrochemicals were detected in both surface and ground water sources in the study area, short and long term management strategies should be adopted.
5.2.1. Short Term Management Strategies
Provision of Load-Index metre to monitor only maximum tolerable limits of agrochemicals and their environmental effects.
Use of agrochemicals should be prohibited within 10 metres of drinking water sources.
Using environmentally friendly fertilizers (Organic Agriculture) and local pesticides (Neem tree oil or seed oral solutions).
5.2.2. Long Term Management Strategies
Assessment of active ingredients of agrochemicals should be done with the hope of using only those that are less aggressive to man and his environment.
Excise tax on agrochemicals designed and implemented in such a way that it should reduce the use of agrochemicals without distorting or worsening the economic situation in the agricultural sector.
Stake holders in the storage, distribution and application of agrochemicals should posses a certificate in agrochemical administration.
Records of agrochemical application should be maintained by famers on their farms with the help of Agricultural Extension workers.
REFERENCES
- S. M. Zubair Pirzada, “Estimating of Useful Life of Zaria Dam (Galma Reservoir), Kaduna State,” M.Sc Project, Unpublished, 1978.
- Final Draft, “Fertilizers and Pesticides,” Issue Paper, Vol. 4, No. 2, 1997, pp. 1-15. Final Draft\gwmp\vol4-rev\appnd-2\fertpest.doc,
- O. D. Jimoh, M. A. Ayodeji and B. Mohammed, “Effects of Agrochemicals on Surface Waters and Ground Waters in the Tunga-Kawo (Nigeria) Irrigation scheme,” Hydrological Sciences, Vol. 48, No. 6, 2003, pp. 1013-1023.
- R. C. Gilden, K. Huffling and B. Sattler, “Pesticides and Health Risks,” Journal of Obstetric, Gynecologic, & Neonatal Nursing, Vol. 39, No. 1, 2010, pp. 103-110. doi:10.1111/j.1552-6909.2009.01092.x
- R. L. Kellogg, R. Nehring, A. Grube, D. W. Goss and S. Plotkin, “Environmental Indicators of Pesticides Leaching and Run-Off from Farm Fields,” United States Department of Agriculture Natural Resources Conservation Service, 2000. http://www.nrcs.usda.gov/Technical/Land/Pubs/eip-pap.html
- S. Kuniuki, “Effects of Organic Fertilization and Pesticide Application on Growth and Yield of Field-Ground Rice for 10 years,” Japanese Journal of Crop Science, Vol. 4, No. 70, 2001, pp. 530-540.
- A. Hotton, J. I. Barminas and S. A. Osemeahon, “Pesticide Umnary Metabolite and Deposit on Agro-chemicals Retail Outlets in Taraba Nigeria,” European Journal of Scientific Research, Vol. 46, No. 4, 2010, pp. 584-591.
- A. Hotton, J. I. Barminas and S. A. Osemeahon, “Evaluation of Exacholorocyclodhexane Isomers in the Blood of Agrochemicals Retailers in Taraba,” Nigeria American Journal of Scientific and Industrial Research. http://www.schub.org/AJSIR ISSN: 2153-649X
- R. Knuston, “Economic Impact of Reduced Pesticide Use in the United States,” Agricultural and Food Policy Centre, Texas A & M University, 1999. http://www.afpc.tamu.edu/pubs/1/148/99-2.pdf
- D. S. Powlson, T. M. Addiscott, N. Benjamin, K. G. Kassman, T. N. de Kok, H. V. Grinsven, J. L. L’hirondel, A. A. Avery and C. V. Kessel, “When Does Nitrate Become a Risk for Humans. American Society of Agronomy, Soil Science Society of America, Crop Science Society of America,” Journal of Environmental Quality, Vol. 37, No. 2, 2008, pp. 291-295. doi:10.2134/jeq2007.0177
- J. Jurewicz and W. Hanke, “Parental and Childhood Exposure to Pesticides and Neurobehavioral Development: Review of Epidemiological Studies,” International Journal of Occupational Medicine and Environmental Health, Vol. 21, No. 2, 2008, pp. 121-132. doi:10.2478/v10001-008-0014-z
- K. L. Bassil, C. Vail, M. Samborn, D. C. Cole, J. S. Kaur and K. J. Kerr, “Cancer Health Effects of Pesticides: Systematic Review,” Can Farm Physician. Vol. 53, No. 10, 2007, pp. 1704-1711.
- Department of Health, “Toxic Substances Fact Sheet: Nitrates in Drinking Water,” Office of Environmental Health Programs, Olympia, 1990.
- B. A. Adelekan, “Water Quality of Domestic Wells in Typical African Communities: Case Studies from Nigeria,” International Journal of Water Resources and Environmental Engineering, Vol. 2, No. 6, 2010, pp. 137-147.
- G. T. Miller, “Sustaining the Earth,” 6th Edition, Thompson Learning, Inc., Pacific Grove, 2007, pp. 221-216.
- D. Gunnell, M. Eddleston, M. R. Phillips and F. Konradsen, “The Global Distribution of Fatal Pesticides SelfPoisoning: Systematic Review,” BMC Public Health, Vol. 7, 2007, p. 357. doi:10.1186/1471-2458-7-357
- Norther Nigeria Geological Survey Map, “Sheet 102, Zaria-Kaduna,” 2nd Edition, 1965.
- Official Methods of Analysis of the Association of Official Analytical Chemists, “Methods 960.30,” Manual, 15th Edition, 1990.
- American Public Health Association, American Water Works Association and Water Environmental Federation, “Standard Methods for the Examination of Water and Wastewater, 1992.
- American Society for Testing and Materials, “Mannual of Water and Environmental Technology Method D1385- 88,” ASTM, West Conshohocken, 1987.
- P. L. Viola, “Carcinogenic Effects of Vinyl Chloride,” 10 th International Cancer Congress, Huston Texas, 22-29 May 1970.
- C. Maltoni, “Cancer Detection and Prevention,” 2nd International Symposium on Cancer Protection and Prevention, Bologna, 9-12 April 1972.
- EPA, “Toxicological Review of Vinyl Chloride in Support of Information on the IRIS,” Washington DC, May 2000.
- EPA, “National Emission Standards for Hazardous Air Pollutants for Vinyl Chloride Sub Part,” Vol. 66, No. 186, Washington DC, 2001.
- WHO, “Guidelines for Drinking Water Quality,” 3rd Edition, World Health Organization, Geneva, 1993.
- WHO, “Guidelines for Drinking Water Quality,” Vol. 1, 3rd Edition, World Health Organization, Geneva, 2004.
- Biomedx, “The pH Equation of Health: How You Rot and Rust,” 1998. http://biomedx.com/micrscpes/rrinfro/rr4.html
- W. Stumm and J. J. Morgan, “Aquatic Chemistry,” Wiley, New York, 1981, p. 780.