Journal of Environmental Protection
Vol. 3 No. 8 (2012) , Article ID: 21751 , 4 pages DOI:10.4236/jep.2012.38093
The Development of PCB Enterprise Sewage Monitoring and Management and Controlling Systems
![]()
1School of Mathematic and Computer Science, Hubei University, Wuhan, China; 2Zhixing College, Hubei University, Wuhan, China.
Email: lyxchenglu@hubu.edu.cn
Received May 15th, 2012; revised June 17th, 2012; accepted July 13th, 2012
Keywords: Single Board Computer (SBC); PC; Data Acquisition Cycle; PCB
ABSTRACT
With the development of science and technology, more and more cities are confronted with the water pollution of various degrees. The article is devoted to the introduction of a secondary sewage monitoring and management system which can automatically check the content of different components in the sewage discharged by enterprises and supply data reports with the help of probes, SBCs, PCs, etc. The article includes five parts. The first part introduces the research background, main research work and innovations of this system. The second part introduces the system architecture and system process. The third presents the fundamental working principles of SBCs and the relevant algorithms of PCs. The fourth expounds the problems and deficiencies which may exist in the algorithms. And the last part consists of summary and prospect, providing the possible solution to the deficiencies and looking forward to the future direction of research.
1. Introduction
As we al know, everyone of us has to drink a lot of water every day. Water is regarded as the source of life, whose quality can directly affect human health. Up to now, all cities are confronted with water pollution of different degrees, especially in highly industrialized cities where water pollution is more serious. Thus, the protection and supervision of water resource and effective measures for sewage processing have become the necessary means to prevent the lack of water resource from restricting social economic development. China has rich water resource with high quality but with the development of industry and increase of population, the problem of water pollution has attracted much attention. After being used in the production processes in factories, most water becomes waster water which contains components harmful to human body and will damage human living environment if it is discharged into lakes or soil without any control. Therefore, we need a complete set of facilities, i.e., sewage monitoring and controlling system, to process waste water, promoting the development of industrial and agricultural production and protecting human health. In this design, the probes in the sewage processing pool transmit the content of various substances measured in polluted water to the single board computer (SBC) in the system in form of analog signals. SBC transmits the signals to PC in form of binary digits after processing them and eventually PCs describe the quality of polluted water of each moment with graphs. In the design, whether polluted water should be discharged is controlled by PC which sends out signals to SBC to control the gate of sewage pool. This design not only can satisfy the measurement of water quality parameters, but can meet the demand of remote and online measurement. It adopts the design principle of “centralized measurement and centralized monitoring and controlling”, improving the level of automation of sewage monitor and control.
2. System Architecture
The overall system architecture is shown in Figure 1.
This figure illustrates the general process of the sewage monitoring and controlling system. The probes in the pool measures the content of substances needed to monitor and process in the polluted water and the water level of polluted water and sends the analog signals to the single board computer. SBC performs the conversion from analog to digital, converting analog signals from probes into binary digits and integrating, arranging and controlling data to facilitate the further processing by PC. PC performs data analysis, first converting binary data from SBC into decimal form and then analyzing data and drawing the analysis chart of content of various impurities and pollutants. It has to decide whether the waste water in the first-level processing pool can be discharged into
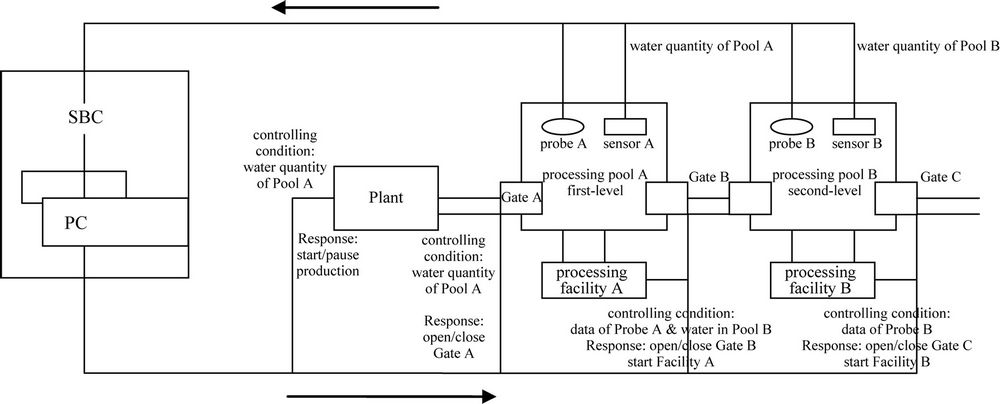
Figure 1. The overall architecture of the system.
the second-level processing pool based on the analysis of waste water in the first-level pool and whether the waste water in the second-level processing pool can be discharged into rivers based on the analysis of waste water in the second-level pool. PC, after analyzing water quality, gives signals to SBC which, according to the signals, controls the processing facilities and drain gates to discharge or process the sub-standard polluted water. Here we just introduce the general process and more details about implementation and algorithm can be found in the following parts.
3. Brief Introduction to the Working Principle of PCs and SBCs in the System
3.1. Single Board Computers
As shown in Figure 1, there are three probes in the sewage pools which respectively detect PH value, the content of heavy metals and the content of organic phosphorus compound in the sewage. An A/D converter is installed between the probes and the SBC and at the interface between A/D converter and the SBC lies a timer implemented with software which has a clock cycle of 50 ms. When the system begins to work, the timer controls different probes to measure different substances and its measuring order is PH, the content of heavy metals and organic phosphorus compound. In a clock cycle, the electric signals obtained by probes are converted by A/D converter into binary digital signals and transmitted to SBCs, which then transmit those digital signals to the internal program data area. In this area, SBC will process the data in a series of steps, such as using double buffering to store data and so on. After being processed in program data area, the digital signals will be transmitted through RS-232 interface into PC which will analyzes the signals and sends out a signal to SBC if various measured data all meets the criteria. SBC receives the signal, process it and then give an electric signal to the gate electromagnetic relay controlling the exit of sewage pools. The relay receives the signal, process it and open the gate and discharge the polluted water.
3.2. PC
PCs receive the binary digital signals from SBCs and process them. The detailed process and algorithm is as follows:
Preprocessing:
t = 50 ms; //time for recording data is t ms;
t_draw = 5 s; //time interval for drawing curve graphs;
t_store = 1 min; //time interval for storing data;
n = 4; //n kinds of components needed to monitor;
temp1[n][t_draw/(t*n) + 10]; //buffer area for sending data and extra 10 blocks are used for preventing the loss of data during fetching;
temp_1index1 = 0; //index 1 in buffer area, kinds of components;
temp_1index2 = 0; //index 2 in buffer area, location of components data;
temp2[n][t_store/(t_draw*n) + 10] //buffer area for transmitting data into database;
temp_2index1 = 0;
temp_2index2 = 0;
//execute 1 and 2 every t time interval.
3.2.1. Conversion from Binary to Decimal (8-Bit Binary Data b)
//binary is fixed-point number and the decimal point is in the rear.
1) Define an integer variable sum and save the result;
2) Fetch every data from low order and divide it by 10 then fetch the remainder:
a) i = 0 ;
b) temp = b mod 10;
c) sum = temp * 2^i;
d) temp’ = (b - temp)/10;
e) i++;
f) if (i = 8) exit the loop;
3) Return sum.
3.2.2. Store the Return Data in 1
1) Store data in temp1[n][t_draw/(t*n) + 10];
2) Temp_1index1++; temp1_1index2++;
3) If (temp1_1index1 >= n) temp1_1index1 = 0;
4) If (temp1_1index2 >= n) temp1_1index2 = 0;
//draw a graph every t_draw, execute the following codes 3 and 4.
3.2.3. Process Data in Array Temp
1) Calculate the middle time of time interval and calculate the average value of content;
2) Store the middle time and the average value.
3.2.4. Draw Curve Graphs (Moment, Content)
1) Draw coordinate (horizontal axis is moment while vertical axis is content);
2) Draw dots in the coordinate;
3) Join the dots up:
a) Obtain the coordinate of the nearest dots;
b) Join them up.
3.2.5. Monitor the Content
//such as alarming when above the standard, discharging waste water, etc.
1) Content exceeding the standard (component x, permissible maximum max, permissible minimum min, current content curr)
if (curr >= max)
alarming when exceeding standard;
else if (curr <= min)
opening gate to discharge waste water;
else keeping monitoring;
}.
3.2.6. Store Return Data in 3
1) Store data in temp2[n][t_store/(t_draw*n) + 10];
2) Temp2_1index1++; temp2_1index2++;
3) If (temp2_1index1 >= n) temp2_1index1 = 0;
4) If (temp2_1index2 >= n) temp2_1index2 = 0;
//execute 7 every t_store.
3.2.7. Data Storage (Component, Content)
1) Open the database table corresponding to components;
2) Insert content values into the table according to time:
//a simple query function.
Draw a pie chart (beginning time, ending time):
a) Judge the validity of time;
• Whether it is the time having occurred;
b) Fetch data from database;
c) Calculate the percentage of each component;
d) Draw circular sectors (center of circle. Percent);
• Calculate radian numbers according to percent;
• Draw sectors;
• Color sectors and write the name and content of components in sectors.
4. Possible Issues in Programs and Algorithms
1) The following preprocessing is done in algorithm:
Temp 1 and Temp 2 reserve 10 blocks to prevent data loss due to slow data fetching. The main reason for data loss is the discrepancy between the speed of writing and reading data. The cycle of reading data is 5 s while that of writing data is 50 ms, thus two cycles have to be executed asynchronously, which leads to the loss of data. Whether 10 buffer areas are enough and whether there exists waste of storage has not yet been studied. This depends on the speed of specific computers fetching stored data.
2) In the data conversion algorithm 1, I suppose data is integer. But in practical applications, there is no doubt that the content of substances in water is bound to have decimal fraction. In that algorithm I neglect the position fixing of decimal point.
3) The scale issue of coordinate axis in drawing algorithm 3. In the algorithm horizontal axis is time and vertical axis is content. The scale of time is neglected. The curve graph should be represented in form of motion, updating in time and keeping changing. More details need to be further studied.
4) The biggest danger hidden in the algorithm is that coding is not implemented (considering the difficulty of coding and limit of time) and lots of data come from ideal states which obviously cannot meet the requirements of customers.
5. Conclusion and Prospect
This system is bulky and although its design thought is simple there is still some difficulty in implementing it and many details are complex for processing. Different factories discharge different waste water, which means water quality needing to be monitored is different and thus the selection of sensors or probes is based on the quality of waste water. The monitoring data when transmitted from sensors to SBC may be affected by outside disturbances, which means transmission cables have to be selected according to the environment surrounding the sewage pools; otherwise the monitoring results will be affected. Plants of different size have different speeds of generating waste water and require different speeds of processing sewage, which subsequently affects the selection of SBC and PC. Meanwhile, the processing programs in PC are required to be highly efficient and precise, which then affects the selection of programming language. Theoretically speaking, this design will bring good effect in sewage processing systems. The author will continue to research into it in the future.
REFERENCES
- C.-Q. Li, “Selected Works on PC and SBC and DSP Data Communications Technologies,” 2nd Edition, Press of Beijing University of Aeronautics and Astronautics, Beijing 2003, pp. 95-99.
- D.-Z. Tan, “Sensors and Measuring and Testing Techniques,” 3rd Edition, Press of China Central Radio and TV University, Beijing, 1996, pp. 109-112.
- X.-B. Sun, “Fundamentals of Sensing and Measuring Techniques,” Publishing House of Electronics Industry, 1990, pp. 55-63.
- C. Sun, “Underwater Multisensors Display Signal Processing,” 3rd Edition, Northwest University of Technology Press, Xi’an, 2004, pp. 34-36.
- W. Buchanan, “PC Interface Communication and Windows Programming. Translated by Elite Science and Technology,” China Electric Power Press, Beijing, 2000, pp. 28-32.