Food and Nutrition Sciences
Vol.5 No.6(2014), Article ID:43705,9 pages DOI:10.4236/fns.2014.56068
Relationship of Grain Fructan Content to Degree of Polymerisation in Different Barleys
Csilla Nemeth1, Annica A. M. Andersson1, Roger Andersson1, Elke Mangelsen2, Chuanxin Sun2, Per Åman1
1Department of Food Science, BioCentre, Swedish University of Agricultural Sciences (SLU), Uppsala, Sweden
2Department of Plant Biology and Forest Genetics, BioCentre, Swedish University of Agricultural Sciences (SLU), Uppsala, Sweden
Email: annica.andersson@slu.se
Copyright © 2014 by authors and Scientific Research Publishing Inc.
This work is licensed under the Creative Commons Attribution International License (CC BY).
http://creativecommons.org/licenses/by/4.0/


Received 20 December 2013; revised 20 January 2014; accepted 28 January 2014
ABSTRACT
Fructans are important in the survival of plants and also valuable for humans as potentially health promoting food ingredients. In this study fructan content and composition were determined in grains of 20 barley breeding lines and cultivars with a wide variation in chemical composition, morphology and country of origin, grown at one site in Chile. There was significant genotypic variation in grain fructan content ranging from 0.9% to 4.2% of grain dry weight. Fructan degree of polymerisation (DP) was analysed using high-performance anion-exchange chromatography with pulsed amperometric detection (HPAEC-PAD). Changes in the distribution of different chain lengths and the pattern of structures of fructan were detected with increasing amount of fructan in the different barleys. A positive correlation was found between fructan content and the relative amount of long chain fructan (DP > 9) (r = 0.54, p = 0.021). Our results provide a basis for selecting promising barley lines and cultivars for further research on fructan in barley breeding with the aim to produce healthy food products.
Keywords:Fructan; Barley; Hordeum vulgare L.

1. Introduction
Fructan and fructooligosaccharides (degree of polymerisation (DP) 3 - 9) (hereafter referred to as fructan) are fructose polymers or oligomers containing a terminal sucrose that are accumulated by plants including the temperate cereal species wheat (Triticum aestivum L.), rye and barley (Hordeum vulgare L.) as an easily mobilized storage carbohydrate. According to the classification by glycosidic linkages barley contains graminan (branched)-type fructan with both β-(2-1) and β-(2-6) linkages (Roberfroid, 2005). In graminans branches can be linked to any fructosyl residue and even the glucosyl residue may be attached to a fructosyl chain [1] . The initial trisaccharides of branched fructan in barley that are elongated through fructan synthesis are 1-kestose (1-kestotriose) and 6-kestose (6-kestotriose) [2] . Linkage structure of fructan were described to shift toward a higher ratio of (2-6) linkages after longer periods of accumulation as opposed to the abundance of (2-1) linkages in oligomers formed during early induction of synthesis in wheat [3] .
The DP of plant fructan ranges from three to more than 200 [1] . However, in most plants fructan is small and the DP does not exceed 50 - 60 fructosyl residues [4] [5] . In wheat milling fractions, Haskå et al. [6] described a DP up to 19.
Wagner et al. [7] reported that fructan accumulates in the vacuoles in cells of barley and acts as a carbon sink within the cell to facilitate photosynthesis when the conditions are restricting transport or growth. Fructan reserves are remobilized and transported to the reproductive tissue during grain filling and to the vegetative tissues during periods of growth [8] .
The total fructan content has been shown to be between 3.6% - 6.6% of dry weight in wholegrain rye (Secale cereale L.) flour [9] [10] ; 1.6% and 2.1% in barley flour [11] [12] , and 2.2% in triticale [13] . A wide genotypic variation of fructan content, from 0.7% to 2.9% of grain dry weight, was reported in wheat by Huynh et al. [11] and from 0.8% - 1.9% by Andersson et al. [14] .
Fructan has been described as acting as a dietary fiber that has prebiotic effects, reduces cholesterol and enhances absorption of minerals such as calcium and magnesium [1] [15] [16] . In inulin-type fructan the bifidogenic effect was found to be independent of chain length and there was no definite correlation between amount consumed and response [17] . On the other hand, Nilsson & Nyman [18] reported that the DP and solubility affect the short-chain fatty acid formation in the process of colonic fermentation and therefore can be used for different health effects when designing foods. It has also been shown that fructan with DP 5 - 15 from barley grain produces more propionate than oligofructose from chicory root (DP up to 5) during in vitro fermentation [19] . When the same samples were fed to rats at 5% of the diets, fructan from barley and oligofructose from chicory root produced similar large bowel fermentation patterns with higher cecal digesta weights, increased production of short-chain fatty acids and lower pH compared to the control group without fructan or oligofructose [20] .
There is an increasing interest in using barley in cereal-based food products [21] due to positive health effects regarding soluble dietary fibre, mainly β-glucan, and the possible promoting health effects of fructan. Considering fructan, not many studies have been performed on barley. It is therefore important to identify genotypic variation in fructan content and chain length in different barley lines and cultivars, which might facilitate breeding for this trait and development of health food products.
In the present study, fructan content and DP have been examined in grains of barley comparing 20 different cultivars and genotypes. Correlations between fructan content and degree of polymerisation were also investigated.
2. Experimental
2.1. Plant Materials
Grains from 20 spring barley breeding lines and cultivars were used in the experiment. The experimental plots were grown in Vilcun, Chile, planted in November 2008 and harvested in February 2009. The 20 barley lines and cultivars analysed was known to vary widely in morphology and country of origin and were obtained from the Nordic Gene Bank (NGB) of the Nordic Genetic Resource Center, Sweden; The Royal Veterinary and Agricultural University (KVL), Denmark; The Swedish University of Agricultural Sciences (SLU), Sweden; and SW Seed, Svalöf Weibull AB, Sweden (Table 1).
Flours were obtained by milling 20 g of each sample using a Cyclotec TM 1093 mill with a 0.5 mm screen (Foss, Höganäs, Sweden).
2.2. Analysis of Fructan Content
All samples were analysed in duplicate. Dry matter was determined by drying the samples at 105˚C for 16 h ac

Table 1. Fructan content and distribution of DP 3 - 9 and DP > 9 fructan chains in the 20 barley breeding lines and cultivars.
aNGB: Nordic Gene Bank, Sweden; KVL: The Royal Veterinary and Agricultural University, Denmark [25] ; SLU: The Swedish University of Agricultural Sciences, Sweden; and SW: Lantmännen SW Seed, Sweden. bStandard error (SE) < 10%.
cording to AACC method 44-15A [22] . Fructan content was measured according to the enzymatic/spectrophotometric AOAC method 999.03 [23] using the enzyme assay kit K-FRUC (Megazyme, Bray, Ireland). Raffinose family oligosaccharides were corrected for by treatment with α-galactosidase from Aspergillus niger E-AGLAN (Megazyme, Bray, Ireland) before degradation of starch, maltosaccharides and sucrose, as described in the kit. The difference between duplicate samples was <10%.
2.3. Determination of Fructan Composition with High-Performance Anion-Exchange Chromatography with Pulsed Amperometric Detection (HPAEC-PAD)
A technique developed by Haskå et al. [6] has been used to characterise the distribution of fructan oligomers. Duplicate samples of 200 mg barley flour were weighed into a glass tube together with 200 µl of lactose internal standard (2 mg/ml lactose in water, Sigma, Steinheim, Germany) and 4 ml of 80% ethanol. The sample was capped and extracted in a water bath maintained at 100˚C for 1 h with occasional mixing, ensuring that no ethanol evaporated during the extraction. The tube was cooled to room temperature and centrifuged at 1000 g for 10 min. 0.5 ml of supernatant was transferred to a separate test tube and the solvent removed by drying under vacuum by Speed-Vac (Savant Co., Farmingdale, NY, USA). Next, 2.5 ml of 0.1 M sodium acetate buffer (pH 5.0) was added and maltodextrins were degraded by adding 50 µl of amyloglucosidase (soluble starch 326 U/ml, EAMGDF, Megazyme, Bray, Ireland) and incubating for 4 h at 60˚C with frequent stirring using a vortex mixer. The tube was cooled to room temperature and to ensure identification of fructan, 1 ml aliquot of the amyloglucosidase-treated solution was transferred to another glass tube and treated with 25 µl of fructanase mixture E-FRMXLQ (exo-inulinase 2000 U/ml and endo-inulinase 200 U/ml, Megazyme, Bray, Ireland) for 1 h at 40˚C. Both fructanase-treated and non-treated samples were filtered through Titan2® HPLC syringe filters (17 mm, 0.45 µm Sun Sri, Wilmington (NC), USA). The filtrates were analysed using a Dionex DX 500 Chromatography System (Sunnyvale, CA, USA) equipped with GP 40 gradient pump. Elution gradient was performed according to the method described by Rakha et al. [24] . Chromatography was carried out with a CarboPac™ PA-1 (4 × 250 mm, P/N 35391) anion-exchange column pre-fitted with a CarboPac™ PA-1 Guard Column (P/N 43096). Detection was carried out by an ED40 pulsed amperometric detector. The area of fructan peaks on the HPAECPAD chromatograms was calculated using the MATLAB software by subtracting the area under the peaks of the fructanase treated chromatogram from the area under the corresponding peaks of the fructanase untreated samples. The relative percentage distributions of different DP ranges were calculated based on the area under the peaks after subtraction.
2.4. Statistical Analysis
Analysis of variance (ANOVA) and correlation analyses was carried out using MINITAB (Minitab Inc. release 15.1.1.0) statistical software. Results were considered significantly different at p < 0.05. All results are presented on a dry weight basis (dwb).
3. Results and Discussion
3.1. Content of Fructan
Fructan analysis showed large variation in the grain fructan content among the 20 barley genotypes (Table 1 and Figure 1). Fructan concentrations ranged between 0.9% and 4.2% of grain dry weight resulting in a nearly 5 fold (4.9) difference between the highest and the lowest measured fructan content. In the analysis carried out by Huynh et al. [11] the barley variety “Sloop” contained 1.6% (dwb) fructan, which is lower than the average content of 2.0% in our results, while the 2.1% in the barley variety “Trumpf” reported by Vietor et al. [26] is slightly higher.
3.2. Characterisation of Fructan Profiles
Figure 2 shows HPAEC-PAD chromatograms of fructan oligomers with various degrees of polymerisation and linkage structures in grains of the 20 barleys. The highest DP counted from fructan peaks on the HPAEC-PAD chromatograms was 19 - 20, which was in agreement with findings in wheat described by Haskå et al. [6] . Iden-
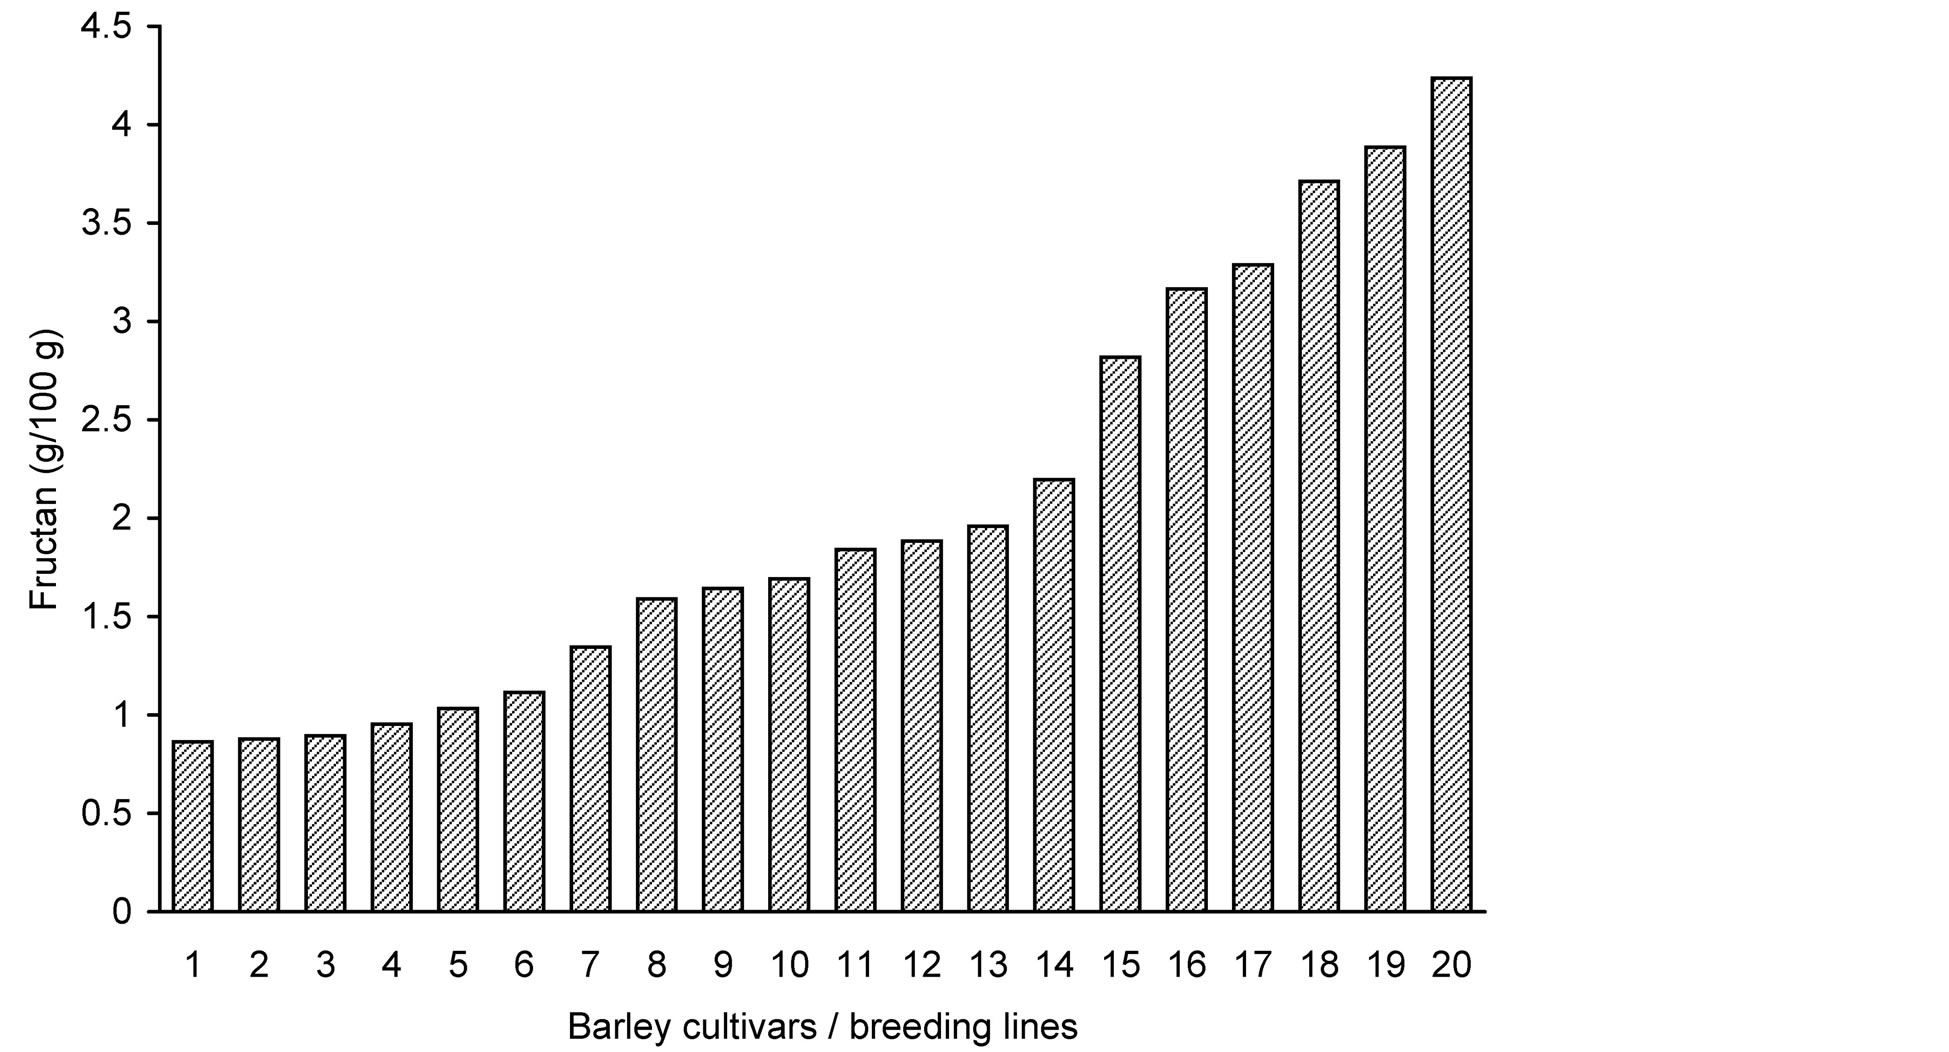
Figure 1. Fructan content (g/100 g) in grains of 20 barley lines and cultivars, shown in the order of increasing total fructan content. For sample numbers see Table 1.
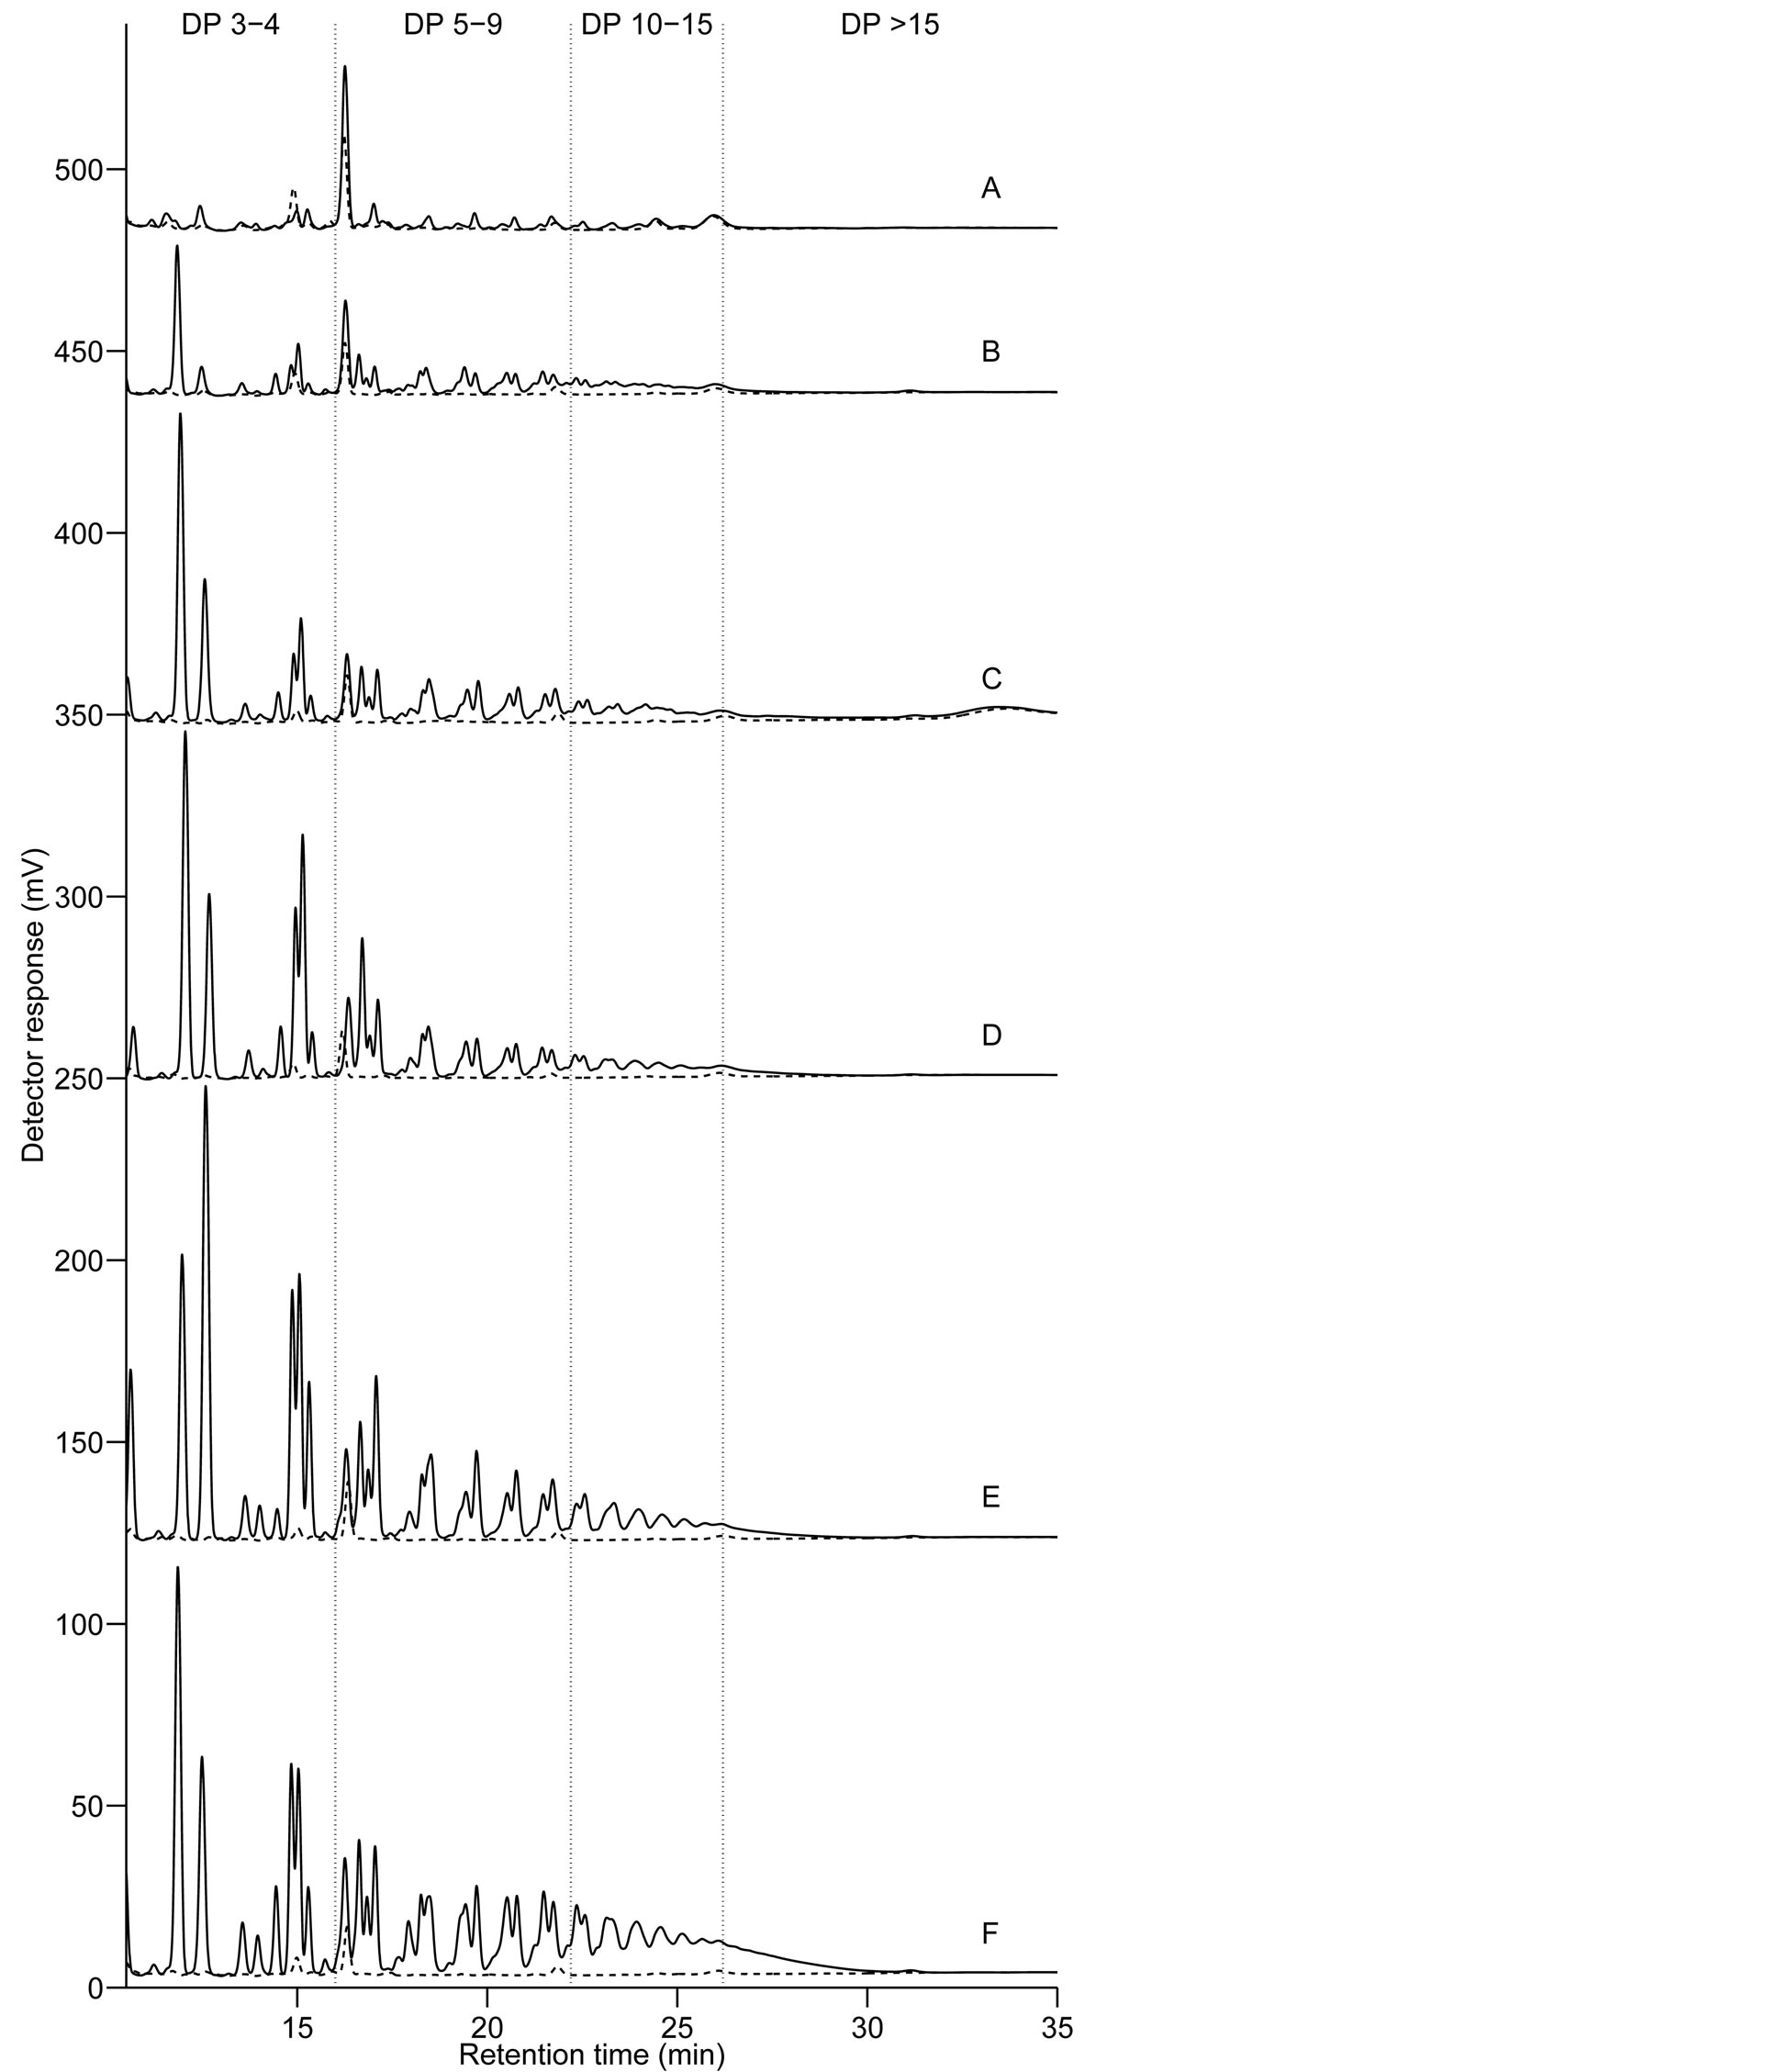
Figure 2. HPAEC-PAD chromatograms of fructan oligomers showing six different profiles (A)-(F) in the order of increasing fructan content, found in grain samples of barley breeding lines and cultivars. Barley sample 1, 2 and 5 belonged to profile (A); 3, 4 and 6 to (B); 7, 9 and 13 to (C); 8, 14 and 15 and to (D); 10, 12, 17 and 18 to (E); and 11, 16, 19 and 20 to (F). Samples representing each group are highlighted in bold. Degree of polymerisation (DP) ranges are indicated between DP 3-4, DP 5 - 9, DP 10 - 15 and DP > 15. Chromatograms: - - - fructanase treated; ___ fructanase untreated.
tification of single and multiple peaks belonging to fructan oligomers has been presented earlier [3] [6] [27] . In the present study ranges of DP were identified between DP 3 - 4, DP 5 - 9, DP 10 - 15 and DP > 15, to aid the comparison of fructan profiles in our 20 barleys.
According to changes in the size, number and ratio of fructan peaks with different DPs, or same DPs but different linkage structure, six separate profiles could be detected on the chromatograms (Figure 2). The differences in the profiles display the change in the size and structure of fructan with the increasing levels of accumulation in the grain. The amount of higher DP fructan seems to increase with the increasing fructan content. The ratio of peaks inside multiple overlapping peaks belonging to fructan oligomers with same DPs but different linkage structure is changing with higher levels of fructan concentration. This is in agreement with earlier studies [3] [27] which reported that after longer periods of accumulation wheat fructan had a higher ratio of (2-6)- linkages as opposed to the abundance of (2-1)-linkages in oligomers formed during early induction of synthesis. Roth et al. [28] analysed barley leaf by anion-exchange HPLC analysis and showed that isokestose (1-kestose) had a shorted retention time than kestose (6-kestose) which has the same DP but (2-6)-linkages; and nystose ((2- 1)-linked) was detected earlier than bifurcose which contains (2-6)-linkages, though these two peaks overlap, and has the same DP.
3.3. Relative Distribution of Barley Fructan with Different Degrees of Polymerisation
The relative distribution of fructan DP was characterised by calculating the area of fructan peaks in the HPAECPAD chromatograms corrected for fructanase treated background (Figure 2). The relative distribution of fructan DP in the different breeding lines and cultivars showed the same wide variation that was observed in fructan content (Figure 3). 1.6% - 8.4% of the fructan molecules had DP > 15 and 9.6% - 23.3% had DP 10 - 15 (5.2 and 2.4 fold difference, respectively). The majority of the molecules had a DP < 10, with a variation between 68.3% - 87.9% in the different barley lines and cultivars (Table 1). This is an interesting contradiction compared to the findings in rye flour where almost 50% of the molecules had DP > 9, and almost 20% showed a high degree of polymerisation (DP > 15) [24] , indicating different distribution of fructan chain length in barley and rye.
3.4. Correlations of Fructan Content and Degree of Polymerisation
Analysis of correlation was carried out on the results of 20 barley lines and cultivars to examine the relationship between content and DP of fructan and plant developmental traits.
Significant correlation (p = 0.021; r = 0.53) was found between grain fructan content and the proportion of long chain fructan polymers (DP > 9) (Figure 4). This positive correlation was already indicated by the fructan chromatogram profiles (Figure 2), where in the course of accumulation of fructan the amount of higher DP fructan increased with the growing fructan content. This has also been shown in wheat, where the DP of watersoluble carbohydrates (mainly fructan) was higher in samples with high contents, while the higher DP components (>6) decreased in samples with lower water-soluble carbohydrate contents [29] . The relative amount of short chain fructan (DP 3 - 4) was negatively correlated to long-chain fructan (DP > 9) and the DP 5 - 9 fructan fraction (p < 0.0001; r = –0.77 and p < 0.0001; r = –0.79, respectively). Short-chain fructan (DP 3 - 4) was probably replaced by longer chain fructan when the amount of total fructan increases.
4. Conclusion
The results presented in this work provide new information regarding the significant variation of fructan concentration that was observed in grains of the different genotypic lines and cultivars of barley. This information may be useful in the future for selecting barley lines and cultivars as raw material in healthy food products. In this study it was shown that with increasing content of fructan in the different barleys, the distribution of different chain lengths and probably the relative amount of branching in fructan changes, possibly due to the change in the ratio of (2-1)-and (2-6)-linkages (Carpita et al., 1991; Bancal et al., 1992; Roth et al., 1997). Positive correlation was found between the fructan content in barley and the proportion of long chain fructan polymers (DP > 9), which may be important when selecting barley cultivars to be used for food products due to the possible health promoting effects.
Acknowledgements
Financial support from BarleyFunFood – Barley for Functional Food and Feed, a joint program granted by the
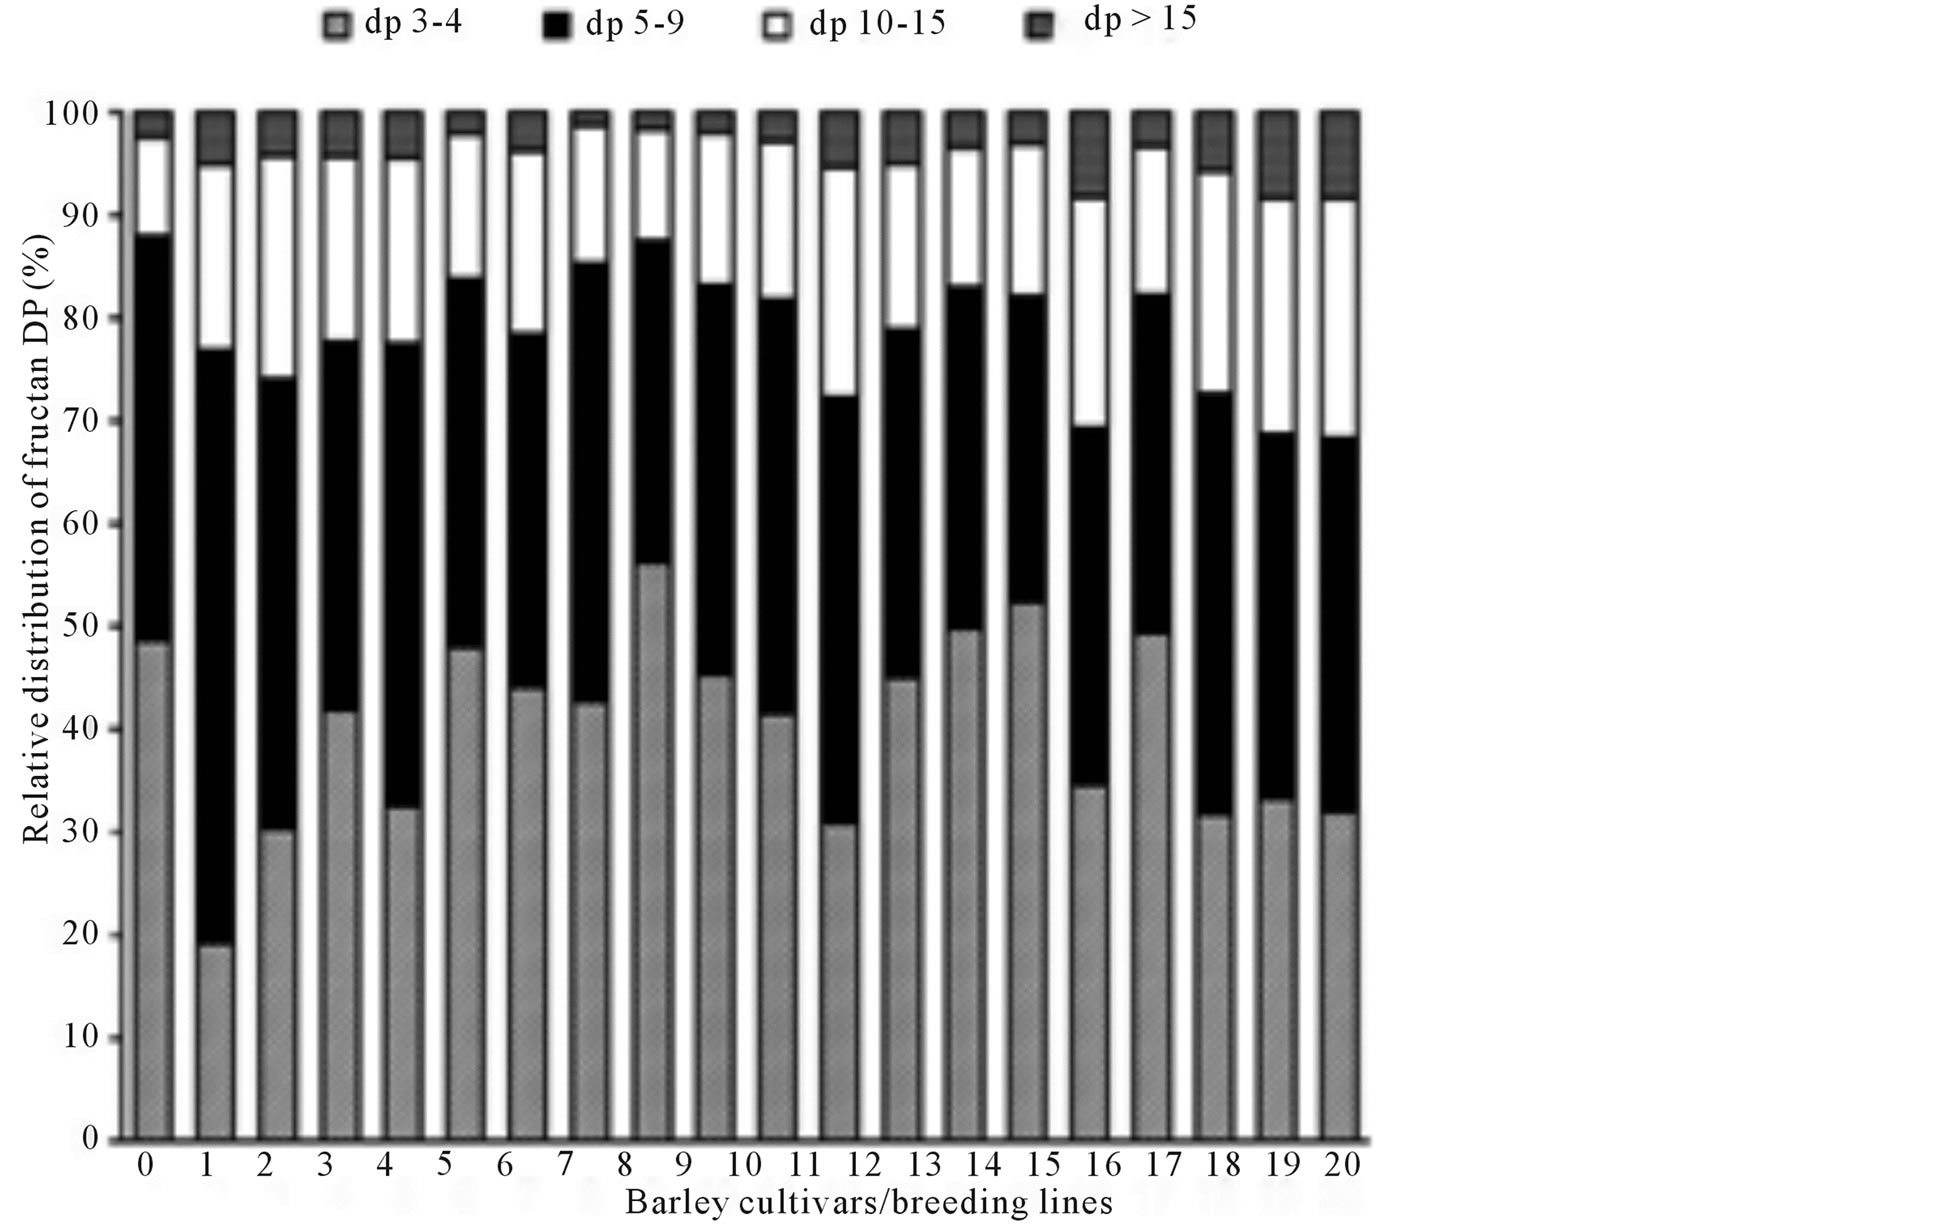
Figure 3. Relative distribution of fructan with different degrees of polymerisation (DP) in flour from 20 barley breeding lines and cultivars, shown in the order of increasing total fructan content. For sample numbers see Table 1.
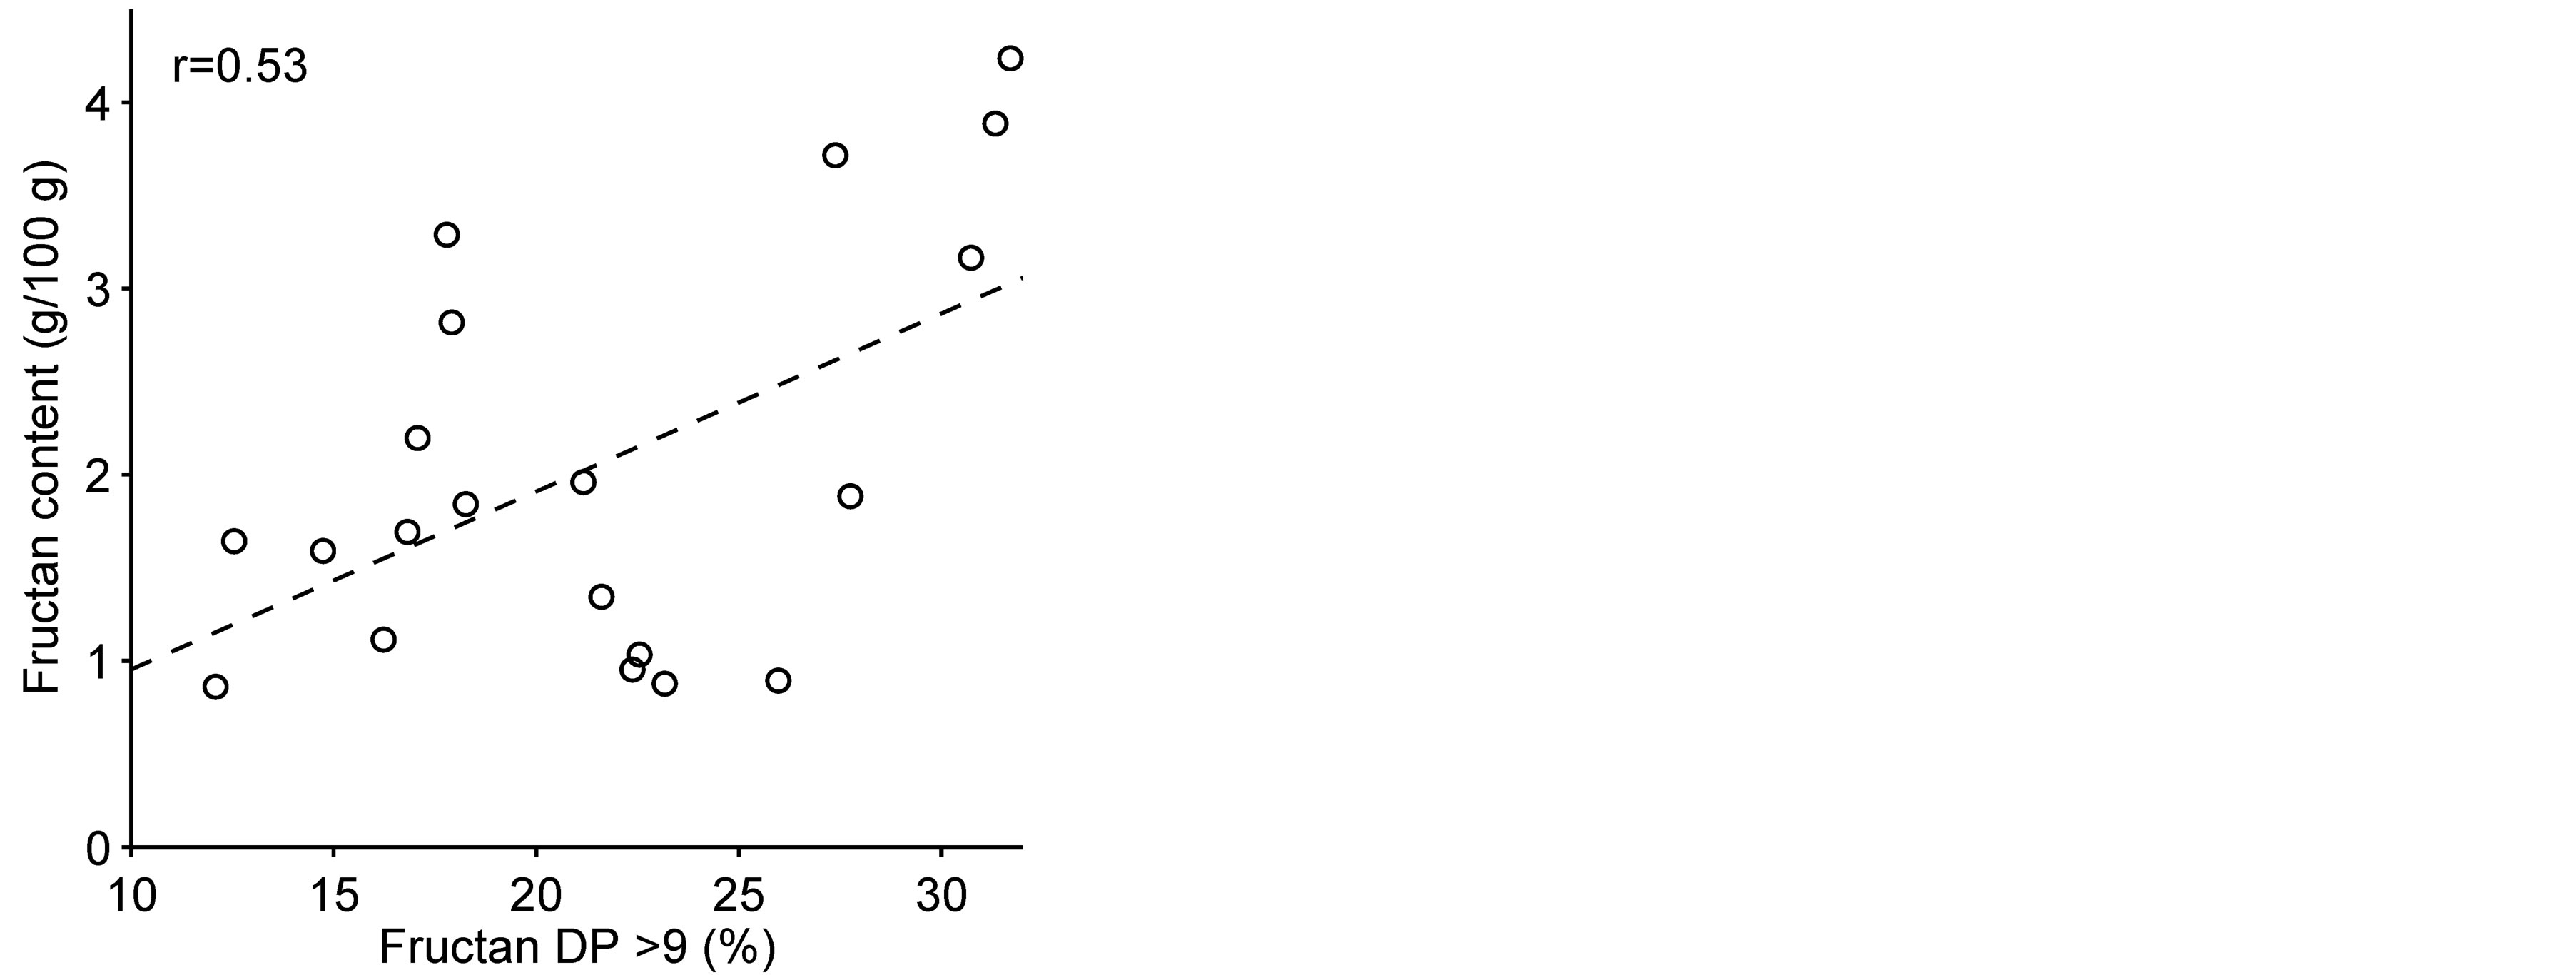
Figure 4. Correlation of grain fructan content and the relative amount of long chain fructans (DP > 9) in 20 barley lines and cultivars (p = 0.021). (r) = Pearson correlation value.
Faculty of Natural Resources and Agricultural Sciences, SLU; and Lantmännen AB is gratefully acknowledged. Therese Christerson and Eivor Svensson at Lantmännen SW Seed, Sweden, are acknowledged for supplying the barley grains.
References
- Ritsema, T. and Smeekens, S. (2003) Fructans: Beneficial for Plants and Humans. Current Opinion in Plant Biology, 6, 223-230. http://dx.doi.org/10.1016/S1369-5266(03)00034-7
- Livingston, D.P., Hincha, D.K. and Heyer, A.G. (2009) Fructan and Its Relationship to Abiotic Stress Tolerance in Plants. Cellular and Molecular Life Sciences, 66, 2007-2023. http://dx.doi.org/10.1007/s00018-009-0002-x
- Bancal, P., Carpita, N.C. and Gaudillere, J.P. (1992) Differences in Fructan Accumulated in Induced and Field-Grown Wheat Plants—An Elongation-Trimming Pathway for Their Synthesis. New Phytologist, 120, 313-321. http://dx.doi.org/10.1111/j.1469-8137.1992.tb01071.x
- Smeekens, S., Ebskamp, M., PilonSmits, L. and Weisbeek, P. (1996) Fructans. Engineering Plants for Commercial Products and Applications, 792, 20-25.
- Vijn, I. and Smeekens, S. (1999) Fructan: More Than a Reserve Carbohydrate? Plant Physiology, 120, 351-359. http://dx.doi.org/10.1104/pp.120.2.351
- Haskå, L., Nyman, M. and Andersson, R. (2008) Distribution and Characterisation of Fructan in Wheat Milling Fractions. Journal of Cereal Science, 48, 768-774. http://dx.doi.org/10.1016/j.jcs.2008.05.002
- Wagner, W., Keller, F. and Wiemken, A. (1983) Fructan Metabolism in Cereals—Induction in Leaves and Compartmentation in Protoplasts and Vacuoles. Zeitschrift Fur Pflanzenphysiologie, 112, 359-372. http://dx.doi.org/10.1016/S0044-328X(83)80053-1
- Scofield, G.N., Ruuska, S.A., Aoki, N., Lewis, D.C., Tabe, L.M. and Jenkins, C.L.D. (2009) Starch Storage in the Stems of Wheat Plants: Localization and Temporal Changes. Annals of Botany, 103, 859-868. http://dx.doi.org/10.1093/aob/mcp010
- Andersson, R., Fransson, G., Tietjen, M. and Åman, P. (2009) Content and Molecular-Weight Distribution of Dietary Fiber Components in Whole-Grain Rye Flour and Bread. Journal of Agricultural and Food Chemistry, 57, 2004-2008. http://dx.doi.org/10.1021/jf801280f
- Karppinen, S., Myllymäki, O., Forssell, P. and Poutanen, K. (2003) Fructan Content of Rye and Rye Products. Cereal Chemistry, 80, 168-171. http://dx.doi.org/10.1094/CCHEM.2003.80.2.168
- Huynh, B.-L., Palmer, L., Mather, D.E., Wallwork, H., Graham, R.D., Welch, R.M. and Stangoulis, J.C.R. (2008) Genotypic Variation in Wheat Grain Fructan Content Revealed by a Simplified HPLC Method. Journal of Cereal Science, 48, 369-378. http://dx.doi.org/10.1016/j.jcs.2007.10.004
- Vietor, R.J., Voragen, A.G.J., Angelino, S. and Pilnik, W. (1991) Nonstarch Polysaccharides in Barley and Malt—A Mass Balance of Flour Fractionation. Journal of Cereal Science, 14, 73-83. http://dx.doi.org/10.1016/S0733-5210(09)80019-2
- Nardi, S., Calcagno, C., Zunin, P., D’Egidio, M.G., Cecchini, C., Boggia, R. and Evangelisti, F. (2003) Nutritional Benefits of Developing Cereals for Functional Foods. Cereal Research Communications, 31, 445-452.
- Andersson, A.A.M., Andersson, R., Piironen, V., Lampi, A.-M., Nyström, L., Boros, D., Fras, A., Gebruers, K., Courtin, C.M., Delcour, J.A., Rakszegi, M., Bedõ, Z., Ward, J.L., Shewry, P.R. and Åman, P. (2013) Content of Dietary Fibre Components and Their Relation to Associated Bioactive Components in Whole Grain Wheat Samples from the HEALTHGRAIN Diversity Screen. Food Chemistry, 136, 1243-1248. http://dx.doi.org/10.1016/j.foodchem.2012.09.074
- Roberfroid, M.B. (2005) Inulin-Type Fructans: Functional Foods Ingredients. CRC Press, Boca Raton.
- Watzl, B., Girrbach, S. and Roller, M. (2005) Inulin, Oligofructose and Immunomodulation. British Journal of Nutrition, 93, 49-55. http://dx.doi.org/10.1079/BJN20041357
- Meyer, D. and Stasse-Wolthuis, M. (2009) The Bifidogenic Effect of Inulin and Oligofructose and Its Consequences for Gut Health. European Journal of Clinical Nutrition, 63, 1277-1289. http://dx.doi.org/10.1038/ejcn.2009.64
- Nilsson, U. and Nyman, M. (2005) Short-Chain Fatty Acid Formation in the Hindgut of Rats Fed Oligosaccharides Varying in Monomeric Composition, Degree of Polymerisation and Solubility. British Journal of Nutrition, 94, 705- 713. http://dx.doi.org/10.1079/BJN20051531
- Jenkins, C.D.J., Lewis, D., Bushell, R., Belobrajdic, D.P. and Bird, A.R. (2011) Chain Length of Cereal Fructans Isolated from Wheat Stem and Barley Grain Modulates in Vitro Fermentation. Journal of Cereal Science, 53, 188-191. http://dx.doi.org/10.1016/j.jcs.2010.12.001
- Belobrajdic, D.P., Jenkins, C.L.D., Bushell, R., Morell, M.K. and Bird, A.R. (2012) Fructans Extracts from Wheat Stem and Barley Grain Stimulate Large Bowel Fermentation in Rats. Nutrition Research, 32, 599-606. http://dx.doi.org/10.1016/j.nutres.2012.06.009
- Baik, B.K. and Ullrich, S.E. (2008) Barley for Food: Characteristics, Improvement, and Renewed Interest. Journal of Cereal Science, 48, 233-242. http://dx.doi.org/10.1016/j.jcs.2008.02.002
- (2000) AACC Method 44-15A. Approved Methods of the AACC, 10th Edition, MN American Association of Cereal Chemists, St Paul.
- McCleary, B.V., Murphy, A. and Mugford, D.C. (2000) Measurement of Total Fructan in Foods by Enzymatic/Spectrophotometric Method: Collaborative Study. Journal of AOAC International, 83, 356-364.
- Rakha, A., Åman, P. and Andersson, R. (2010) Characterisation of Dietary Fibre Components in Rye Products. Food Chemistry, 119, 859-867. http://dx.doi.org/10.1016/j.foodchem.2009.09.090
- Munck, L., Moller, B., Jacobsen, S. and Sondergaard, I. (2004) Near Infrared Spectra Indicate Specific Mutant Endosperm Genes and Reveal a New Mechanism for Substituting Starch with (1-3,1-4)-Beta-glucan in Barley. Journal of Cereal Science, 40, 213-222. http://dx.doi.org/10.1016/j.jcs.2004.07.006
- Vietor, R.J., Voragen, A.G.J., Angelino, S. and Pilnik, W. (1991) Nonstarch Polysaccharides in Barley and Malt—A Mass Balance of Flour Fractionation. Journal of Cereal Science, 14, 73-83. http://dx.doi.org/10.1016/S0733-5210(09)80019-2
- Carpita, N.C., Housley, T.L. and Hendrix, J.E. (1991) New Features of Plant-Fructan Structure Revealed by Methylation Analysis and C-13 Nmr-Spectroscopy. Carbohydrate Research, 217, 127-136. http://dx.doi.org/10.1016/0008-6215(91)84123-V
- Roth, A., Lüscher, M., Sprenger, N., Boller, T. and Wiemken, A. (1997) Fructan and Fructan-Metabolizing Enzymes in the Growth Zone of Barley Leaves. New Phytologist, 136, 73-79. http://dx.doi.org/10.1046/j.1469-8137.1997.00714.x
- Ruuska, S.A., Rebetzke, G.J., van Herwaarden, A.F., Richards, R.A., Fettel, N.A., Tabe, L. and Jenkins, C.D.L. (2006) Genotypic Variation in Water-Soluble Carbohydrate Accumulation in Wheat. Functional Plant Biology, 33, 799-809. http://dx.doi.org/10.1071/FP06062