Food and Nutrition Sciences
Vol.5 No.4(2014), Article ID:42783,7 pages DOI:10.4236/fns.2014.54047
Impact of Using Stevia on Physicochemical, Sensory, Rheology and Glycemic Index of Soft Ice Cream
1Department of Nutrition and Diet Therapy, Faculty of Nutrition, Tabriz University of Medical Sciences, Tabriz, Iran; 2Department of Food Sciences and Technology, Faculty of Nutrition, Tabriz University of Medical Sciences, Tabriz, Iran; 3Department of Community Nutrition, Faculty of Nutrition, Tabriz University of Medical Sciences, Tabriz, Iran.
Email: *m_azizi766@yahoo.com
Copyright © 2014 Mohammad Alizadeh et al. This is an open access article distributed under the Creative Commons Attribution License, which permits unrestricted use, distribution, and reproduction in any medium, provided the original work is properly cited. In accordance of the Creative Commons Attribution License all Copyrights © 2014 are reserved for SCIRP and the owner of the intellectual property Mohammad Alizadeh et al. All Copyright © 2014 are guarded by law and by SCIRP as a guardian.
Received December 8th, 2013; revised January 8th, 2014; accepted January 15th, 2014
KEYWORDS: Glycemic Index; Stevia; Ice Cream; Overrun; Melting Rate
ABSTRACT
The aim of this study was to formulate and develop a low calorie and low glycemic index (GI) of soft ice cream by using mixture of sucrose and Stevia. Five different formulations of ice cream were produced by using different proportions of sucrose and Stevia. Physicochemical characteristics, hedonic sensory evaluations and glycemic index determination of products were carried out by following conventional methods. Replacement of sucrose with Stevia resulted in a significantly lower viscosity and brix with a higher overrun and melting rate in a dose dependent manner. Total replacing of sucrose with Stevia resulted in significant reduction in caloric value from 143.03 to 105.25 Kcal and GI from 79.06 ± 4.0 to 72.18 ± 5.27 as compared to those of sucrose based formulation (p < 0.05) indicating a 37.78% and 6.88% reduction, respectively. TB had the best sensory acceptance among all the treatments. We concluded that substitution of sucrose with Stevia may be a choice to produce low caloric and GI ice creams. However, using mixture of the two sweeteners improves sensory acceptance of the formulations.
1. Introduction
Ice cream is the most popular frozen dessert all over the globe. It is a combination of milk, sweetener, stabilizer, emulsifier and flavoring agents, egg products, coloring additives and hydrolyzed products of starch. Three important structural compositions of ice cream are: air cells, ice crystals and fat corpuscles which are dispersed in connected phase from a non-frozen solution [1]. Among this variety of ingredients, sweeteners are more important factors on consumer’s acceptance mainly due to their influential effect on freezing point, viscosity and maintaining good texture [2].
Wide range of sweeteners has been used in ice cream formulation. For both economic and rheology reasons, sucrose is the most frequent used sweetener used in ice cream production. However, it has many disadvantages due to high glycemic index (GI) which is correlated with, metabolic syndrome, diabetes mellitus (DM), obesity, hypertension, ischemic heart diseases and dental caries [1, 3]. Therefore, in the recent decades, artificial sweeteners have been suggested to be substituted with sucrose [4]. Although, these compounds produce little or no calories but a variety of safety issues has been raised including carcinogenicity, teratogenicity and interference with some metabolic or vascular diseases. Thus, many attempts have been focused on application of natural sweeteners in producing sugar containing food stuff [5].
Stevia which is a short & shrubby plant growing in Amambi mountainous area of Brazil & Paraguay is a non-artificial sweetener with relative sweetness 250 - 300 as compared to sucrose. It is a very low calorie compound which makes it a good alternative of sugar for patients suffering from DM and other sedentary life related diseases [6]. This plant has been used in formulation of many sugar free foods including Custard, Kulfi, Sandesh [7] and biscuit [8]. Despite many artificial sweeteners, Stevioside are recognized as safe supplements by JECFA, WHO and Food and Drug Administration (FDA) with relatively high upper limits [9-11].
A global increase in production and consumption of ice cream as a highly nutritive dessert parallels with increased trend in prevalence of DM, obesity and Ischemic heart diseases [5,12]. This product has been widely accepted by children and other age groups and has been including in food basket of many families in different countries. Production of an ice cream with a relatively low calorie value and lower GI will be partly helpful in better management of overweight epidemics and impeding occurrence of life style related disease. The aim of the current study was to examine GI, rheology, sensory and physicochemical characteristics of soft ice creams formulated with different proportions of sucrose/Stevia and to introduce a novel Stevia based ice cream.
2. Materials and Methods
2.1. Preparation of Ice Cream
To prepare different treatments of ice creams, 500 ml of skimmed milk with 1.5% fat, 8% solid non fats was pasteurized by high-temperature and short time method and mixed with 120 g cream powder, 80 g full cream milk powder containing 30% fat, 1 g emulsifier (guar gum, locust bean gum) and 0.9 gram vanilla and homogenized by a stirrer (Heidolph RZR 2012 control, Japan) with 800 rpm for one minute. As shown in Table 1, varying proportion of Stevia (St) (purification rate of 90% type of SU200, IRAN, Stevia Pac), and sucrose (su) was added to make five different ice cream formulations followings: 1) treatment A (TA) 18.6 gram (su), 2) treatment B (TB) 13.95 gram (su) and 20 mg (St), 3) treatment C (TC) 9.3 gram (su) and 40 mg (St), treatment D (TD) 4.65 gram (su) and 70 mg (St) and treatment E (TE) 110 mg (St) without any sugar. All the treatments were homogenized at 70˚C and 85 Pascal (Pa). The mixture was pasteurized for thirty seconds at 80˚C. The mix was incubated at 10˚C - 15˚C for 20 minutes and kept on 4˚C for 12 hours.
2.2. Physicochemical Assessments
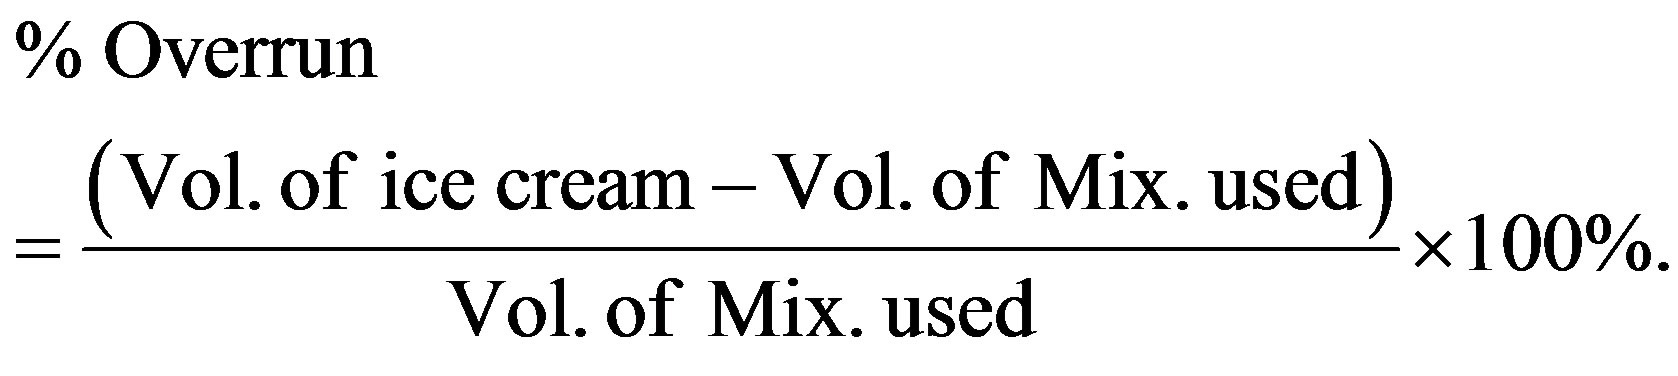
Ice cream overrun assessment was performed by using weight method [13]. The equation used for calculation was as following:
Determination of total protein and fat were performed by Kjeldahl (AOAC; 930.33) and Gerber (AOAC 952.06) methods, respectively [14].
According to the methodology proposed by Lee and White [15], all the treatments were stored at −18˚C before carrying out the melting test. Ice cream samples (100.0 ± 2.0 g) were placed on a mesh grid (mesh size 1-1 cm) and maintained in a controlled temperature chamber at 25˚C, under constant humidity (≈50%). The dripped volume was measured every 5 minutes for 60 minutes. The weight of the material passing through the screen was recorded and used to determine the melting rate (g/minute).
The viscosities of the ice creams were taken at 15˚C using a digital Brookfield Viscometer, (Physical, Anton Paar GmbH, and Graz, Austria). Before measuring the viscosity, the samples was stirred gently to remove the air from the mixes [16]. Caloric content of each treatment was calculated using food analysis software (Nutritionist 4, Nutrition Marker Plus).
2.3. Sensory Evaluation
The sensory evaluation tests were performed with human volunteers according to a previously described method

Table 1. Components of soft and Stevia ice cream.
[17]. Before testing, the volunteers (n = 26) were asked to keep the tested tablets in their mouths and were not told the constituent for each tested tablets. After tasting the tablet, they were asked to give precisely their flavor sensation. All samples were chewed and kept in the mouth for 15 s. The sensory evaluations were repeated consecutively for all the samples with a 15 minutes time gap to perform mouth washing by the volunteers. The panelists were requested to rank between “0” as uncharacterized intensity, and “5” as very strong intensity. All experiments were carried out in triplicate and the results were reported as the mean values for basic flavors (sweet, bitter), color, texture and total mean liking.
2.4. Measurement of Glycemic Index
To measure GI, ten volunteers, 2 men and 8 women, were recruited in the study. Inclusion criteria were: Normal health according to a complete physical examination, normal fasting and post prandial glucose levels and not receiving any medications or food supplements. All the participants had written an informed consent. The study was approved by the medical ethics committee of the Tabriz University of Medical Sciences. The study was registered at national randomized clinical trial directory [18].
Every volunteer were requested to maintain themselves on overnight fasting for ten minutes. To calculate reference glycemic response, the participants were then asked to take 50 g pure glucose in 150 ml drinking water and their plasma glucose was tested for two hours and in 15 minutes intervals. The blood glucose levels were determined by capillary blood glucose analyzer (Beurer, Art-Nr.463.00, Germany). The experiments were repeated for two consecutive days using 61.5 g of soft ice cream (TA), 153.8 g of a sample Stevia ice cream (TE) to provide ice creams with 50 gram of carbohydrate in each test meals. Then, related curves were drawn based on obtained blood glucose levels and the area under curve was measured from 0 to 120 minutes by numerical integration for of all samples. Finally, GI was calculated by using following equation:
Glycemic index = area under glycemic increase curve in 0 to 120 minutes for consumed ice cream/area under glycemic increase curve in 0 to 120 minutes for standard sample.
2.5. Ethical Considerations
All the participants had written an informed consent. The study was approved by the medical ethics committee of the Tabriz University of Medical Sciences, Tabriz, Iran. The study was registered at national randomized clinical trial directory.
2.6. Statistical Analysis
All the assessments were repeated three times. Data were first examined by Kolmogorov-Smirnov test to ensure normality. They were then expressed as mean ± SDV. Comparison within each group were done by one way analysis of variance followed by the Tukey’s test. All the analysis were performed using SPSS software, version 17.1 (SPSS, Chicago, Illinois, USA).
3. Results and Discussions
3.1. Effect of Replacement Sucrose with Stevia on Physicochemical Properties of Product
Ingredient of soft and Stevia ice creams are summarized in Table 2. Viscosity or resistance to flow is the most important feature of ice cream mixture. It was found that ice cream samples with very little or no sucrose (TD and TE) had the lowest viscosity. As shown in Table 3, the samples had relatively low viscosity as compared to TA. This seems reasonable since changing type of sweetener has been known to influence viscosity of ice creams. Also, disaccharides such as sucrose produce high osmolality solutions due to their solubility and hydrophilic characteristic and have capacity to make hydrogen bonds with water molecules by a hydroxyl group [19], which in turn augments viscosity of ice cream mixtures. Interestingly, level of sweeteners tendency to absorb water is dependent on molecular size of these compounds. Whatever saccharide molecular weight is less, tendency to absorb water will be more and viscosity would be increased [19,20].
Air in ice cream provides a light texture and influences the physical properties of melting down and hardness [3]. It is suggested that a very low overrun is associated with soggy configuration while an increased overrun results in a puffy tissue [13]. As shown in Table 3, we found significant change in percentage of overrun among all the treatments with the lowest percent (53.37 ± 0.76) in TA and the highest (65.03 ± 0.25) in TE.
Although many factors affect overrun including viscosity, fat, emulsifier, stabilizer contents and processing conditions, viscosity has been reported to be an important factor [13,15]. A higher viscosity observed in ice creams
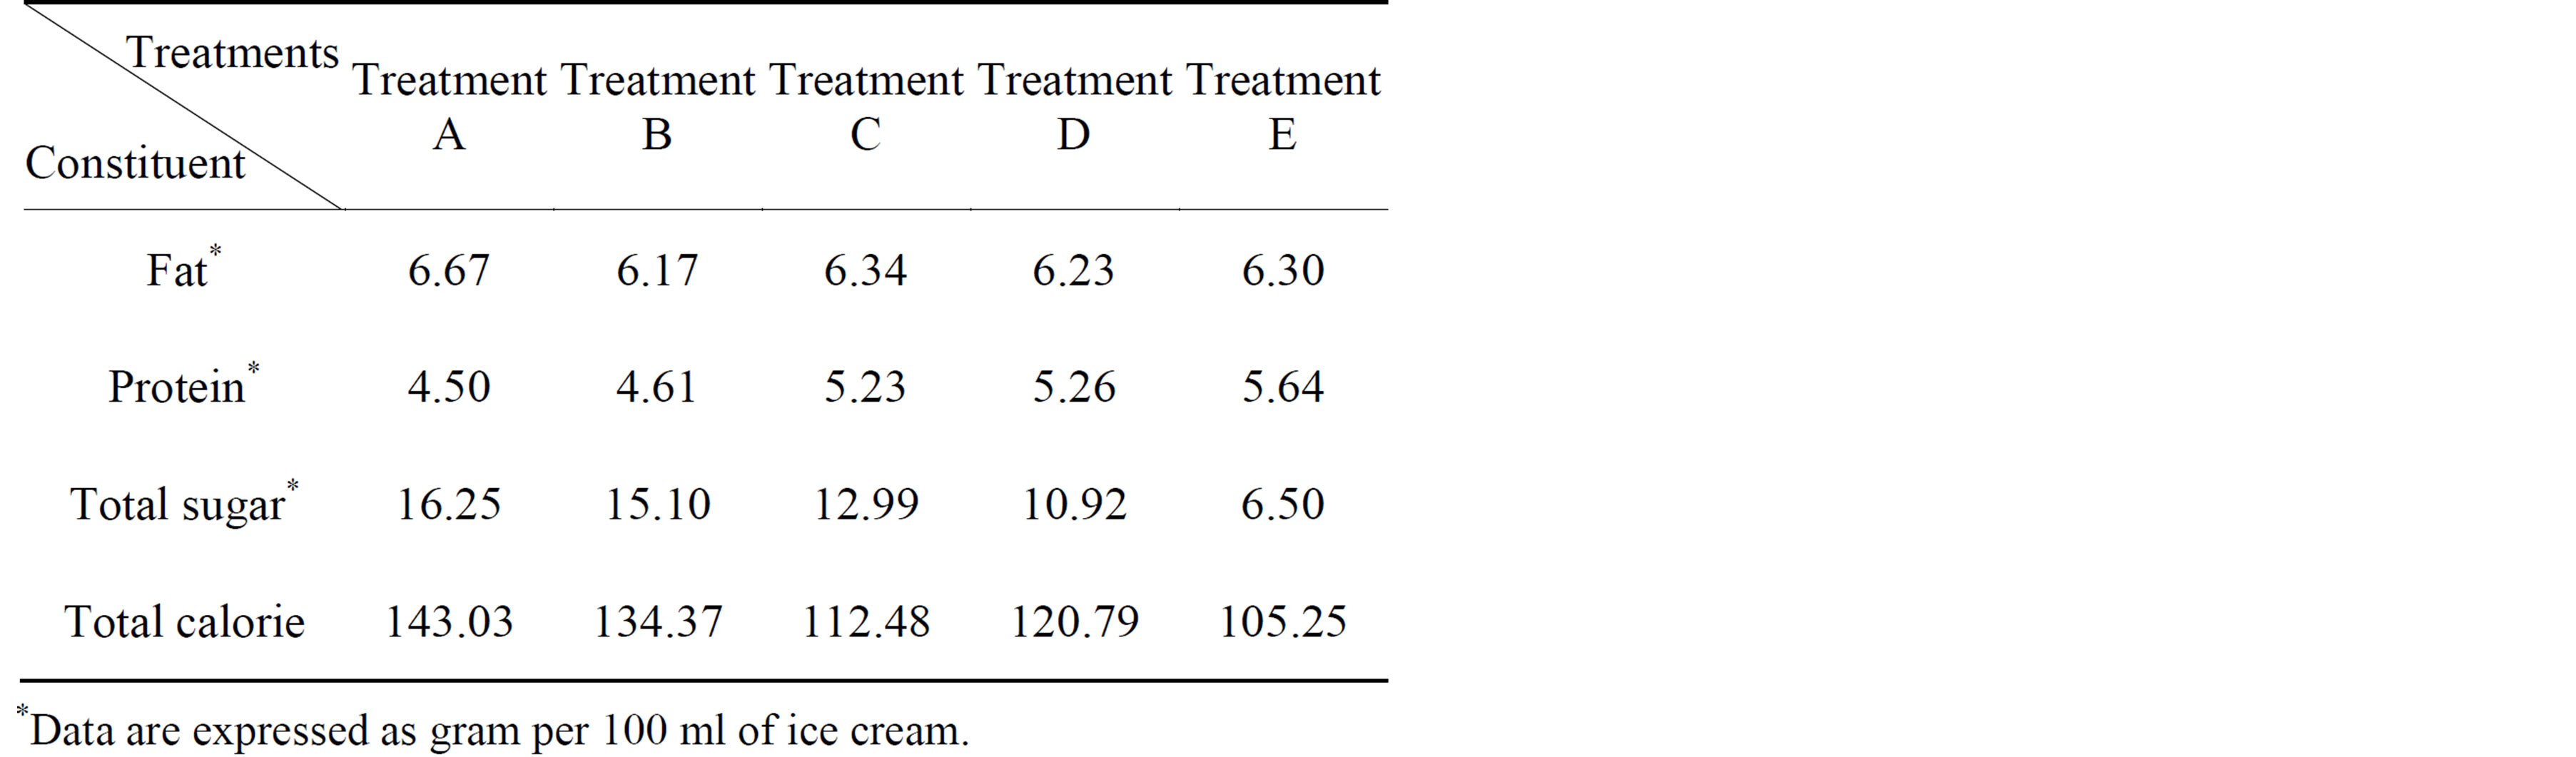
Table 2. Ingredients of soft and Stevia ice cream.

Table 3. Physicochemical and rheology properties of soft and Stevia ice cream.
with high sugar contents (TA and TB) together with lower viscosity in those with little or no added sugars (TD, TE) implies that ice creams with high sucrose have relatively lower overrun. The findings were in agreement with a previous report [21,22], that carbohydrates possess an enhancement in viscosity and do not exhibit remarkable foaming capacity.
As shown in Figure 1, ice cream melting rate showed an increasing trend in proportional to amount of used Stevia. Also, the ice creams with low overruns melted slowly.
A lower melting resistance in the ice creams with high overruns is mainly attributed to a reduced rate of heat transfer across air bubbles [23]. Besides, it has been reported that sugars with lower molecular have a decreased melting resistance as compared to those with higher molecular weight [23,24]. It was concluded that therefore, the slower thawing of the ice creams produced with sucrose was associated to the size and molar weight of the chains of this disaccharide [25,26].
3.2. Effect of Replacing Sucrose with Stevia on Glycemic Index and Caloric Measurement
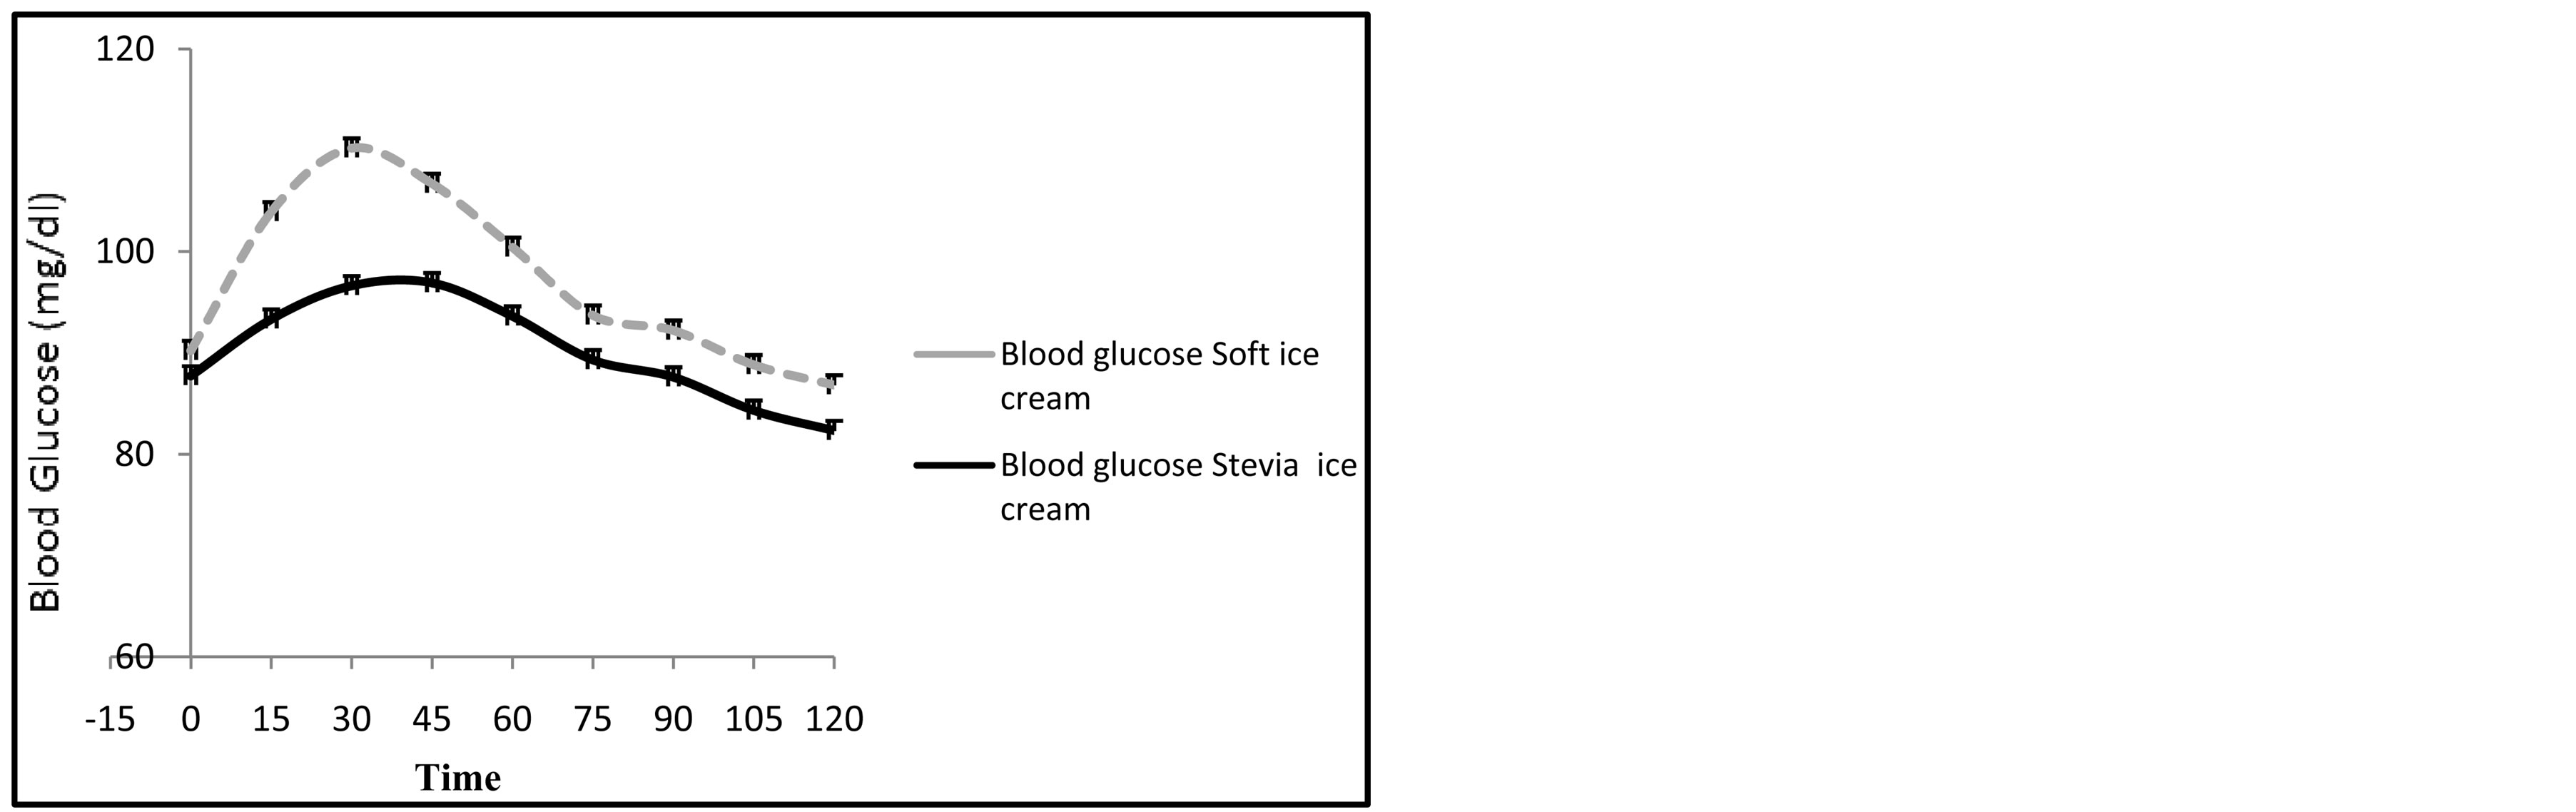
Young, apparently healthy adults with average age of 23.3 ± 4.16 years were included to do this test. Mean body mass index of the participants was 23 ± 4.37. The mean glycemic index of ice Cream formulated with or without sucrose was calculated as 79.06 ± 4.01 and 72.18 ± 5.27, respectively (Figure 2). In addition, mean calorie value of these two ice creams was 143.03 and 105.26.
Level of post-prandial blood glucose is a major factor to predict profile of insulin resistance and incidence of DM. The level is affected by both amount and type of carbohydrate consumed. The concept of GI was introduced [18] to bring into account importance of the latter in glucose response and subsequent development of insulin resistance and DM. This naturally occurring biologic response is referred to time course of glucose entrance into blood circulation after consumption of a proper meal and its trend of inductive effect on pancreatic β-cells to produce and secret insulin. Accumulative data elucidated a positive correlation between increased dietary GI, amount of calory and risk for coronary heart disease [5].
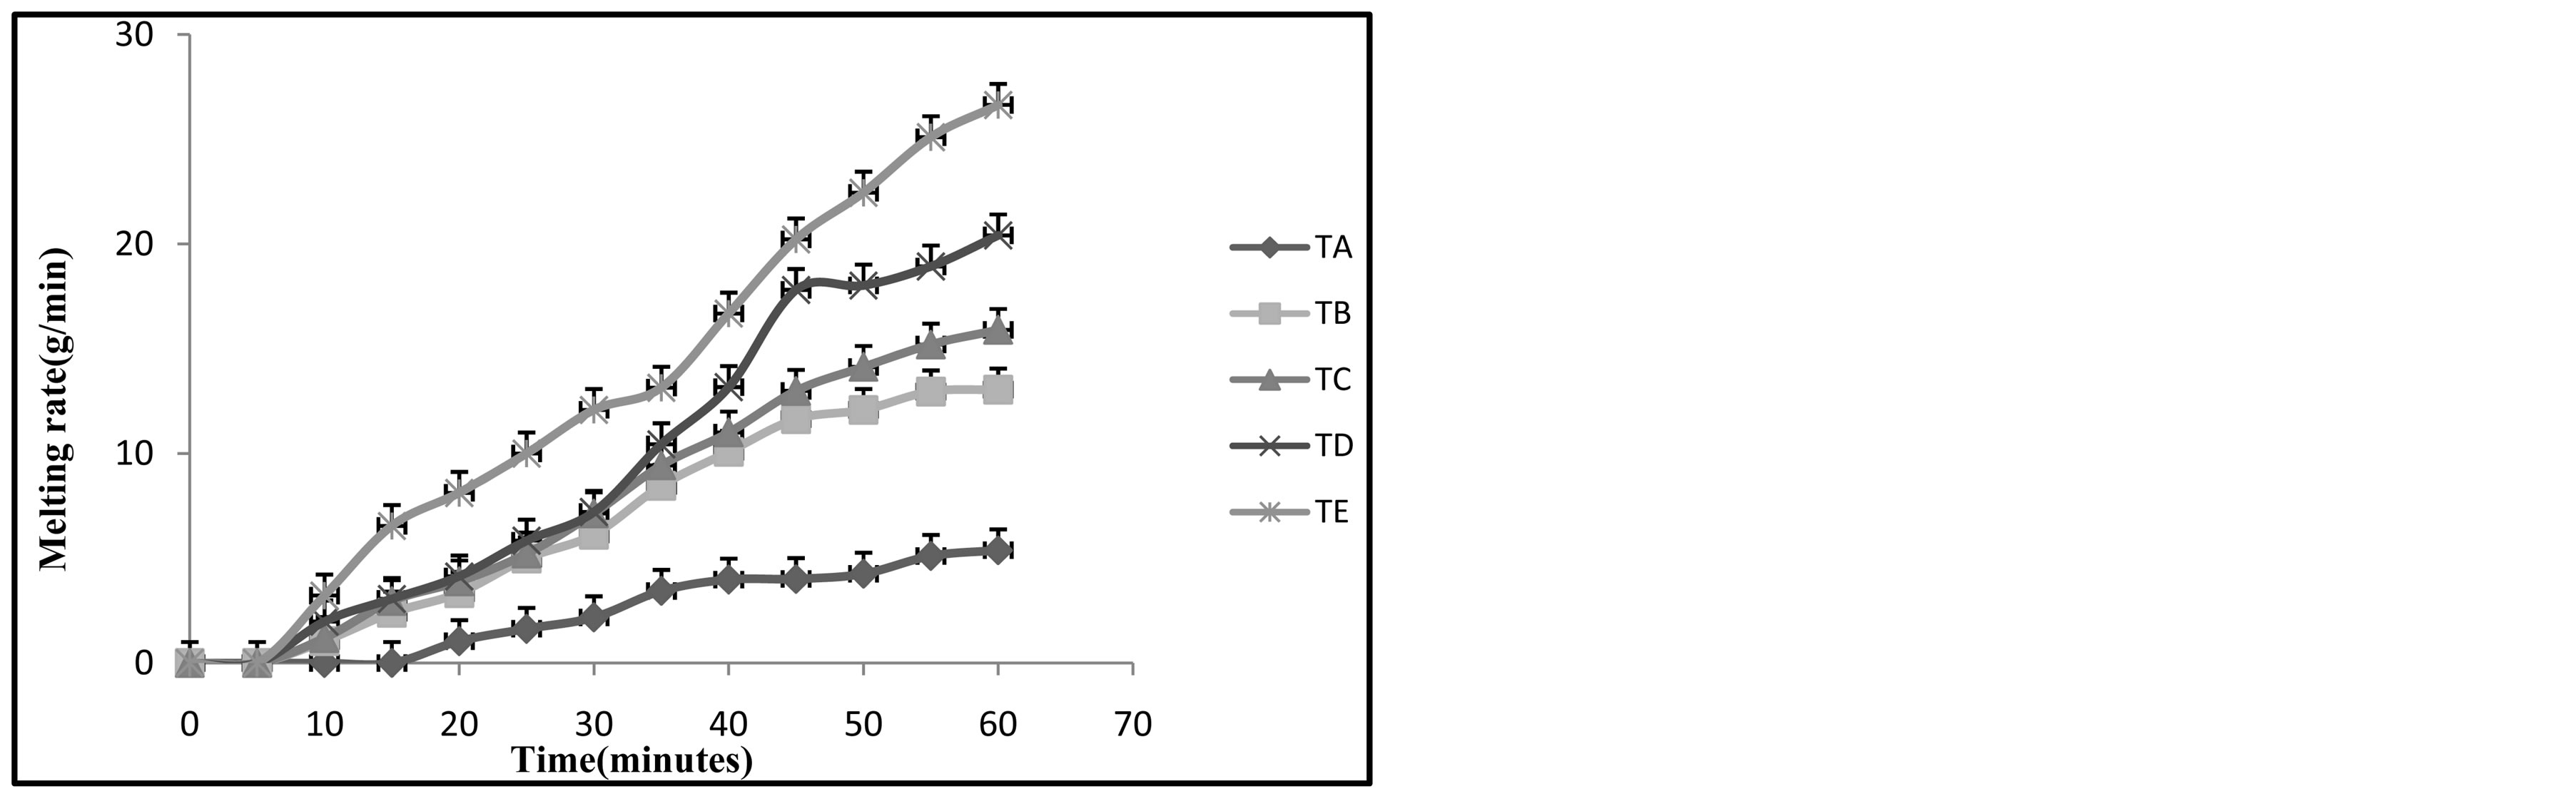
Figure 1. Melting rates (g/minute) of ice creams during two hours period. Formulations of the ice creams were as followings: TA = 18.6 gram sucrose added to soft ice cream/0 gram Stevia. TB = 13.95 gram sucrose added to soft ice cream/4.65 gram Stevia. TC = 9.3 gram sucrose added to soft ice cream/9.3 gram Stevia. TD = 4.65 gram sucrose added to soft ice cream/13.95 Stevia/. TE = 0 gram sucrose added to soft ice cream/18.6 gram Stevia. Data are presented as mean ± SD.
Judging from the remarkable reduction in caloric value and GI of Stevia based ice creams (TD and TE), we suggest that substitution of Stevia with sugars brings a new relatively healthy choice for food basket of families with high risk of life style related diseases including DM [18, 27,28].
3.3. Effects of Replacing Sucrose with Stevia on Sensory Properties
Sensory evaluations were conducted to determine relevance of Stevioside as a natural sweetener as presented Figure 3, in the products [29], different amounts of Stevia and sucrose did not result in difference in the color of the products. Substitution of sucrose with Stevia decreased flavor, tissue and mean liking scores of the products. The suitability of taste, texture and mean liking was relatively higher in TC as compared to other ice creams.
The sweetening power and persistence of sweet taste by Stevioside are affected by several factors such as concentration, ingredients and temperature of ice cream. It has been described that addition of very high concentrations of Stevia to many food products negatively in-
 (a)
(a)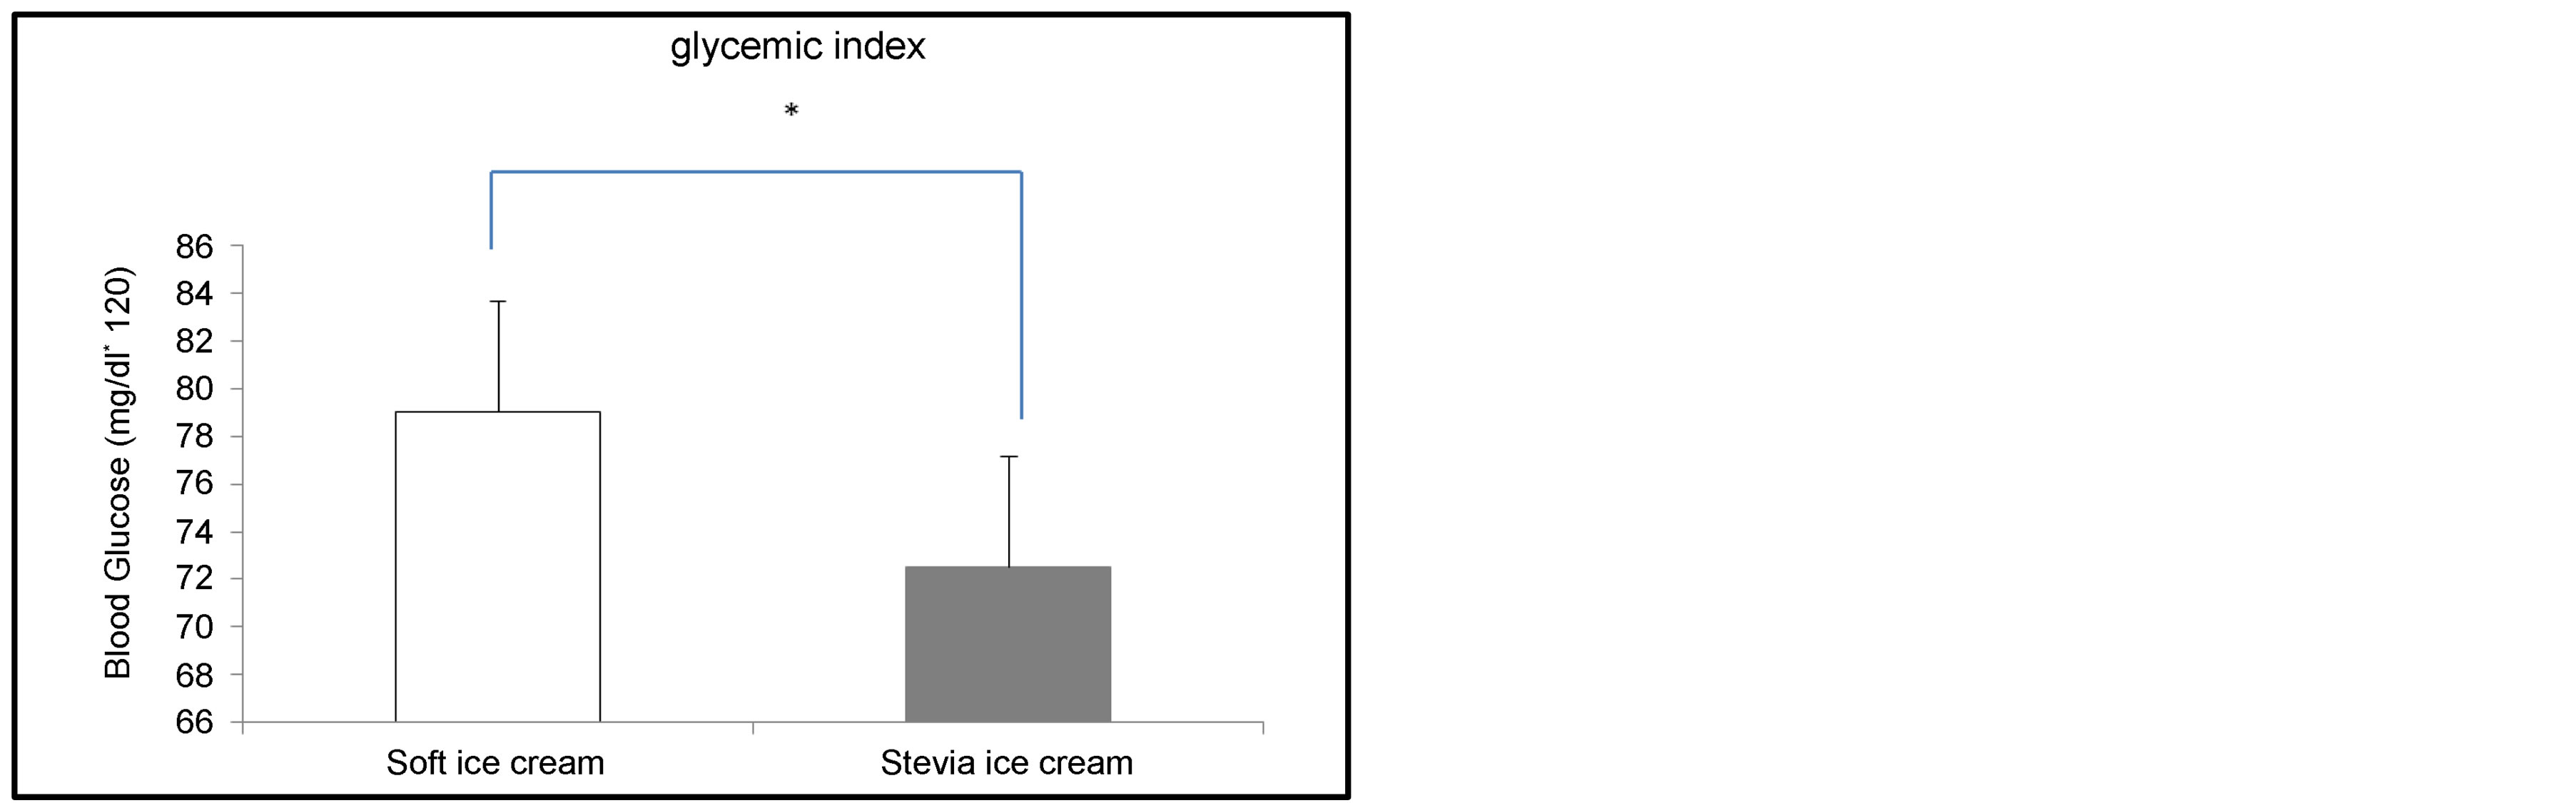 (b)
(b)
Figure 2. (a) Trend of blood glucose response during 120 minutes after consumption of sugar and Stevia based ice creams (b) glycemic index of the two ice cream formulations. A single asterisk indicate p value less than 0.05.
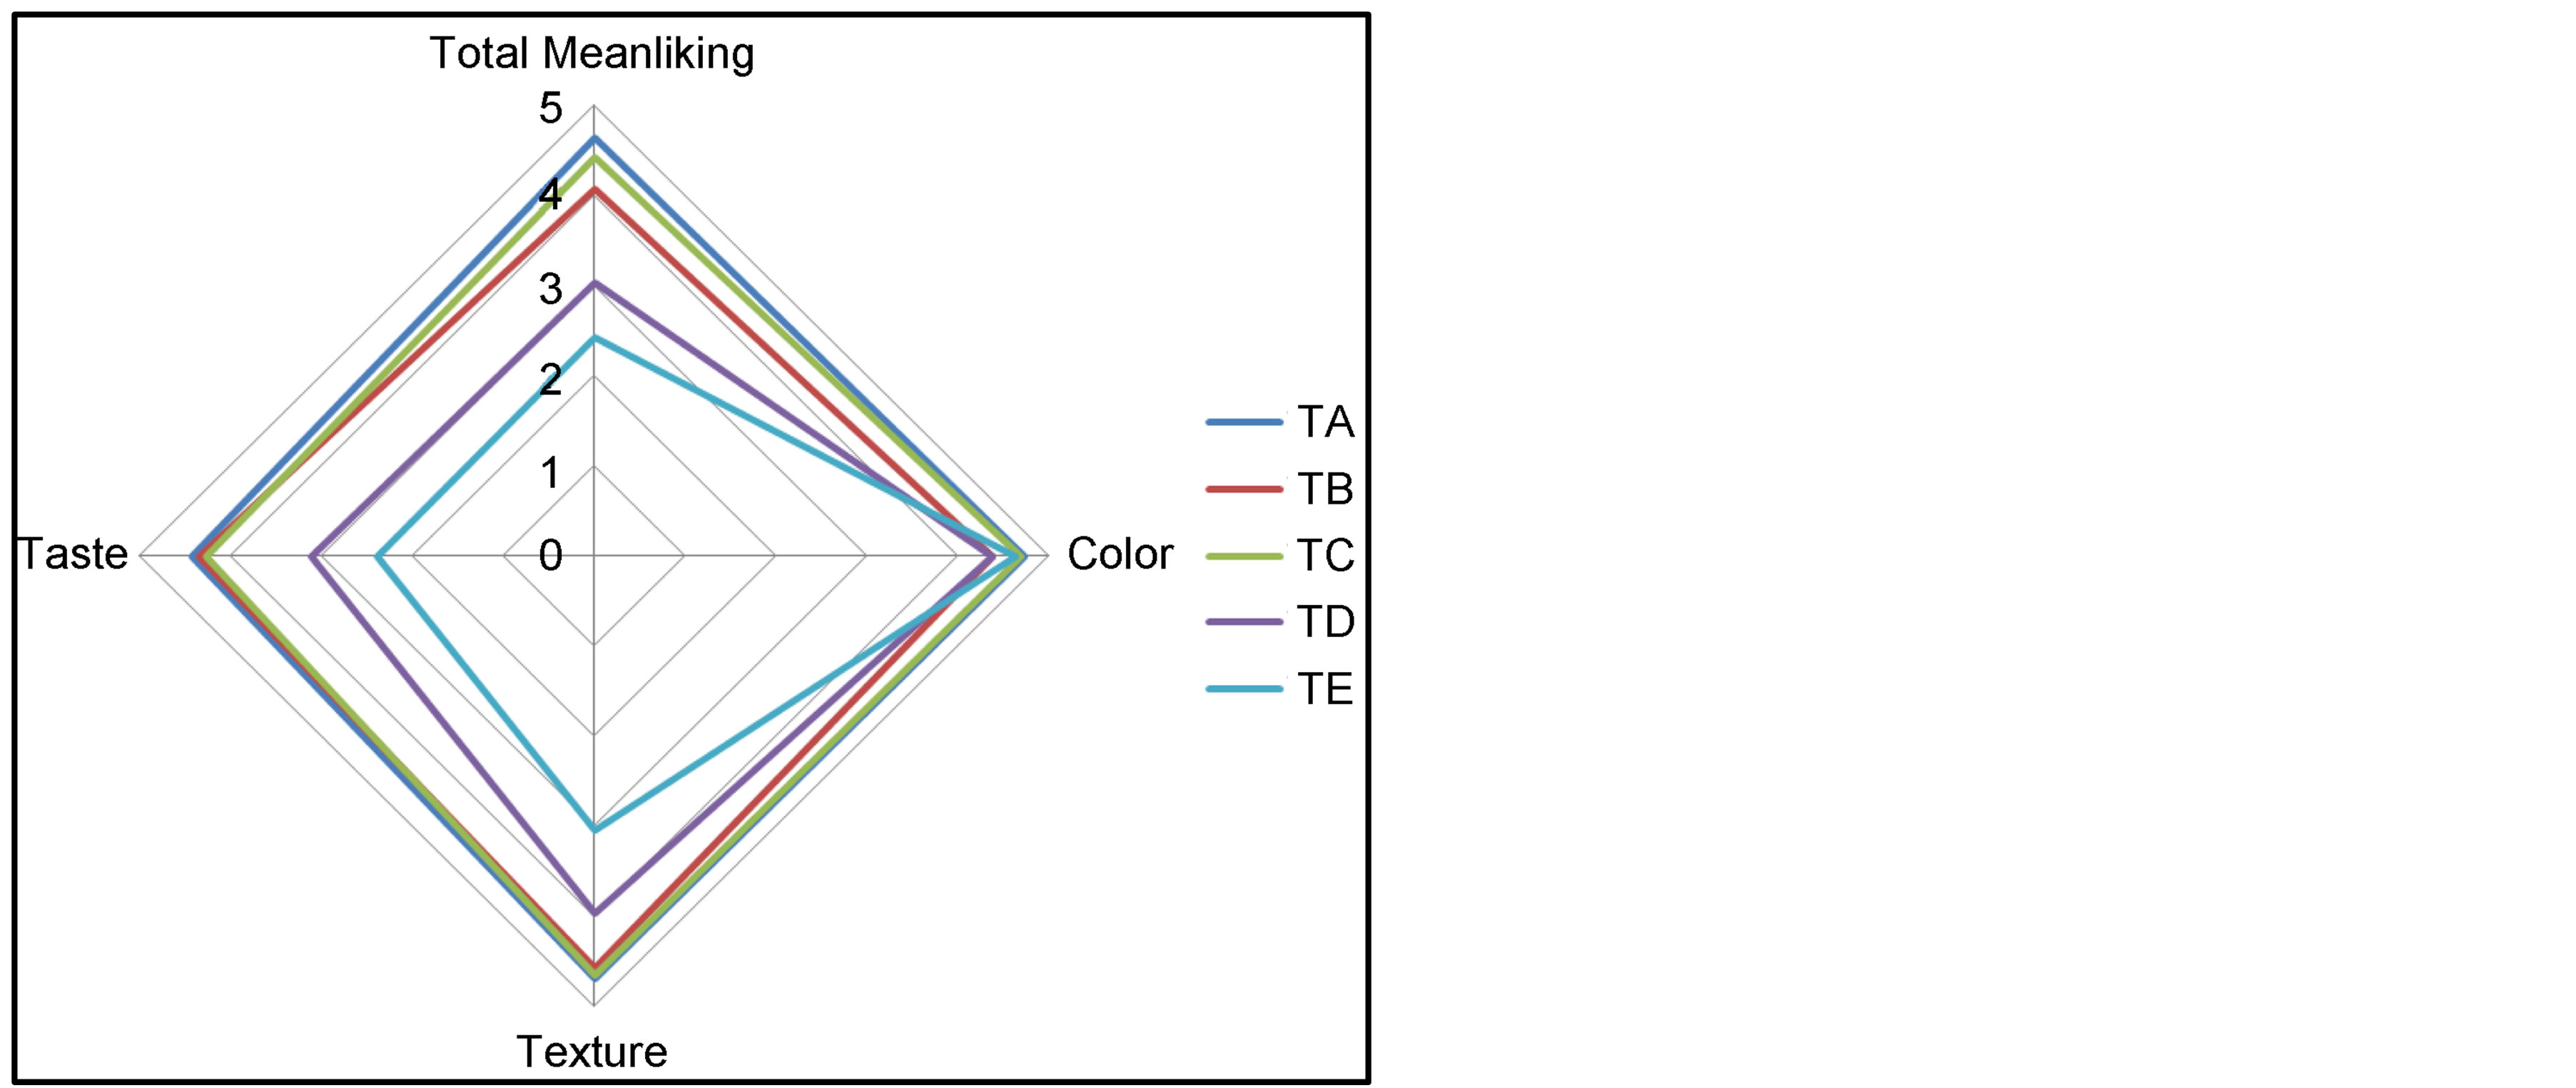
Figure 3. Sensory properties of soft and Stevia ice cream. Formulations of the ice creams were as followings: TA = 18.6 gram sucrose added to soft ice cream/0 gram Stevia. TB = 13.95 gram sucrose added to soft ice cream/4.65 gram Stevia. TC = 9.3 gram sucrose added to soft ice cream/9.3 gram Stevia. TD = 4.65 gram sucrose added to soft ice cream/13.95 Stevia/. TE = 0 gram sucrose added to soft ice cream/18.6 gram Stevia.
fluences mean liking of those products [29-31]. In addition, a bitter aftertaste is a major problem associated with many sweeteners which limits their use at high concentrations. Further, the bitter aftertaste of Stevioside is more persistent than other natural and synthetic sweeteners and appears in a dose dependent manner [29]. On the other side, sucrose has many disadvantages due to its high glycemic index which facilitates development of many metabolic diseases such as DM, metabolic syndrome and obesity. These diseases further predispose individuals to many serious pathologic conditions including cardiovascular diseases, cerebrovascular accidents and even malignancies. Thus, it seems reasonable to use natural sweeteners such as Stevia in formulation of calorie dense foods despites some sensory limitations.
Our findings on sensory effect of Stevia are in consistent with previous reports [30,32]. Judging from results of the current study and some other reports [31,32] , it is concluded that sensory characteristics of the ice creams were related to both amount of Stevia used and its interactions with other components of the products.
4. Conclusion
In conclusion, the current study has shown that application of Stevia, as a natural sweetener, has a positive impact on producing an ice cream with remarkably low calorie and glycemic index without impeding effect on physicochemical and sensory properties of the ice creams. We believe that this sweetener can be used for production of proper food samples with low calorie and low glycemic index.
Acknowledgements
This study was supported by a grant from Tabriz University of Medical Science, Tabriz, Iran.
REFERENCES
- R. T Marshall and W. S Arbuckle, “Ice cream,” 5th Edition, Chapman and Hall, New York, 1996, pp. 8-90. http://dx.doi.org/10.1007/978-1-4613-0477-7
- D. G. Land, “Perspectives on the Effects of Interactions on Flavor Perception: An Overview,” American Chemical Society, Vol. 633, No. 2, 1996, pp. 2-11.
- J. M. Aliha, M. Asgari, F. Khayeri, M. Ramazani, Z. Farajzadegan and J. Javaheri, “Group Education and Nurse-Telephone Follow-Up Effects on Blood Glucose Control and Adherence to Treatment in Type 2 Diabetes Patients,” International Journal of Preventive Medicine, Vol. 4, No. 7, 2013, pp. 797-802.
- A. Y. Leung and S. Foster, “Encyclopedia of Common Natural Ingredients Used in Food, Drugs and Cosmetics,” Wiley, New York, 1996, pp. 373-375.
- L. K. Mahan and S. Escott-Stump, “Krause’s Food and Nutrition Therapy,” 12th Edition, Saunders, St. Louis, 2013, pp. 764-809.
- L. L. Curry and A. Roberts, “Subchronic Toxicity of Rebaudioside A,” Food and Chemical Toxicology, Vol. 46, Suppl. 7, 2008, pp. 11-20. http://dx.doi.org/10.1016/j.fct.2008.04.042
- V. Agarwal, A. Kochhar and R. Sachdeva, “Sensory and Nutritional Evaluation of Sweet Milk Products Prepared, Using Stevia Powder for Diabetics,” Ethno Med, Vol. 4, No. 1, 2010, pp. 9-13.
- M. Hamzeluie, H. Mirzayi and M. Ghorbani, “Evaluation Effects of Evaluation of Sugar Replace by Glycosidic Sweeteners of Stevia on the Peroxide Index in Biscuit,” Journal of Agricultural Sciences and Natural Resources, Vol. 16, No. 1A, 2009, pp. 1-5.
- V. Reddy, A. Urooj and A. Kumar, “Evaluation of Antioxidant Activity of Some Plant Extracts and Their Application in Biscuits,” Food Chemistry, Vol. 90, No. 1-2, 2005, pp. 317-321. http://dx.doi.org/10.1016/j.foodchem.2004.05.038
- H. Wallin, “Steviol Glycosides,” 63rd Joint FAO/WHO Expert Committee on Food Additives (JECFA)—Chemical and Technical Assessment, 2007, pp. 1-8.
- FAO/WHO: JECFA, “Report of a Joint FAO/WHO Expert Consultation,” Rome, 1998, pp. 14-18.
- A. L. Jenkins, D. J. Jenkins, T. M. Wolever, A. L. Rogovik, E. Jovanovski, V. Bozikov, D. Rahelić and V. Vuksan, “Comparable Postprandial Glucose Reductions with Viscous Fiber Blend Enriched Biscuits in Healthy Subjects and Patients with Diabetes Mellitus: Acute Randomized Controlled Clinical Trial,” Croatian Medical Journal, Vol. 49, No. 6, 2008, pp. 772-782. http://dx.doi.org/10.3325/cmj.2008.49.722
- R. P. Sofjan and R. W. Hartel, “Effect of Overrun on Structural and Physical Characteristics of Ice Cream,” International Dairy Journal, Vol. 14, No. 3, 2004, pp. 255- 262.
- AOAC, “Official Method of Analysis,” 16th Edition, 3rd Revision, Association of Official Analytacal Chemists, Arlington, 1997.
- F. Y. Lee and C. H. White, “Effect of Ultrafiltration Retentates and Whey Protein Concentrates on Ice Cream Quality during Storage,” Journal of Dairy Science, Vol. 74, No. 4, 1991, pp. 1170-1180. http://dx.doi.org/10.3168/jds.S0022-0302(91)78270-2
- B. Özer, R. K. Robinson, A. S. Grandison and A. E. Bell, “Comparison of Techniques for Measuring the Rheological Properties of Labneh (Concentrated Yogurt),” International Journal of Dairy Technology, Vol. 50, No. 4, 1997, pp. 129-133. http://dx.doi.org/10.1111/j.1471-0307.1997.tb01753.x
- H. D. Goff, “Dairy Chemistry and Physics,” 2008. www.foodsci.uoguelph.ca/dairyedu/icecream.html
- R. Tahvonena, R. M. Hietanena, J. Sihvonena and E. Salminen, “Influence of Different Processing Methods on the Glycemic Index of Potato (Nicola),” Journal of Food Composition and Analysis, Vol. 19, No. 4, 2006, pp. 372- 378. http://dx.doi.org/10.1016/j.jfca.2005.10.008
- S. Christos, L. Dimitra and T. Constantina, “Enrichment of Ice Cream with Dietary Fibre: Effects on Rheological Properties, Ice Crystallisation and Glass Transition Phenomena,” Food Chemistry, Vol. 115, No. 2, 2009, pp. 665-671. http://dx.doi.org/10.1016/j.foodchem.2008.12.070
- S. Adapa, H. Dingeldein, K. A. Schmidt and T. J. Herald, “Rheological Properties of Ice Cream Mixes and Frozen Ice Creams Containing Fat and Fat Replacers,” Journal of Dairy Science, Vol. 83, No. 10, 2000, pp. 2224-2229. http://dx.doi.org/10.3168/jds.S0022-0302(00)75106-X
- S. Adapa, “Mechanisms of Ice Crystallization and Recrystallization in Ice Cream: A Review,” Food Reviews International, Vol. 16, No. 3, 2000, pp. 259-271. http://dx.doi.org/10.1081/FRI-100100289
- S. Adapa, “Rheological Properties of Ice Cream Mixes and Frozen Ice Creams Containing Fat and Fat Replacers,” Journal of Dairy Science, Vol. 83, No. 10, 2000, pp. 2224-2229. http://dx.doi.org/10.3168/jds.S0022-0302(00)75106-X
- M. R. Muse and R. W. Hartel, “Ice Cream Structural Elements That Affect Melting Rate and Hardness,” Journal of Dairy Science, Vol. 87, No. 1, 2004, pp. 1-10. http://dx.doi.org/10.3168/jds.S0022-0302(04)73135-5
- A. M. Iguttia, A. C. Pereira, L. Fabiano, R. A. Silva and E. P. Ribeiro, “Substitution of Ingredients by Green Coconut (Cocos nucifera L) Pulp in Ice Cream Formulation,” Procedia Food Science, Vol. 1, 2011, pp. 1610-1617. http://dx.doi.org/10.1016/j.profoo.2011.09.238
- H. M. Dawes and J. B. Keene, “Phenolic Composition of Kiwifruit Juice,” Journal of Agriculture and Food Chemistry, Vol. 47, No. 6, 1999, pp. 2398-2403.
- A. M. Deters, K. R. Schröder and A. Hensel, “Kiwi Fruit (Actinidia chinensis L.) Polysaccharides Exert Stimulating Effects on Cell Proliferation via Enhanced Growth Factor Receptors, Energy Production, and Collagen Synthesis of Human Keratinocytes, Fibroblasts, and Skin Equivalents,” Journal of Cellular Physiology, Vol. 202, No. 3, 2005, pp. 717-722. http://dx.doi.org/10.1002/jcp.20161
- C. C. Katie and W. H. Kevin, “Consumption of a High Glycemic Index Diet Increases Abdominal Adiposity but Does Not Influence Adipose Tissue Pro-Oxidant and Antioxidant Gene Expression in C57BL/6 Mice,” Nutrition Research, Vol. 30, No. 2, 2010, pp. 141-150. http://dx.doi.org/10.1016/j.nutres.2010.01.003
- C. Barbara, R. D. Olendzki and Ma. Yunsheng, “Methodology for Adding Glycemic Index and Glycemic Load Values to 24-Hour Dietary Recall Database,” Nutrition, Vol. 22, No. 11, 2006, pp. 1087-1095.
- G. E. Dubois and R. A. Stephenson, “Diterpenoid Sweeteners. Synthesis and Sensory Evaluation of Stevioside Analogues with Improved Organoleptic Properties,” Journal of Medicinal Chemistry, Vol. 28, No. 1, 1985, pp. 93- 98. http://dx.doi.org/10.1021/jm00379a017
- S. S. Schiffman, B. J. Booth, B. T. Carr, M. L. Losee, E. A. Sattely-Miller and B. G. Graham, “Investigation of Synergism in Binary Mixtures of Sweeteners,” Brain Research Bulletin, Vol. 38, No. 2, 1995, pp. 105-120. http://dx.doi.org/10.1016/0361-9230(95)00062-J
- H. M. Cardello, M. A. Dasilva and M. H. Damasio, “Measurement of the Relative Sweetness of Stevia Extract, Aspartame and Cyclamate/Saccharin Blends as Compared to Sucrose at Different Concentrations,” Plant Foods for Human Nutrition, Vol. 54, No. 2, 1999, pp. 119-130. http://dx.doi.org/10.1023/A:1008134420339
- S. S. Schiffman, B. J. Booth, B. T. Carr, M. L. Losee, E. A. Sattely-Miller and B. G. Graham, “Bitterness of Sweeteners as a Function of Concentration,” Brain Research Bulletin, Vol. 36, No. 5, 1995, pp. 505-513. http://dx.doi.org/10.1016/0361-9230(94)00225-P
NOTES
*Corresponding author.