Food and Nutrition Sciences
Vol. 3 No. 9 (2012) , Article ID: 22301 , 8 pages DOI:10.4236/fns.2012.39167
Food Sources and Intake of Calcium in a Representative Sample of Spanish Adults
![]()
1Department of Nutrition, Faculty of Pharmacy, Complutense University of Madrid, Madrid, Spain; 2UCM Research Group VALORNUT (920030), Complutense University of Madrid, Madrid, Spain.
Email: *lggonzalezrdz@farm.ucm.es
Received July 12th, 2012; revised August 12th, 2012; accepted August 19th, 2012
Keywords: Calcium; Dairy Products; Inadequate Intake; Food Sources; Spanish Adults
ABSTRACT
The present study aimed to assess calcium intake, dietary sources of this nutrient and its adequacy with respect to the dietary reference intake (DRI) in a representative sample of Spanish adults. In this study 418 adults (18 to 60 years) from 15 Spanish provinces were studied. Energy and nutrient intake were determined using a 24-hour recall questionnaire for two days. Adequacy of calcium intake was assessed using the established DRI for calcium. Anthropometric data (weight and height) were measured and the body mass index was calculated. Seventy eight percent of the participants in the study did not meet the DRI for calcium. Additionally, 33.7% of the participants did not meet the 67% of the DRI. The daily intake of calcium was 916.6 ± 288.1 mg/day, which represented the 81.3% of the DRI of calcium. Interestingly, subjects who had higher intake of calcium were taller. Additionally, it has been observed that individuals with normal body weight (BMI < 25 kg/m2) had higher intakes of dairy products in comparison with overweight and obese individuals (BMI ≥ 25 kg/m2). The main food sources of calcium were dairy products (58.7% of calcium), cereals (13.6%) and vegetables (6.5%). Less than 1% (0.5%) of the calcium intake came from dietary supplements. It was observed that individuals who met the DRI for calcium had a significantly higher intake of dairy products (551.3 ± 240.4 g/day) than individuals who did not meet the DRI of calcium (305.0 ± 150.3 g/day). Calcium intake was inadequate in this sample of the adult Spanish population. Therefore, an increase in the consumption of dairy products, as well as cereals, vegetables and food items fortified with calcium seems to be necessary to achieve an adequate intake of calcium and to prevent diseases caused by calcium deficiency.
1. Introduction
Calcium plays an important role strengthening the bones and preventing bone related diseases such as osteoporosis [1]. An adequate intake of calcium has been associated with the prevention of obesity, hypertension [2-4], type 2 diabetes [2,4,5] and dyslipidemia [2]. Several studies performed in Spain and Europe, have observed that calcium intake was generally below the dietary reference intake (DRI) due principally to a low consumption of dairy products [6-9]. Although dairy foods are valuable from a nutritional standpoint and epidemiologic studies have been suggested that they may have favorable effects on body weight in adults [10], recently tendencies indicate that the dairy consumption is only justified during infancy [10-12]. These tendencies have been led to reduce or avoid the dairy products consumption in some groups of adults, which may negatively affects the intake of different nutrients and particularly the calcium intake [10,12]. There are few studies that have assessed calcium intake in a representative sample of the Spanish population. Therefore, the main aim of the present study was to assess calcium intake and its adequacy with respect to the DRI. In addition, the main dietary sources of calcium were identified.
2. Material and Methods
2.1. Material
A group of 418 adults (196 men and 222 women) with ages ranging from 18 to 60 years were selected as a representative sample of the Spanish adult population as whole. All data were collected from January to September 2009.
The sample size was calculated, taking into account data provided by the Spanish Intersalt study [13], to be representative for each gender, assuming a dropout rate of 25%. The initial sample size required was set at 406 participants. Sampling was performed in fifteen randomly selected provinces (selected with the proviso that the great majority of Spain’s autonomous regions were represented)including the capital city of each province and a semiurban/rural town (randomly chosen). The total number of cities/towns included was 30. The participants on each sampling point were divided into six subgroups, taking into account their gender (male/female) and age (18 - 30, 31 - 44 and 45 - 60 years).
All selected participants were healthy and lived in their own homes; neither hospitalized people nor those living in institutions were included in the present study. Individuals with a diagnosis of diabetes, hypertension or renal disease, or who had been prescribed diuretics, were excluded.
The present study was conducted according to the guidelines laid down in the Declaration of Helsinki and all procedures were approved by the Ethics Committee of the Faculty of Pharmacy (Universidad Complutense de Madrid, Madrid, Spain). Written informed consent was obtained from all subjects.
Participants were randomly selected among the residents of each population and were invited to take part in the study via telephone (or in person in some of the rural areas). In each of the 30 sampling areas, when a participant was excluded at any site, or when participation was declined, another person of the same gender and age group was recruited. A group of 1835 individuals were initially recruited, where only 492 (26.8%) accepted to take part in the study. From these, 74 individuals were excluded. The final study sample size was 418 participants (53.1% women) (22.8% of the originally contacted sample).
2.2. Methods
All participants received the same instructions to complete the questionnaires. All the measurements were carried out by trained personal following the same protocol.
2.2.1. Dietary Information
Food intake was determined using the 24-hour recall method on two consecutive days [14]. Participants were asked to write all foods consumed on the preceding days (where appropriate the brand of these foods were also registered). They indicated the size of the servings consumed (approximate weights or household measures [cups, bowls, plates, etc.]), whether these weights or sizes corresponded to raw or cooked food, with or without bone or skin, etc. In addition, participants completed a questionnaire where they indicated the consumption of dietary supplements and manufactured dietary foods.
The energy and nutrient intake were then calculated using the DIAL software [15], which uses the Food Composition Tables of the Department of Nutrition, Complutense University of Madrid [16]. The participants’ calcium intake was compared with the DRI for calcium [17]. The number of servings of the different food groups consumed by participants was calculated by dividing the grams of the food consumed by the size of the standard serving [16,18], and these were compared with the recommended servings described in the Dietary Guidelines for the Spanish population [19].
The dietary data have been validated considering the discrepancy between each individual energy intake and the estimated energy expenditure. The estimated energy expenditure was determined taking into account the participants’ weight, sex and age (for the calculation of the basal metabolic rate) and the physical activity coefficient. The discrepancy was determined with the following equation:
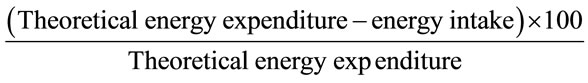
In individuals with stable body weight, energy intake should be similar to the estimated energy expenditure and the gap between these values can be used as an indicator of undervaluation/overvaluation of intake. In some cases, individuals that take part in a nutritional study modify their nutritional intakes. Although the recorded intake is real, the discrepancy in energy intake and expenditure may suggest a departure from the usual intake [20].
Once calcium intake has been established, the food sources of calcium were assessed to identify the most important sources of the mineral. The contribution of each food to total calcium intake has been calculated by adding the amount of calcium provided by each specific food and dividing by the total intake of calcium, all multiplied by 100 [21].
2.2.2. Anthropometric Information
Weight and height were determined using a digital electronic scale (Seca Alpha, GmbH & Company, Igni, France; range 0.1 - 150 kg, precision 100 g) and a Harpenden digital stadiometer (Pfifter, Carlstadt, NJ, USA; range 70 - 205 cm, precision 1 mm). For both measurements, participants were barefoot and wore minimal clothes, in agreement with the norms set up by the World Health Organization (WHO) [22]. Body mass index (BMI) was calculated and used to classify the individuals following the WHO classification (normal weight: BMI < 25 kg/m2, overweight: BMI ≥ 25 kg/m2 and BMI < 30 kg/m2 and obesity: BMI ≥ 30 kg/m2 [22,23].
2.2.3. Physical Activity Study
Participants completed two physical activity questionnaires, describing the time spent on the different daily activities, such as sleeping, eating, walking, resting, exercising, one during the weekdays and other during the weekend [24]. An activity coefficient was established for each participant by multiplying the time spent in each activity by coefficients related with the activity type and dividing the result by 24 (hours) [24,25]. A coefficient of 1 for sleeping and resting, 1.5 for very light activities (activities that can be done sitting or standing), 2.5 for light activities (e.g. walking), 5 for moderate activities (e.g. playing tennis, skiing and dancing) and 7 for intensive activities (e.g. cutting down trees and playing basketball). The weekday coefficient was multiplied by 6, the Sunday coefficient was then added to the weekday result and the total was divided by 7. This provided a final activity coefficient for each participant, which was multiplied by the basal energy expenditure estimated with the WHO formulae [25,26] to provide the estimated daily energy expenditure for each participant.
2.2.4. Statistical Analysis
All data were presented as the mean ± standard deviation. The differences between genders were assessed using Student t-test with quantitative data where the data was normally distributed, using the Mann-Whitney test otherwise. Chi-square test was used to assess the differences between genders in the qualitative variables. Two-way ANOVA test was used to assess the differences within the studied variables using gender and the achievement of the DRI of calcium. Due to the inter-correlation of energy intake with nutrients, an adjustment of the nutrients using the residual method of Willet [27] was performed. The statistical significance was set at P < 0.05. All calculations were made using the statistical software Rsigma Babel (RSIGMA 2.0 BABEL, 1992, Horus Hardware; Madrid, Spain)
3. Results
Table 1 shows the participants’ characteristics. There were no differences in age between gender groups. However, males’ height, weight and BMI were significantly higher compared with the female participants. Interestingly, 48.9% of the study sample presented weight excess (35.3% overweight and 13.6% obesity). Male participants had higher percentages of weight excess problems (overweight: 43.9% and obesity: 16.4%) compared with the female participants (overweight: 25.7% and obesity: 11.3%).


Table 1. Participants’ characteristics.
The mean daily intake of calcium was 916.6 ± 288.1 mg/day), which represented the 81.3% of the DRI for calcium. Seventy-eight percent of the participants did not meet the DRI for calcium, with intakes lower than the 67% of the DRI’s in 33.7% of the participants. Protein intake was 89.4 ± 16.4 g/day, which met in excess the DRI for this nutrient. However, the calcium:protein ratio (10.4 ± 3.2 mg/g) and the calcium:phosphorus ratio (0.62 ± 0.15 mg/mg) did not meet the established optimal values of 20 mg/g for calcium:protein ratio and 1 - 2 mg/mg for calcium:phosphorus ratio in 98.5%, 98.8% of the participants, respectively.
The major source of calcium was provided by dairy products (58.7% of calcium). Other sources of calcium were cereals (13.6% of calcium), vegetables (6.5%), fruits (4%), fish (3.9%), non-alcoholic beverages (2.8%), meat (2.6%), pulses (1.8%), sugars (1.8%) and eggs (1.7%). Interestingly, less than 1% of calcium (0.5%) was provided by dietary supplements (Table 2).
Participants were classified whether they met the DRI for calcium intake or not. Participants who met the DRI for calcium intake and those who did not meet the DRI had mean calcium intakes of 1300.7 ± 231.0 mg/day and 813.5 ± 203.7 mg/day, respectively. The calcium:protein and calcium:phosphorus ratios were also higher in the participants who met the DRI for calcium intake compared to the participants who did not meet the DRI. Interestingly, the study revealed that adults with an adequate intake of calcium were taller than the ones with calcium intakes lower than the DRI (Table 3).
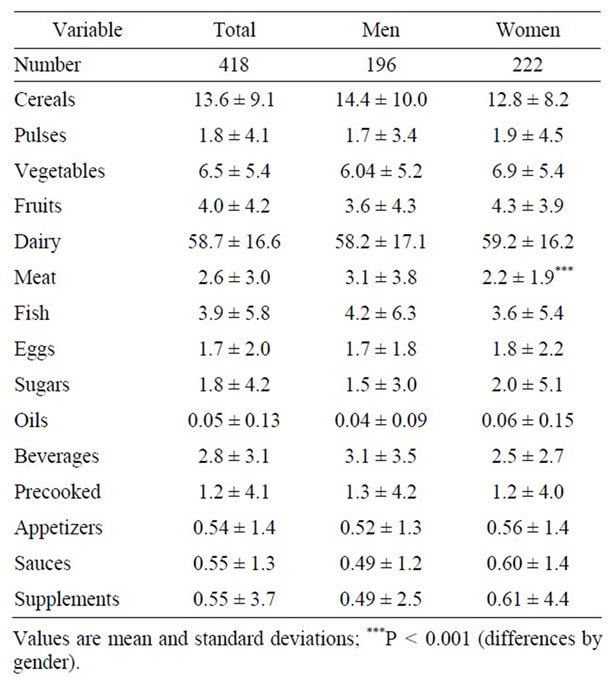
Table 2. Calcium food sources in the study population (%).
There were also differences between the participants who met the DRI for calcium intake and those who did not meet the DRI in relation with the dietary sources of calcium and the intake of other nutrients. Participants who met the DRI for calcium consumed more servings of dairy products (3.9 ± 1.3 servings/day) than participants who did not meet the DRI (2.1 ± 1.1 servings/day). Additionally, participants who met the DRI for calcium intake consumed more fish and less meat and pulses than individuals who did not meet the DRI (Table 4).
4. Discussion
In the present study, mean calcium intake of the participants was below the DRI in 70% of the males and 86% of females. Calcium intake (917 ± 288 mg/day) was similar to those observed in the Spanish Encat study in 2002 [28] (830 ± 200 mg/day in males and 778 ± 170 mg/day in females). Additionally, other studies in Europe, such that performed by Vriese, et al. [29] in Belgian adults or the study carried out by Hulshof, et al. [30] in Dutch young adults had similar calcium intakes.
Calcium uptake is affected by the intake or the bioavailability of other nutrients such as phosphorus and protein. In any growth situation or to prevent disease, both calcium and phosphorus are needed to support an optimal increase in bone mass.
Lower calcium:phosphorus ratios are associated with reductions in the bioavailability of calcium [31].
However, an excess intake of calcium in relation with phosphorus (1.6 - 1.8) may reduce the absorption of calcium and other minerals (magnesium, manganese, zinc), resulting in reduced bone mineral densities [32]. The calcium:phosphorus ratio should be 1:1 [33].
The present study indicated that 98.8% of the sample had a calcium:phosphorus ratio lower than this value. Low calcium:phosphorus ratios may interfere with calcium metabolism, decreasing the absorption of calcium [34]. A study carried out by Teegarden, et al. [35] showed that higher intake of calcium (1200 - 1400 mg), resulting in calcium:phosphorus ratios of 1.2 to 1.4, could increase bone mineral density and reduced the risk of bone fractures later in life.
Therefore, an increase of calcium intake combined with phosphorus intakes of 900 - 1000 mg would provide the adequate protection against bone disease maintaining an optimal bone metabolism in adult individuals.
The high intake of proteins has been associated with urinary calcium losses, affecting calcium absorption and possibly bone mineral content and density [35]. However, protein intakes below the DRI can be detrimental for bone formation and its conservation through adult life.
Several studies have associated high protein intakes with increased bone mineral content and density and reductions of hip fractures incidence [35,36].
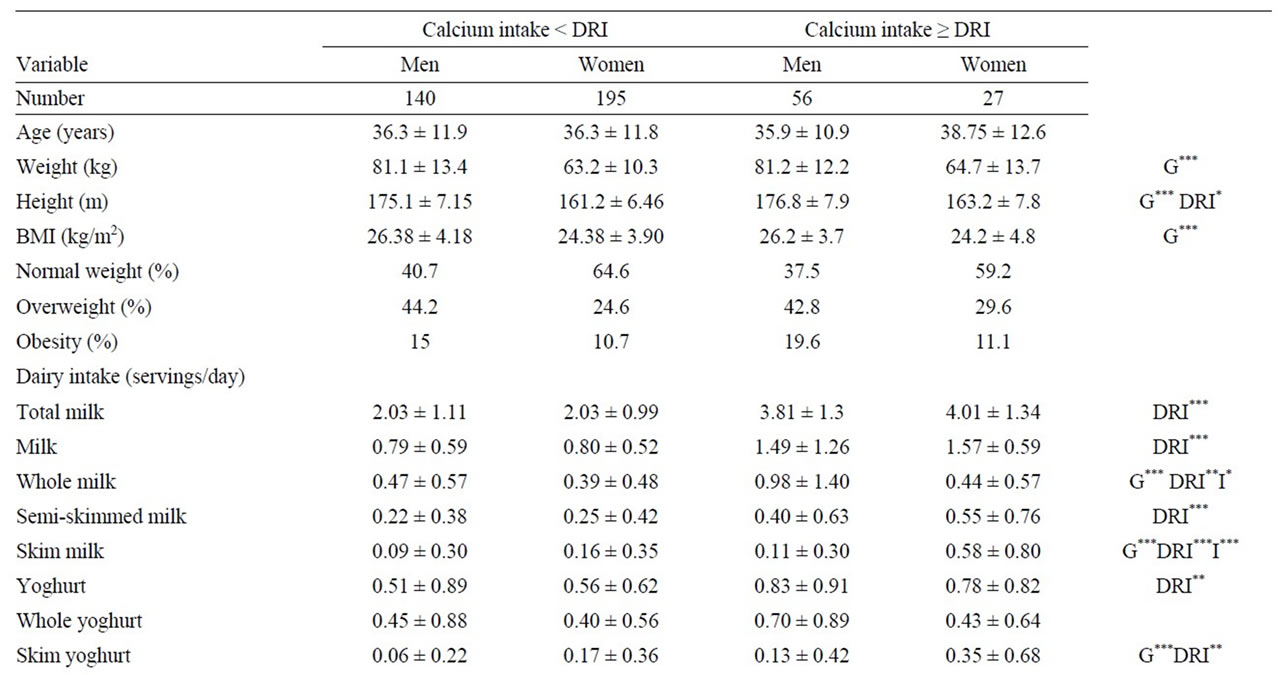
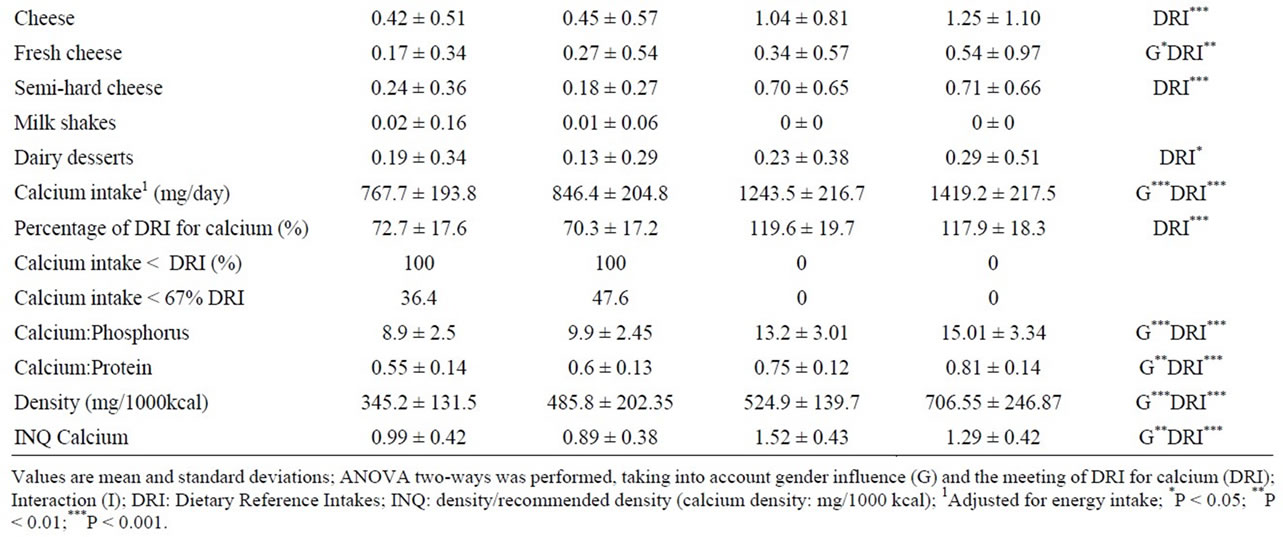
Table 3. Dietary and anthropometric differences between adults who did not meet the dietary references intakes for calcium (<DRI) and those who met (≥DRI).
The present study indicated that the 98.5% of the sample had a calcium:protein ratio lower than 20 mg/g (10.4 ± 3.2 mg/g) [36], which reveals again a low intake of calcium associated with a high intake of proteins, which may have an adverse effect on the utilization of calcium and maintenance of bone mass.
Interestingly, subjects who had higher intake of calcium were taller (Table 3). Although there are other variables influencing the anthropometry of humans, calcium intake and the intake of dairy products have been associated with higher bone mineral densities and content, and taller individuals [34,37,38].
Additionally, it has been observed that individuals with normal body weight (BMI < 25 kg/m2) had higher intakes of dairy products when compared with overweight and obese individuals (BMI ≥ 25 kg/m2). This may be caused by the restriction of dairy products consumption in overweight and obese individuals. However, some studies have observed that dairy product intake did not have a negative effect on body weight [39], and even helped overweight individuals to maintain a stable body weight and an adequate calcium intake [4].
The main sources of dietary calcium are dairy products, which was similar to other studies [8,40] noting the importance of calcium from dairy products in bone mineralization, which is why the contribution must be adequate.
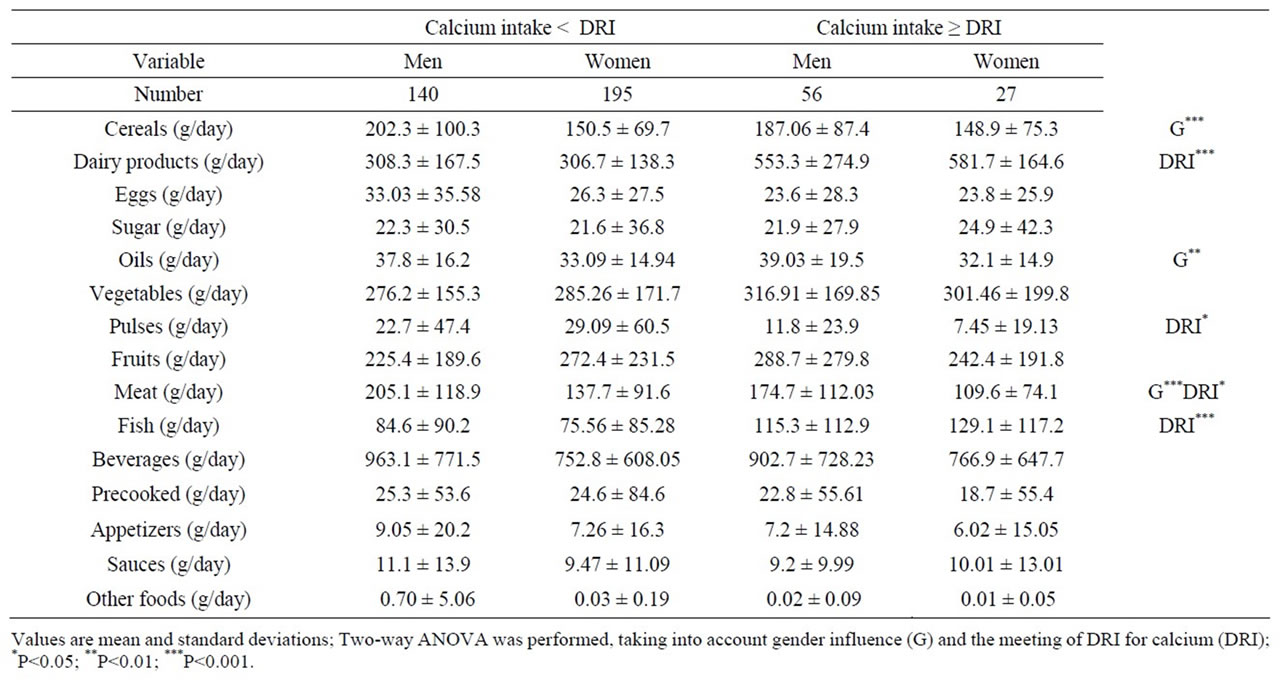
Table 4. Food consumption differences between adults who did not meet the dietary references intakes for calcium (<DRI) and those who met (≥DRI).
The intake of calcium is important to maintain an adequate bone mineral composition. The low intakes of calcium observed in the present study could be associated with low intakes of dairy products (below the recommended 2 - 3 servings/day in 42.3% of the sample), as these provided almost 60% (58.7%) of the calcium within the diet (Table 2). It was observed that individuals who met the DRI for calcium had a significantly higher consumption of dairy products (551.3 ± 240.4 g/day) than individuals who did not meet the DRI of calcium (305.0 ± 150.3 g/day). In conclusion, calcium intake was inadequate in this sample of the adult Spanish population. Therefore, an increase in the consumption of dairy products, as well as cereals, vegetables and food items fortified with calcium seems to be necessary to achieve an adequate intake of calcium and to prevent diseases caused by calcium deficiency.
5. Acknowledgements
This study was supported by the AESAN (Spanish Agency for Food and Nutritional Safety, Spanish Ministry of Health and Consumer Affairs) (project: 337/2008) and by the “Creation and Consolidation of Research Groups of the UCM Program” (Reference: GR58/08; Code: 4120787).
REFERENCES
- J. M. Quesada, M. Sosa, “Nutrition and Osteoporosis, Calcium and Vitamin D,” Revista de Osteoporosis y Metabolismo Mineral, Vol. 3, No. 4, 2011, pp. 165-182.
- P. Garcia-Lorda, J. Salas-Salvador and J. M. Cobo, “Role of Calcium in Obesity,” Medicina Clinica (Barc), Vol. 124, No. 2, 2005, pp. 467-475.
- P. Moreira, C. Padez, I. Mourão and V. Rosado, “Dietary Calcium and Body Mass Index in Portuguese Children,” European Journal of Clinical Nutrition, Vol. 59, No. 7, 2005, pp. 861-867. doi:10.1038/sj.ejcn.1602147
- R. M. Ortega and A. Aparicio, “Importance of Dairy Products and Calcium in the Control of Obesity,” In: Instituto Tomás Pascual Sanz para la Nutrición y la Salud, Colegio Oficial de Farmacéuticos de Madrid y Real Academia Nacional de Farmacia, Ed., Recommendations on Nutrition and Healthy Lifestyles from the Pharmacy, IM&C, Madrid, 2010, pp. 45-72.
- L. A. Martini, A. S. Catania and S. Ferreira, “Role of Vitamins and Minerals in Prevention and Management of Type 2 Diabetes Mellitus,” Nutrition Reviews, Vol. 68, No. 6, 2010, pp. 341-354. doi:10.1111/j.1753-4887.2010.00296.x
- P. Orozco-López, M. Zwart-Salmerón, E. Vilert-Garrofa and C. Olmos-Domínguez, “Prediction of the Total Calcium Intake from Consumption of Milk Products in Spain Adult Population. INDICAD Study 2001,” Aten Primaria, Vol. 33, No. 5, 2004, pp. 237-243.
- O. Bruyere, C. De Cock, C. Mottet, A. Neuprez, O. Malaise and J. Y. Reginster, “Low Dietary Calcium in European Postmenopausal Osteoporotic Women,” Public Health Nutrition, Vol. 12, No. 1, 2009, pp. 111-114. doi:10.1017/S1368980008002024
- J. M. Quesada, J. M. Mata, J. Delgado and R. Ramirez, “Low Calcium Intake and Insufficient Serum Vitamin D Status in Treated and Non-Treated Postmenopausal Osteoporotic Women in Spain,” Journal of Bone and Mineral Metabolism, Vol. 22, 2007, p. S309.
- N. Ubeda, M. Basagoiti, E. Alonso-Aperte and G. VarelaMoreiras, “Dietary Food Habits, Nutritional Status and Lifestyle in Menopausal Women in Spain,” Nutrición Hospitalaria, Vol. 22, No. 3, 2007, pp. 313-321.
- T. A. Nicklas, “Calcium Intake Trends and Health Consequences from Childhood through Adulthood,” Journal of American College of Nutrition, Vol. 22. No. 5, 2003, pp. 340-356.
- C. S. Berkey, H. R. Rockett, W. C. Willett and G. A. Colditz, “Milk, Dairy Fat, Dietary Calcium, and Weight Gain: A Longitudinal Study of Adolescents,” Archives of Pediatrics & Adolescent Medicine, Vol. 159, No. X, 2005, pp. 543-550. doi:10.1001/archpedi.159.6.543
- R. M. Ortega, L. G. González-Rodríguez, A. I. Jiménez Ortega, J. M. Perea-Sánchez and L. M. Bermejo-López, “Diet, Calcium and Other Nutrients Adequacy: Differences by Consumption of Dairy Products in Spanish Schoolchildren,” Nutrición Clínica y dietética hospitalaria, Vol. 32, No. 2, 2012, pp. 28-36.
- Intersalt Cooperative Research Group, “Intersalt: An International Study of Electrolyte Excretion and Blood Pressure Results for 24 Hour Urinary Sodium and Potassium Excretion,” British Medical Journal, Vol. 297, No. 6644, 1988, pp. 319-328. doi:10.1136/bmj.297.6644.319
- R. M. Ortega, A. M. Requejo and A. M. López-Sobaler, “Models of Questionnaires for Dietary Studies, in the Assessment of Nutritional Status,” In: R. M. Ortega and A. M. Requejo, Eds., Nutriguía. Manual of Clinical Nutrition in Primary Care, Complutense, Madrid, 2006, pp. 456-467.
- R. M. Ortega, A. M. López-Sobaler, P. Andrés, A. M. Requejo and A. Aparicio, “DIAL Software for Assessing Diets and Food Calculations,” 2012. http://www.alceingenieria.net/nutricion.htm
- R. M. Ortega, A. M. López-Sobaler, A. M. Requejo and P. Andrés, “Food Composition Tables,” In: R. M. Ortega, A. M. López-Sobaler, A. M. Requejo and P. Andrés, Eds., Food Composition Tables. A Basic Tool for Assessing Nutritional Status, Complutense, Madrid, 2010, pp. 16- 81.
- R. M. Ortega, A. M. Requejo, B. Navia and A. M. LópezSobaler, “Recommended Energy and Nutrient Intakes for the Spanish Population,” In: R. M. Ortega, A. M. LópezSobaler, A. M. Requejo and P. Andrés, Eds., The Composition of Foods. Basic Tool for Nutritional Assessment, Complutense, Madrid, 2010, pp. 82-85.
- J. M. Perea, A. Navarro and M. C. Lozano, “Tables of Weight of Standard Food Rations,” In: A. M. Requejo and R. M. Ortega, Eds., Nutriguía. Manual of Clinical Nutrition in Primary Care, Complutense, Madrid, 2006, pp. 469-467.
- A. M. Requejo and R. M. Ortega, “Dietary Guidelines,” In: A. M. Requejo and R. M. Ortega, Eds., Nutriguia. Manual of Clinical Nutrition in Primary Care, Complutense, Madrid, 2003, pp. 15-26.
- R. M. Ortega, M. E. Quintas and M. B. Sánchez-Quiles, “Undervaluation of Energy Intake in a Group of Young University of Madrid,” Revista Clínica Española, Vol. 197, 1997, pp. 545-549.
- S. M. Krebs-Smith, P. S. Kott and P. M. Guenther, “Mean Proportion and Population Proportion: Two Answers to the Same Question,” Journal of American Dietetic Association, Vol. 89, No. 5, 1989, pp. 671-676.
- World Health Organization (WHO), “Expert Committee on Physical Status. Physical Status: The Use and Interpretation of Anthropometry,” Geneva, WHO, 1995.
- J. Salas-Salvadó, M. A. Blond, M. Barbany and B. Moreno, “Consensus SEEDO 2007 for Evaluation of Overweight and Obesity and the Establishment of Criteria for Therapeutic Intervention,” Medicina Clinica (Barc), Vol. 128, No. 5, 2007, pp. 184-196.
- R. M. Ortega, A. M. Requejo and A. M. López-Sobaler, “Activity Questionnaire,” In: R. M. Ortega and A. M. Requejo, Eds., Nutriguia. Manual of Clinical Nutrition in Primary Care, Complutense, Madrid, 2006, p. 468.
- World Health Organization (WHO), “Energy and Protein Requirements. Report of a Joint UN/WHO/FAO Expert Consultation. Technical Report Series 724,” Geneva, WHO, 1985.
- R. M. Ortega, A. M. Requejo, M. E. Quintas, B. SánchezQuiles, A. M. López-Sobaler and P. Andrés, “Estimated Energy Balance in Female University Students: Differences with Respect to Body Mass Index and Concern about Body Weight,” International Journal of Obesity, Vol. 208, No. 12, 1996, pp. 1127-1129.
- W. Willett and M. J. Stampfer, “Total Energy Intake: Implications for Epidemiologic Analyses,” American Journal of Epidemiology, Vol. 124, No. 1, 1986, pp. 17- 27. doi:10.1093/acprof:oso/9780195122978.003.11
- L. Serra-Majem, L. Ribas-Barba, G. Salvador-Castell, C. Castell-Abat, B. Román-Vinas, J. Serra-Farró, et al., “Assessment of Nutritional Status of the Catalan Population 2002-2003. Evolution of Dietary Habits and Consumption of Food and Nutrients in Catalonia (1992- 2003),” 2012. http://www.gencat.net/salut/depsalut/pdf/encat2003semi.pdf
- S. Vandevijvere, S. De Vriese, I. Huybrechts, M. Moreau and H. Van Oyen, “Overall and Within-Food Group Diversity are Associated with Dietary Quality in Belgium,” Public Health Nutrition, Vol. 13, No. 12, 2010, pp. 1965- 1973. doi:10.1017/S1368980010001606
- K. F. A. M. Hulshof, M. C. Ocké, C. T. M. van Rossum, E. J. M. Buurma-Rethans, J. Brants, J. J. M. M. Drijvers, et al., “Results of National Survey of Food Consumption 2003,” 2012. http://www.rivm.nl/bibliotheek/rapporten/350030002.pdf
- B. Basabe, M. C. Mena, M. Faci, A. Aparicio, A. M. López-Sobaler and R. M. Ortega, “Influence of Intake of Calcium and Phosphorus on Bone Mineral Density in Young Women,” Archivos Latinoamericanos de Nutrición, Vol. 54, No. 2, 2004, pp. 203-208.
- M. E. Quintas, “Osteoporosis,” In: A. M. Requejo and R. M. Ortega, Eds., Nutriguia. Manual of Clinical Nutrition in Primary Care, Complutense, Madrid, 2003, pp. 169- 176.
- Department of Nutrition, “Nutritional Objectives for Spanish Population,” In: R. M. Ortega, A. M. López-Sobaler, R. M. Requejo and P. Andrés, Eds., Food Composition. A Basic Tool for Assessing Nutritional Status, Complutense, Madrid, 2010, p. 86.
- V. E. Kemi, M. U. Kärkkäinen, H. J. Rita, M. M. Laaksonen, T. A Outila and C. J. Lamberg-Allardt, “Low Calcium: Phosphorus Ratio in Habitual Diets Affects Serum Parathyroid Hormone Concentration and Calcium Metabolism in Healthy Women with Adequate Calcium Intake,” British Journal of Nutrition, Vol. 103, No. 4, 2009, pp. 561-568. doi:10.1017/S0007114509992121
- D. Teegarden, R. M. Lyle, G. P. McCabe, L. D. McCabe, W. R. Proulx, K. Michon, et al., “Dietary Calcium, Protein, and Phosphorus Are Related to Bone Mineral Density and Content in Young Women,” American Journal of Clinical Nutrition, Vol. 68, No. 3, 1998, pp. 749-754.
- E. Rodríguez-Rodríguez, B. Navia, A. M. López-Sobaler and R. M. Ortega, “Review and Future Perspectives on Recommended Calcium Intake,” Nutrición Hospitalaria, Vol. 25, No. 3, 2010, pp. 366-374.
- C. S. Berkey, G. A. Colditz, H. R. Rockett, A. L. Frazier and W. C. Willett, “Dairy Consumption and Female Height Growth: Prospective Cohort Study,” Cancer Epidemiology, Biomarkers & Prevention, Vol. 18, No. 6, 2009, pp. 1881-1887. doi:10.1158/1055-9965.EPI-08-1163
- C. Hoppe, C. Mølgaard and K. F. Michaelsen, “Cow’s Milk and Linear Growth in Industrialized and Developing Countries,” Annual Review of Nutrition, Vol. 26, No. 1, 2006, pp. 131-173. doi:10.1146/annurev.nutr.26.010506.103757
- C. A. Venti, P. A. Tataranni and A. D. Salbe, “Lack of Relationship between Calcium Intake and Body Size in an Obesity-Prone Population,” Journal of American Dietetic Association, Vol. 105, No. 9, 2005, pp. 1401-1407. doi:10.1016/j.jada.2005.06.004
- P. Peris, “Consumption of Calcium and Use of Supplements of Calcium and Vitamin D in Postmenopausal Women,” Medicina Clinica (Barc), Vol. 113, No. 11, 1999, p. 36.
NOTES
*Corresponding author.