Food and Nutrition Sciences
Vol. 2 No. 5 (2011) , Article ID: 5795 , 6 pages DOI:10.4236/fns.2011.25065
Tartrazine Exposure Assessment by Using Food Frequency Method in North Jakarta, Indonesia
![]()
1Directorate of Food Standardization, National Agency for Drug and Food Control, Jakarta, Indonesia; 2Department of Food Science and Technology, Faculty of Agricultural Technology, Bogor Agricultural University, Bogor, Indonesia; 3Southeast Asian Food and Agricultural Science and Technology Center (SEAFAST Center), Bogor Agricultural University, Bogor, Indonesia.
Email: *nuri@seafast.org
Received April 9th, 2011; revised May 11th, 2011; accepted May 18th, 2011.
Keywords: Tartrazine, Exposure Assessment, Food Frequency Method
ABSTRACT
Stipulating maximum level of food additives in food should be conducted to anticipate excessive usage, guarantee food safety, and as reference in food inspection. However, to support adequate stipulating, information about food additives exposure assessment must available. In fact, this information is stills very few in Indonesia. Tartrazine is one of food additives that most frequently used in food product. The objective of this research was to conduct the exposure assessment of tartrazine from food products which have enlisted in National Agency for Drug and Food Control (NADFC) of Indonesia by using food frequency method with respondent from North Jakarta. The steps of research were survey preparation, food consumption survey from 150 respondents representing groups of children, adolescents and adults, data processing, and data analysis. The result showed that mean value of food consumption containing tartrazine by all respondents was 306.38 g/person/day. The highest mean of consumption in total population groups was by children due to higher food consumption frequency and portion. The five highest food containing tartrazine which were consumed by all respondents were instant noodles, powdered drink, non-carbonated drink, carbonated drink and biscuits. All exposure assessment in this research did not exceed the Acceptable Daily Intake (ADI) for tartrazine. The mean value of exposure by all respondents was 231.24 μg/kg BW (3.08% ADI). The highest mean value of exposure in total population groups was by children due to their higher food consumption and lower body weight. The major contributing foods to tartrazine exposure were instant noodles, non-carbonated drink, powdered drink, biscuits, and snacks. Instant noodles had the highest mean value of consumption and tartrazine exposure for all respondents in North Jakarta. Respondent which had the highest mean value of consumption and tartrazine exposure was by children. Snacks were relative low consumed but high tartrazine exposure.
1. Introduction
According to National Agency for Drugs and Food Control (NADFC) of Indonesia in period 2001-2006, three types of additives most frequently used in food products were citric acid, tartrazine and monosodium glutamate (MSG). CAC classified citric acid as acidity regulator, antioxidant, and sequestrant, tartrazine as coloring, and MSG as flavor enhancer [1]. Citric acid and MSG were relatively safe to be used in food products because the Acceptable Daily Intake (ADI) value of citric acid is not declared and MSG has quite large of ADI value, as well as sufficiently used in food products according to good manufacuring practices (GMP) [2,3]. Tartrazine is synthetic coloring which commonly is used in food products.
The maximum limit of tartrazine used in food products is regulated in Regulation of Minister of Republic of Indonesia No. 722/Menkes/Per/IX/88 on Food Additives and Codex Alimentarius has declared the provision of its uses [4].
The widespread of food additives used in food products gives consequences to the government to conduct regulation to guarantee food safety. To make standard for maximum limit of food additives in food, the implementation of risk analysis principles must be done, i.e. risk assessment, risk management and risk communication. The risk assessment of food additives is a result of selected risk management to ensure that food additives intake from all sources shall not exceed the ADI. Risk assessment was conducted in several steps, i.e. hazard identification and characterization, exposure assessment and risk characterization. The first step of risk assessment, hazard identification and characterization, is ADI development step. The next step, exposure assessment, is step to combine consumption data and level of food additives used to estimate the exposure level. This exposure level then compared with ADI to characterize the risk. Survey of food consumption frequency is one of the methods to conduct food consumption in individual level for certain period. Since the data on food additives exposure in Indonesia was lacking, this study could be used as a model to assess food additives exposure.
The objective of this research was to identify the exposure level of tartrazine from food products which have enlisted in NADFC by using food consumption frequency survey. Respondents was from North Jakarta and divided into three group of age; children, adolescents and adults. Furthermore, from this research, it could be identified which predominant age group exposed to tartrazine and which type of food products that provide the highest tartrazine exposure. Benefits expected from this research were the results could be used as consideration by all stakeholders in reviewing the standard of tartrazine in food product in Indonesia.
2. Materials and Methods
2.1. Materials
Data of tartrazine exposure was obtained by survey of food consumption frequency in 6 districts of North Jakarta: Kelapa Gading, Cilincing, Koja, Pademangan, Penjaringan and Tanjung Priok. Tartrazine content in each brand food product was obtained from premarket evaluation by National Agency of Drug and Food Control (NADFC), Indonesia. Since instant noodle was consumed after cooked/processed, tartrazine content in instant noodle after cooked/processed was analyzed. Sampling of instant noodle was simultaneously done in supermarket in Jakarta. Test of tartrazine level in cooked instant noodle was conducted in an accredited laboratory of PT Saraswanti Indo Genetech, Bogor, Indonesia.
2.2. Methods
2.2.1. Determination of Food Type and Respondents
Types of food enlisted in questionnaire were food containing tartrazine which had been registered in NADFC during the period of 2001 to 2006. In general population was classified into three groups based on respondent age: less than 12 years old is children group, 13 to 18 years old is adolescents group, and over 19 years old is adult group.
Determination of respondent number was done by estimation of population proportion with confidence level 95% and estimation galate 14%. It was calculated by using formula as follow:

where n was sample number, E was error of estimation, p was population proportion with value of 0.5 if it was not known,  , α was reliability level,
  . According to that calculation, it was then determined respondent who represent age group of children, adolescents and adults. Each group had 50 respondents.
2.2.2. Determination of Survey Location
Sampling method was stratified random sampling and purposive sampling. Stratified random sampling method was used to determine samples in each district located in North Jakarta; meanwhile purposive sampling was used to determine samples in each sub district. Survey was conducted in six district located in North Jakarta: Kelapa Gading, Cilincing, Koja, Pademangan, Penjaringan and Tanjung Priok.
2.2.3. Survey of Food Consumption Frequency
Survey was conducted by well-trained enumerator. The 150 respondents came from six districts located in North Jakarta and represent the age group of children, adolescents and adults.
2.2.4. Data Processing
Data from survey was processed by Microsoft Office Excel program. Variables of data input were consumption frequency per day, portion size in kilogram, food consumption per day per person, respondent body weight in kilogram, food consumption per day per kilogram of body weight, tartrazine level in each food type obtained from NADFC except instant noodle which obtained by laboratory test, and tartrazine exposure. Tartrazine exposure was calculated by multiplying the food additives level in food product with food consumption value per day per kilogram of body weight.
The initial data was then tabulated based on food consumption level and tartrazine exposure level on each group of age from total respondents and eater only. Level of food consumption was amount of food consumption per day per person with g/person/day unit. Level of tartrazine exposure was expressed in μg/kg BW/day unit and also in percentage regarding to ADI. The ADI of tartrazine that used to calculate the percentage of exposure value was the highest ADI value of tartrazine, 7.5 mg/kg BW.
2.2.5. Data Analysis
Data analysis was conducted to data that obtained from data processing. Types of analysis were: 1) profile of respondents, 2) level of total food consumption and per-consumer only (eater only) in general, as well as on each age group of respondents, 3) level of tartrazine in food product, and 4) total exposure of tartrazine and eater only in general, as well as on each age group of respondents.
3. Results and Discussion
3.1. Profile of Respondents
The respondent composition between male and female was 51% appeal 49% respectively. Mean-while respondent composition regarding age group of children, adolescents and adults had steady proportion, 33.3%. From 50 adult respondents, 29 respondents (58%) were young adult group (19 - 29 years old). About 27.3% and 22.7% of respondents had body weight with range 41 - 50 kg and 51 - 60 kg respectively (Figure 1). Majority member in 41 - 50 kg weight group was adolescent respondents (72%). In other hand, most of respondents with weight 51 - 60 kg were adult respondents (66%). There were three major respondent’s education level; primary (32.7%), junior (16.7%) and senior high school (28%) (Figure 2). Based on employment level, about 58.7% of respondents were student. Regarding to respondent’s food expenditure level per month, about 47% of respondents spend 100 thousand to 500 thousand rupiahs and 41% spend less than 100 thousand rupiahs.
3.2. Level of Certain Food Consumption Containing Tartrazine
Result of food consumption survey in North Jakarta using food frequency method indicated that total value of mean consumption on all respondents were 306.38 g/ person/day, children respondents were 372.25 g/person/day, adolescent respondents were 362.83 g/person/day, and adult respondents were 184.10 g/person/day, as shown in

Figure 1. Respondent composition based on body weight.
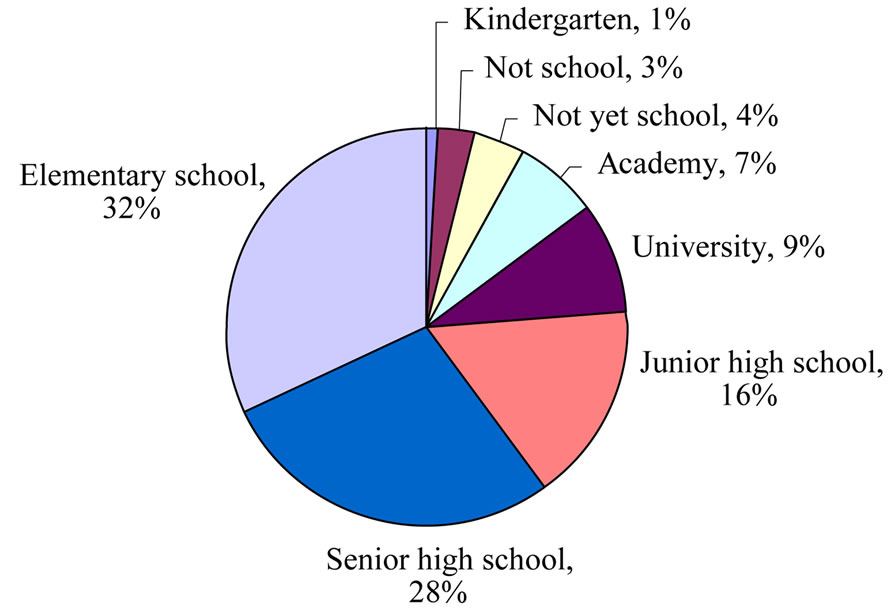
Figure 2. Respondent composition based on education level.
Table 1. The highest total value of mean consumption was children respondents because the consumption frequency and its portion size were relatively bigger.
There were five types of food containing tartrazine which had the highest value of mean consumption on all respondents: instant noodle, powdered drink, noncarbonated drink, carbonated drink and biscuit. Instant noodle was food product containing tartrazine which had the highest total value of mean consumption on all respondents (149.61 g/person/day) and value of mean consumption per eater only (155.84 g/person/day). The consumer of instant noodle was the major consumer of food products containing tartrazine from all respondents. About 144 respondents of 150 respondents (96%) had mean consumption frequency of instant noodle four times in a week (data was not shown).
3.3. Level of Tartrazine in Food Products
Table 2 shows data of tartrazine level in food products which was consumed by respondents. Tartrazine level in instant noodle was difference between on premarket evaluation and after processing either by boiling or frying. There were several products that contained tartrazine more than maximum limit of national and international, i.e. ice cream, fermented milk, jam and jelly.
3.4. Level of Tartrazine Exposure
All value of tartrazine level in this research had not exceeded ADI value of tartrazine as shown on Table 3. The total level of mean tartrazine exposure in all respondents was 231.24 µg/kg BW (3.08% ADI), children respondents was 443.12 µg/kg BW (5.90% ADI), adolescent respondents was 175.29 µg/kg BW (2.33% ADI), and adult respondents was 75.31 µg/kg BW (1.00% ADI). The highest total level of mean tartrazine exposure was children respondents because their consumption level was relatively higher; meanwhile their
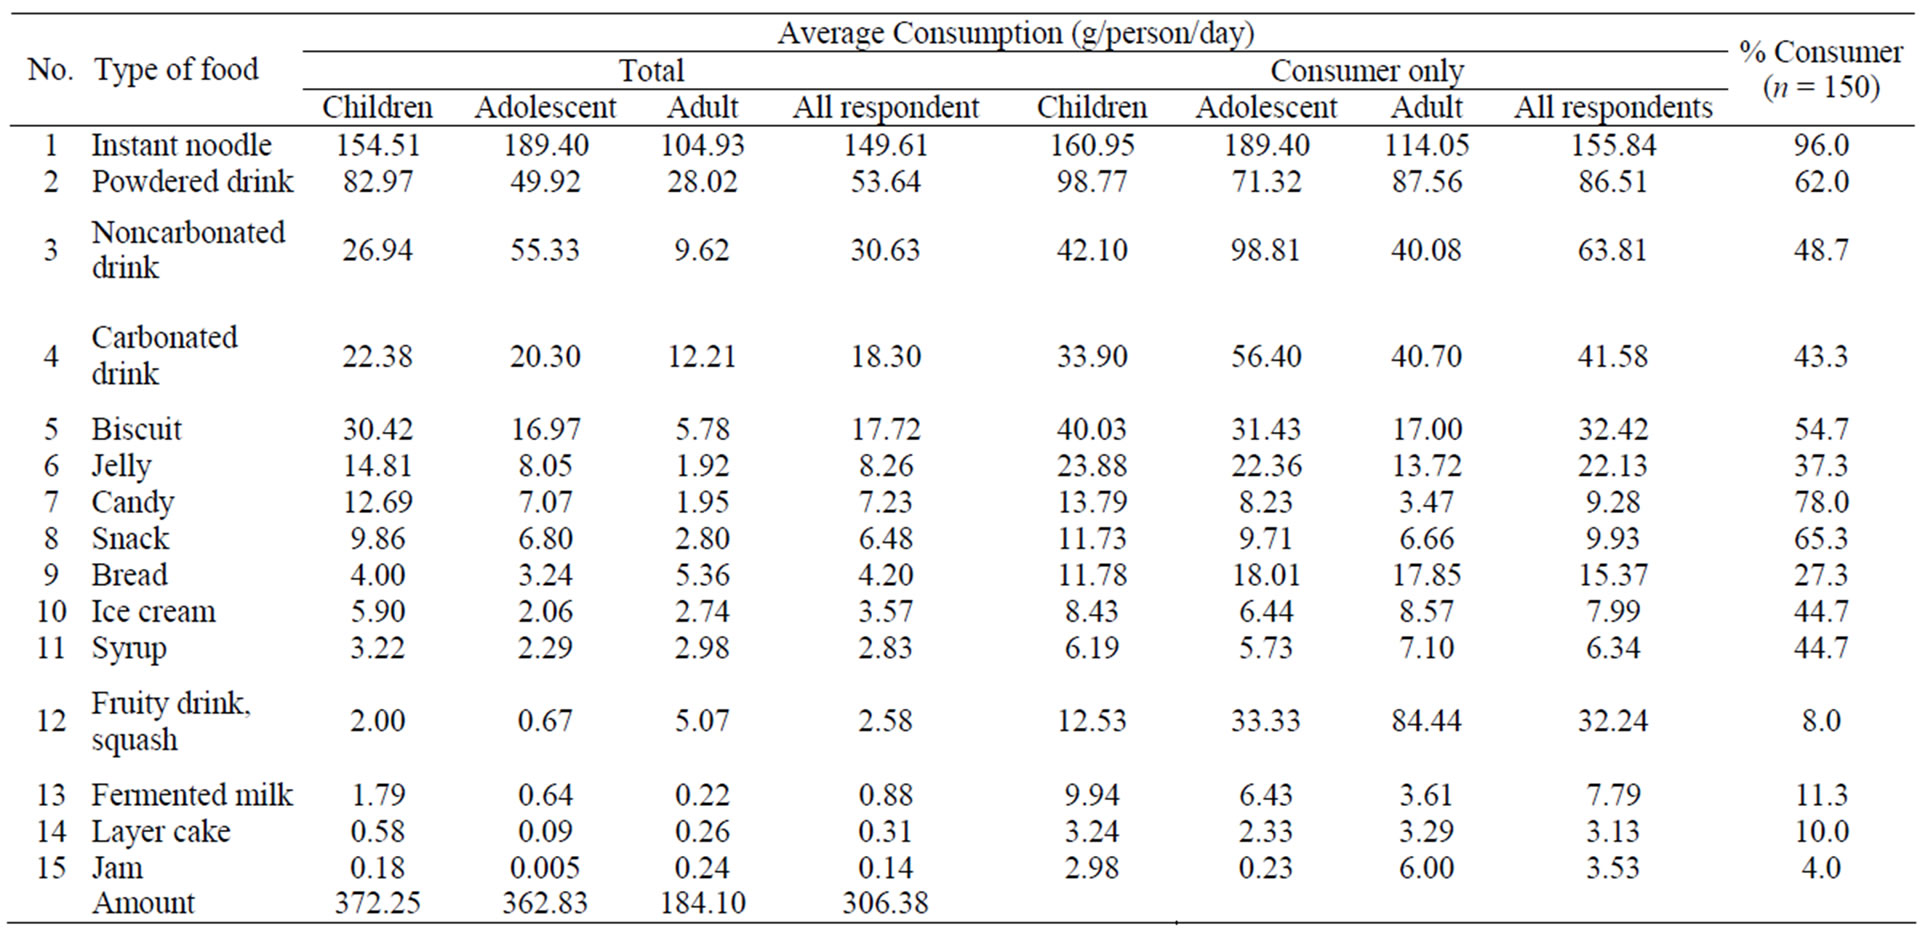
Table 1. Mean consumption of food products containing tartrazine.

Table 2. Level of tartrazine in food products consumed by respondents and compared with tartrazine level established in regulation.
body weight was relatively lower. Products that potentially gave the highest tartrazine exposure to all respondents were instant noodle, noncarbonated drink, powdered drink, snacks and biscuit. Instant noodle potentially gave total value of mean tartrazine exposure as much 75.93 µg/kg BW (1.01% ADI) and eater only as much 79.09 µg/kg BW (1.05% ADI). Based on result of food consumption survey, it indicated that instant noodle was food type which had the highest consumption level and potentially gave the highest tartrazine exposure to all respondents group North Jakarta.
There were several types of food which had relatively low consumption but had high exposure value and vice versa. For example on all respondents data, snacks had total value of mean consumption 6.48 g/person/day which was lower than carbonated drink (18.30 g/person/day) (Table 1); however snacks had total value of mean exposure 19.96 µg/kg BW (0.266% ADI) which was bigger than carbonated drink (8.30 µg/kg BW or 0.11% ADI) (Table 3). It occurred because snacks had mean tartrazine level 88.57 mg/kg which was bigger than carbonated drink (13.00 mg/kg)
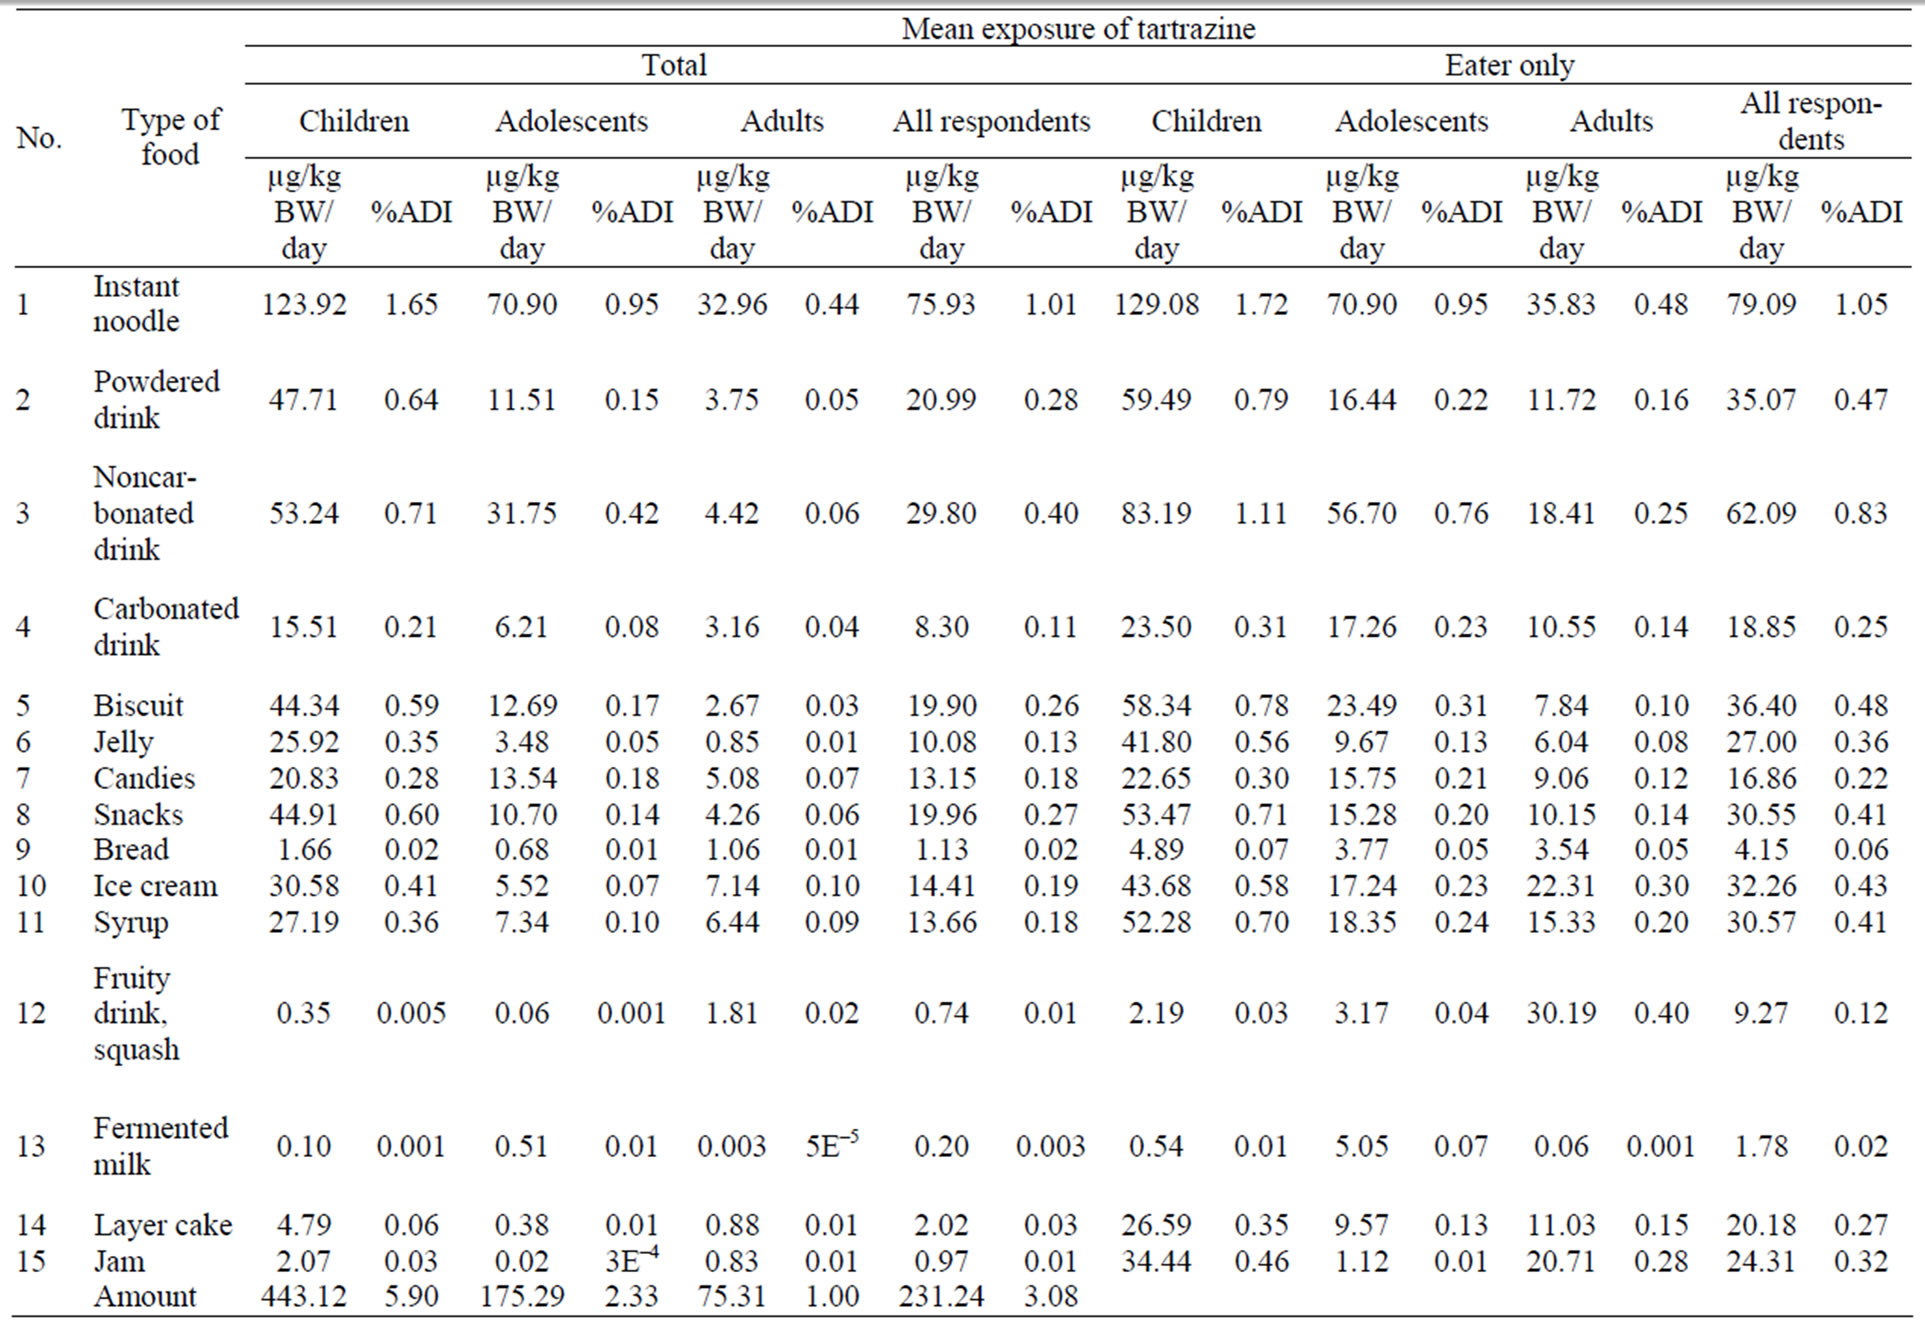
Table 3. Mean exposure of tartrazine on each respondent.
(Table 2). Conclusively, the exposure level of tartrazine does not only depend on the consumption value of food containing tartrazine, but it was also determined by tartrazine level in such food product.
4. Conclusions
Survey of food consumption consisted of food products containing tartrazine which enlisted in NADFC. Average consumption value of food products containing tartrazine on all respondents in North Jakarta was 306.38 g/person/day, the highest total average consumption value was children respondent.
All exposure value of tartrazine had not exceeded ADI value of tartrazine. Total mean exposure level on all respondents was 231.24 µg/kg BW (3.08% ADI); the highest total mean exposure value was children respondent. Types of food which have potential to give highest tartrazine exposure on all respondents were instant noodle, noncarbonated drink, powdered drink, snacks and biscuits.
An instant noodle was a food product that had highest consumption level and potentially gave biggest exposure of tartrazine to all respondents and each group of respondents in North Jakarta. Children group was the respondents who had higher levels of consumption and the highest level of tartrazine exposure in North Jakarta. There were foods that had relatively small of consumption value but had a relatively large exposure value such as snack foods. It indicated that the exposure level of tartrazine not only depends on food containing tartrazine consumption frequency but also because of tartrazine level in food.
REFERENCES
- Codex Alimentarius Commission (CAC), “Class Names and the International Numbering System for Food Additives, CAC/GL 36-1989, Rev. 6-2001,” CAC, Rome, 1989a.
- Departemen Kesehatan RI (Depkes), “Peraturan Menteri Kesehatan Republik Indonesia Nomor 722/Menkes/ Per/IX/88 tentang Bahan Tambahan Makanan,” Depkes RI, Jakarta, 1988. (Ministry of the Department of Health Regulation on Food Additives, in Indonesia Language)
- Codex Alimentarius Commission (CAC), “General Standard for Food Additives, Codex Stan 192-1995 (Rev. 6- 2005),” CAC, Rome, 2005.
- Codex Alimentarius Commission (CAC), “General Standard for Food Additives Online”, 2010. http://www.codexalimentarius.net/gsfaonline/additives/details.html?id=86
- Codex Alimentarius Commission (CAC), “Guidelines for Simple Evaluation of Food Additive Intake, CAC/GL 03-1989,” CAC, Rome, 1989b.
- Codex Alimentarius Commission (CAC), “Working Docu-
- ment for Information and Support to the Discussion on the General Standard for Food Additives. CX/FA 07/39/8. Joint FAO/WHO Food Standards Programme,” CAC, Rome, 2006.
- European Parliament and the Council of the European Union (EU), “European Parliament and Council Directive 94/36/EC of 30 June 1994 on Colours for Use in Food stuffs,” Official Journal of the European Communities, No. L237/13, 1994.