Advances in Remote Sensing
Vol. 2 No. 2 (2013) , Article ID: 33173 , 13 pages DOI:10.4236/ars.2013.22017
Land Cover Fragmentation Using Multi-Temporal Remote Sensing on Major Mine Sites in Southern Katanga (Democratic Republic of Congo)
1Royal Institute of Natural Sciences, Bruxelles, Belgium
2Brussels Environment, Bruxelles, Belgium
3RBNS/Convention on Biological Diversity, Bruxelles, Belgium
Email: *cnkono@naturalsciences.be
Copyright © 2013 Laëtitia Dupin et al. This is an open access article distributed under the Creative Commons Attribution License, which permits unrestricted use, distribution, and reproduction in any medium, provided the original work is properly cited.
Received February 24, 2013; revised March 26, 2013; accepted April 2, 2013
Keywords: Land Cover; Fragmentation; Katanga; Remote Sensing
ABSTRACT
The study areas are located in the Katanga province to the South Eastern part of the Democratic Republic of Congo (DRC). It focuses on the Kolwezi and Tenke-Fungurume mining centers, located in the vicinity of the Basse-Kando reserve. The 3 study areas have faced large scale human induced the fragmentation of land cover. A combination of ancillary data and satellite imageries was interpreted to construct fragmentation dynamics over the last 30 years. This study is an initial step towards assessing the impact of fragmentation on sustainable land cover in the Katanga. The results bring out that large trends of fragmentation differently occurred over the last 30 years (1979 to 2011) in the three focused areas. The most dominant fragmentation processes were gains in barren soil and cities surface and a sharp reduction in burned areas. In Kolwezi, a close relationship is observed between growth and regression of barren soil and cities over vegetation. The Tenke-Fungurume site shows a growth during the 1980-1990 time slice and regression of vegetation during the following two decades. The Basse-Kando site analyze brings out growth of vegetation and regression of burned area due to vegetation conservation efforts. This is one of the studies in Katanga around mines activities that combine multi-source and spatio-temporal data on land cover to enable long-term quantification of land cover fragmentation.
1. Introduction
Land cover fragmentation is now recognized as an indicator and a prominent interface between human activities and global environmental change. Human and environment interactions involve conversion of natural landscapes into anthropogenic use or by changing management practices in human-dominated landscapes [1].
Understanding the role of land use in global environmental change and the long-term human-environment interaction require historical reconstruction of past land cover conversions. The information on land cover under developed countries is usually missing, out dated or inconsistent [2,3]). The launch of the Landsat imagery platform in 1972, followed by others such as SPOT and ASTER, has provided satellite remote sensing (RS) capacity to detect LUCC over the past 30 years at most. As suggested by [4], “Land cover” refers to the biophysical state of the earth’s surface and immediate subsurface [5], and, “Land fragmentation” brings out the human employment of land [6]. The combined application of land cover and fragmentation data allows detection of type of change, as well as the way land is changing [7]. In this study we will provide fragmentation quantification in land cover. Rare environmental studies have been undertaken in this area.
In this paper, the study of the environmental changes in South-Eastern of Democratic Republic of Congo (DRC) aims to establish a detailed assessment of fragmentation patterns over time and space. The study was undertaken more specifically in the surrounding of Kolwezi and Tenke-Fungurume copper-cobalt mining sites and the Basse-Kando Natural Reserve. For our study, we used the Landsat MSS, TM, ETM and SPOT images, Shuttle Radar Topography Mission (SRTM) Digital Elevation Model (DEM) and the Aster DEM. The goal of this study was to detect land cover fragmentation (magnitude, spatial and temporal analyze) in terms of their spatio-temporal pattern over a period from pre- 1980 to 2011 for the Katanga province (Figure 1(a)).
The remaining sections of this paper are organized as follow: Section 2 introduces the background of the study area; Section 3 describes the data and method used in this article; in Section 4, the land cover fragmentation results are presented, followed by a discussion of the results in Section 5; the conclusion of this research is given in Section 6.
2. Study Area
The study areas are located in the South-Eastern part of the DRC, in the Katanga province. It focuses on the Kolwezi and Tenke-Fungurume mining centers, and the Basse-Kando reserve. The Katanga province is one of the largest and most populated provinces of DRC. It encompasses apart from Kinshasa, the capital, the major cities of the country (Lubumbashi, Kolwezi, Likasi), not only from a demographic point of view but also economically (Figure 2). The Katanga province shares the DRC border with three countries: Angola to the Southwest, Zambia to the South and Southeast and to the East Tanzania. Vast reserves of copper (Cu) and cobalt (Co) are found to the South of the Katanga province, between Kolwezi and Lubumbashi strongly encountered linked to the Katanga super-group.
Geological setting of the Katanga Super-group is commonly subdivided into three lithostratigraphic groups: the basal Roan, the middle Nguba (formerly Lower Kundelungu) and the Kundelungu (formerly Upper Kundelungu) at the top [8-14].
In the vicinity, several major reserves endure pressure. The Basse-Kando reserve is part of the conservation areas of the South-Eastern DRC. Major parks lie in the vicinity of the mining activities. The national park is under State ownership and management for the protection of flora and fauna. The reserve is a legalized land and must be managed for the benefit of all members of the community. Any resource extraction must be subjected to a management plans approved by the Government. The buffer zone is the land immediately adjacent to the boundaries and surrounds the entire protected areas (park and reserve). It is co-managed the best suitable way for and by the various stakeholders including government institutions, non-governmental organizations, communities associations and to some extent with the involvement of the private sector. This is the case of the Basse-Kando, one of the focus areas of the present study. The last decades have seen depletion of the biodiversity in the reserve as well as in its surroundings. Moreover, no environmental assessment is available in the Katanga province, which reveals a real lack in environmental management [15].
3. Methodology
3.1. Remote Sensing Data
Medium resolution images were used as Landsat MSS for 1979, TM for 1990 and ETM for 2000 and Spot 4

Figure 1. (a) Overview of the Katanga Province and major cities located in Democratic Republic of Congo; (b) Location of the study area, Southern Katanga parks, reserves and buffer zones.

Figure 2. General geological map of Katanga indicating the main units. The Roan group (R) is the richest cobalt-cobalt mineralisation ore deposits: R1 is the lower unit, and R4 is the upper unit [14].
vegetation for 2011, with 60, 30, 30 and 20 meter resolution, respectively. The multi-temporal approach used in this study required 3 imagery scenes, one of each focused area, for 1979, 1990, 2000 and 2011. The type of image coverage was chosen considering their availability for the area, for the period of time, their similarity in term of spectral range and spatial resolution. The images were selected for the period between end of May and early June. This corresponds to the beginning of the dry season and ensures a minimum cloud cover on the images and minimizes the presence of fire patches widely spread in a later stage of the dry season.
Appropriate remote sensing geometric and radiometric corrections were applied through digital image processing techniques to investigate more accurately land cover patterns. Landsat images were acquired from University of Maryland GLCF web site [16]. They were already georeferenced but showed some spatial shifts between images for the MSS and TM. The SPOT images were acquired without any spatial reference system. The Landsat MSS and TM were re-projected and the SPOT images were georeferenced all based on the Landsat ETM+, with the WGS84 reference system. This is an important step to ensure the best spatial match for the multi-temporal land cover fragmentation analyze.
3.2. Pre-Processing of Satellite Data
Some atmospheric corrections were applied following the COST technique [17] in order to build mosaics and compare the different period images on the same spectral base. Some Landsat MSS images revealed some spurious lines. A frequently used technique to correct line-drops consists in replacing the defective pixels with average DNs (digital numbers) of adjacent pixels [18], which is efficient in the case of one or two pixel wide lines. Spectral filters were implemented based on Fourier analysis to remove most of the periodic noise [19].
The negative effect of shadowing is the visual quality degradation of the images and cause several nuisances during the analysis of these images by modifying spectral response of areas under shadow. Thus, they are often confused with other types of objects which have a similar spectral signature. The results are a misclassification of areas covered by shadow. In the study area, the shadow spectral signature is confused with water and burning signatures. It is important to correct this effect to improve the classification process. In this purpose, the c-correction method was applied to the images using the SRTM and the Aster DEM.
3.3. Image Classification
Here we used traditional Maximum Likelihood Classifier (MLC) because of its ease in simple operation, application and good performance (Figure 3). We propose a standard classification strategy that uses different input feature sets, unlike conventional classification methods using identical classifier structure and feature sets to each land cover type.
3.4. Land Cover Type, Change and Fragmentation Analysis
The training sites were chosen to be classified as follow:
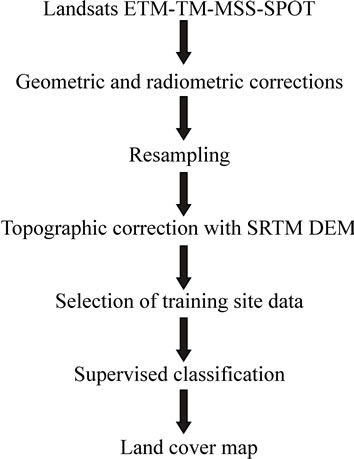
Figure 3. Methodological flowchart.
1) vegetation, 2) barren soil and cities, 3) burned area and 4) river. Then changes between the various time slices were analyzed and quantified.
Maps were analyzed using ArcView (version 9; ESRI (1999)) and its extension Arc View Spatial Analyst for Windows to quantify land cover changes, vegetation loss and to configure grid covers for the application of landscape spatial indices. These indices (or spatial metrics) were computed by FRAGSTATS (version 4.1) [20,21] to compare the spatial pattern of vegetation, barren soil and cities, and burned area cover for each time interval and study area.
The spatial configuration of land cover fragments was quantified and compared on the basis of the following key landscape metrics selected after reviewing recent vegetation fragmentation studies [22-29]: 1) patch area (%), 2) largest patch index (% of the landscape comprised by the largest patch), 3) aggregation index (% likely hood adjacencies between cells of the same patch type) and 4) number of patches. All of these metrics have been applied in the assessment of spatial attributes in fragmented landscapes.
3.5. Accuracy Assessment
According to the rules suggested by PCI geomatics for ranges of separability values of class signatures, a “good” signature separability was achieved for each image classified, the average Bhattacharrya distance ranging from 1.979 to 1.987. Overall agreement of classification was 83.2% for the 1979 MSS, 84.3% for 1990 TMimage, 85.9% for the 2000 ETM image, and 84.9% for the 2011 SPOT image. The lowest values of accuracy corresponded to shrubland, arboreus shrubland, and native vegetation categories. These three groups are very similar in their spectral signatures because they correspond to stages in a continuous succession process, which may easily produce misclassifications between the categories assigned in the training site and those classified by the algorithm, which leaded us to group them all in one category (vegetation).
4. Results
Changes in the landscape distribution in the three study areas for the 4 time slices were quantified as difference between image pixels of 2 successive periods (geometric and radiometric normalization). The results of the land use/land cover classification for the time series are presented in Table 1.
4.1. Change in Land Cover
Land cover fragmentation were analyzed using the area statistics (Table 1) derived from land cover type maps (Figure 4). In 1980, the vegetation covered 40% of the territory in Kolwezi (Figure 5(a)), about 70% of the territory in Tenke-Fungurume (Figure 5(b)), and 50% of the land on the Basse-Kando site (Figure 5(c)). The next decade (1990) is marked by increased the area covered by vegetation on the three study sites, it reaches 50% in Kolwezi ((Figure 5(a)), 85% in Tenke-Fungurume (Figure 5(b)), and this increase is rapid on the site of the Basse-Kando with 80% (Figure 5(c)). During the second decade, the dynamics of change is not the same on all three sites. The surface covered by vegetation undercome a regression phase in Kolwezi from 50% to 40%, the regression is less important on Tenke-Fugurume where it then covers a little less than 80%, unlike the BasseKando that surface covered by vegetation exceeds 80%. The third decade is marked by a slight regeneration of the vegetation in Kolwezi, while the regression continues in Tenke-Fungurume, and the Basse-Kando site known the first phase phenomena of regression.
The second type of coverage is the barren soil and cities; its dynamics of occupancy is shown in the Figures 5(a)-(c). Since 1980, the barren soil and cities occupies 40% of the land surface in Kolwezi, less than 10% at Tenke-Fungurume, and the Basse-Kando reserve. The next decade sees the territory occupied by the barren soil and cities decreasing in Kolwezi, and the Basse-Kando, while it increases in Tenke-Fungurume up to almost 10% in 1990. The following decade was marked by an increase in the territory occupied by the barren soil and cities; it reached 50% in Kolwezi, Tenke-Fungurume 20%, and 10% in the Basse-Kando reserve. During the last decade, the barren soil and cities kept evolving and grow reached almost 30% in Tenke-Fungurume, and 20% in the BasseKando reserve.
The last coverage type is represented by burnt areas; the Figures 5(a) and (b), shows the evolution over the last 30 years. In 1980, the burnt areas accounted for over 10% of Kolwezi territory, 25% of Tenke-Fungurume,
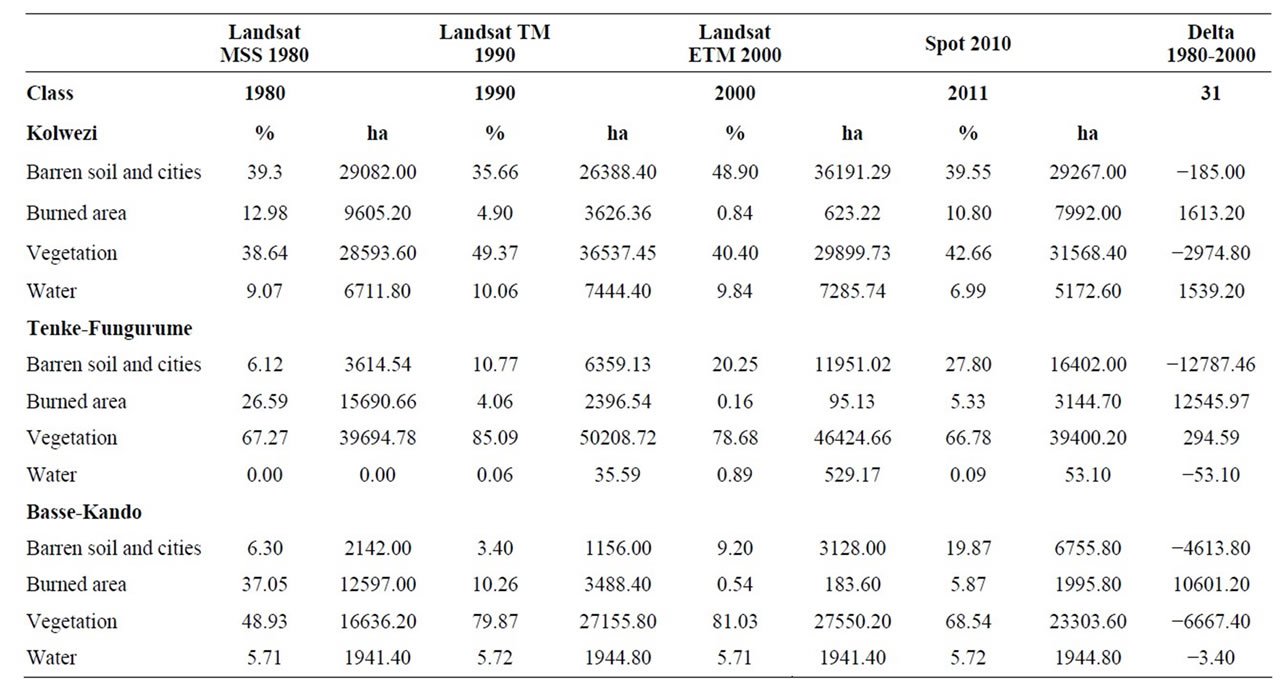
Table 1. Estimation of land cover type (% and ha) in the study area for 1980’s, 1990’s, 2000’s, and 2011 years.
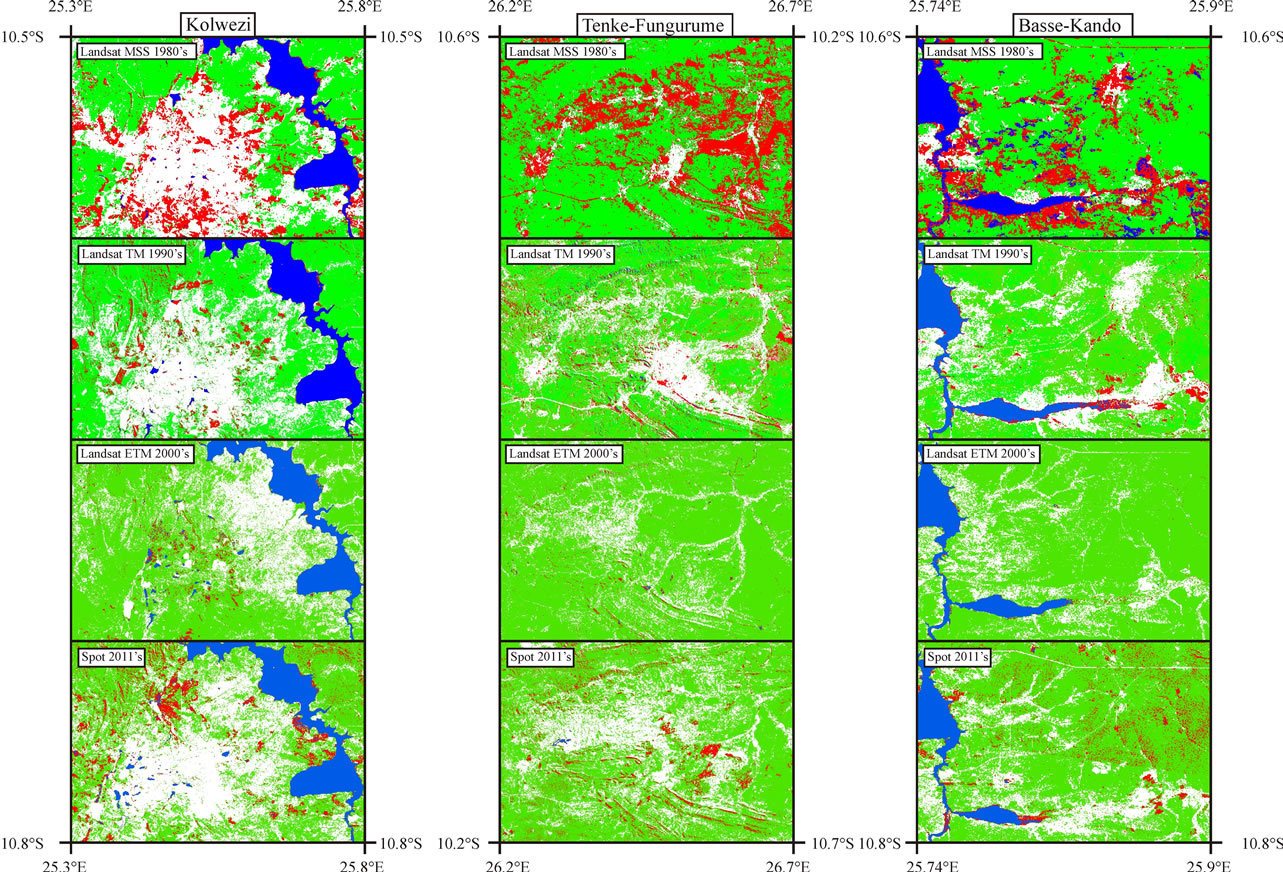
Figure 4. Temporal and spatial variation maps of the land cover types in the study area for the years: Landsat MSS (1980’s), TM (1990’s), ETM (2000’s), and Spot (2011). Landsat classifications: the blue color stands for water, the white color for barren soil and cities, the red for burned area, and the green color for vegetation.
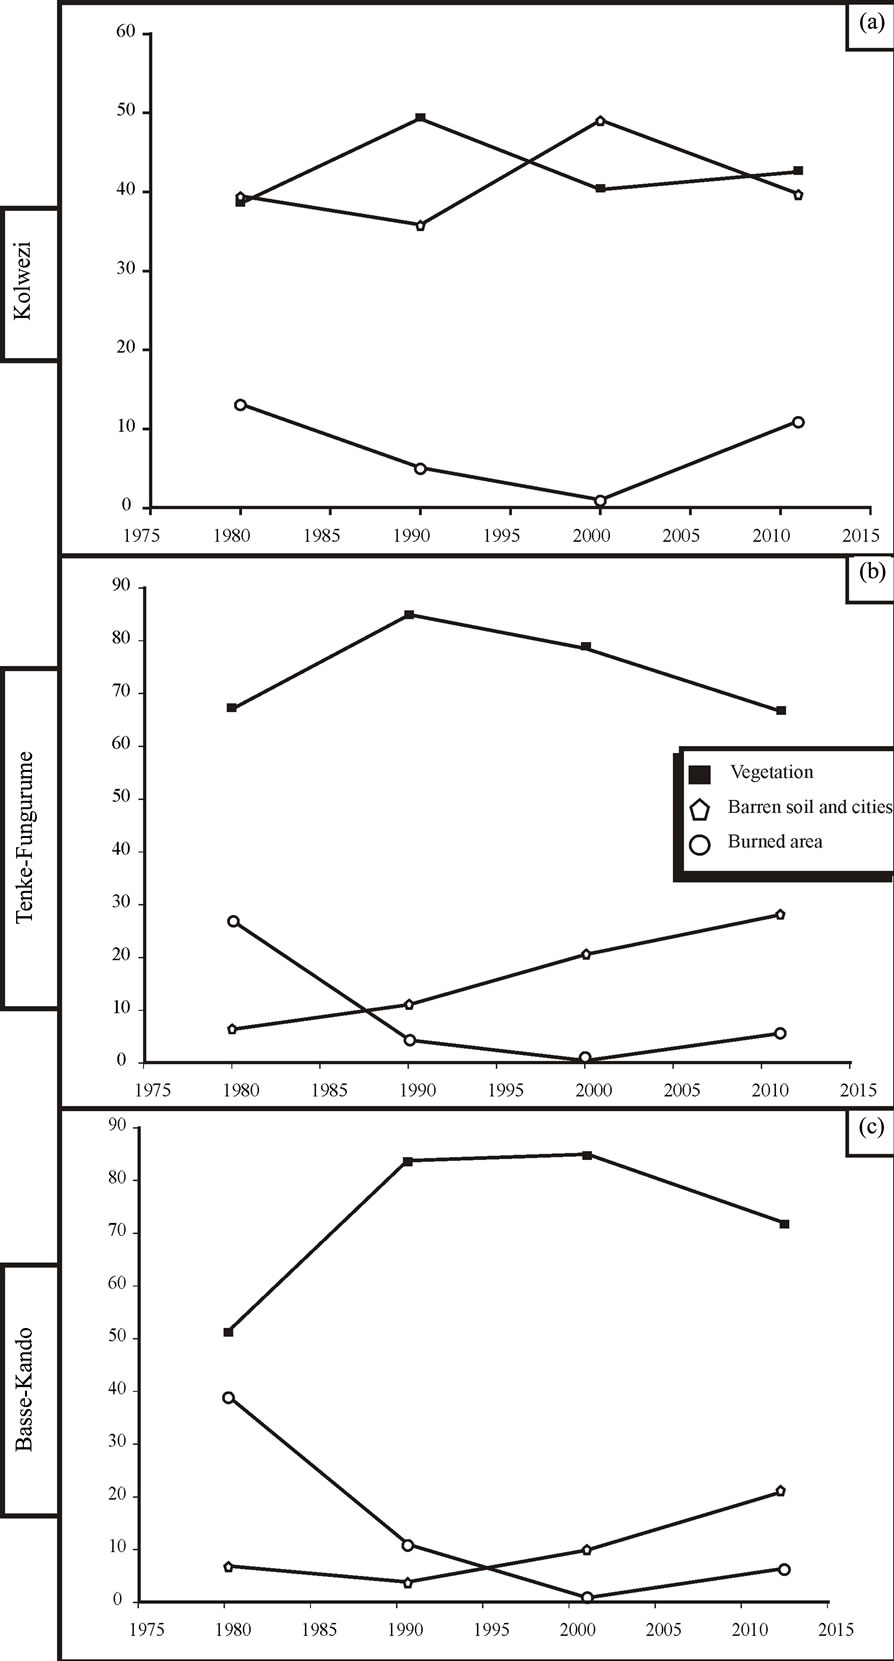
Figure 5. Temporal changes estimated in % for vegetation, barren soil and cities, and burned area: (a) Kolwezi; (b) TenkeFungurume; (c) Basse-Kando.
and more than 35% of the Basse-Kando reserve. This area saw its territory decrease gradually; in 2000 it’s stand for less than 1% on three study sites. The last decade was marked by the increase of the territory occupied by the burnt areas, more than 10% in Kolwezi, a little more than 5% in the Basse-Kando reserve and Tenke-Fungurume.
The evolution dynamics of each coverage type over the last 30 years are brought in Figures 5(a)-(c). The figure suggests a different evolution for vegetation and barren soil and cities in the three study sites rather than burned areas follow a similar trend in the three study sites. These different dynamic behaviors are the focus of the following analyses.
4.2. Change in Vegetation Patch Number
The variation of patch number in the Kolwezi area is illustrated on Figure 6 and Table 2. This figure shows that the vegetation patch number increase between 1980 and 1990 is related to an increase of the vegetation area and the decrease of the barren soil and cities. This reduction is also marked by an increase of the barren soil and cities patch number. This parceling of barren soil and cities continues between 1990 and 2000, but the total area also increases leading to a reduction of the vegetation area and patch number. From 2000 to 2011, both trends are again evolving in the opposite directions with an increase in the number of vegetation patches, and a decrease in the barren soil and cities class.
The Tenke-Fugurume site shows a cyclic variation (Figure 6 and Table 2) with a peak in 1990 and a low point in 2000. However over the last 30 years the evolution curves of the patches number intersect twice in 1985 and in 2000.
Evolution curves of the patch number in the BasseKando site are drawn on Figure 6 and Table 2. These curves follow the same trend as those of Tenke-Fungurume, reaching a high level in 1990 and 2011 and lowest one in 2000. Unlike the other sites, the curves in the Basse-Kando site do not intersect.
4.3. Spatial Relation between Vegetation Cover and Barren Soil and Cities
Index of aggregation is one of the important parameters in the analysis of the land cover change. This index has been calculated on two types of land cover: vegetation, on the one hand, and barren soil and cities classes on the other hand. The change in this index in the Kolwezi area is illustrated in Figure 6; it shows the same close relationship than the previous parameters, as it involves a decrease until 1990. During the next decade, while the
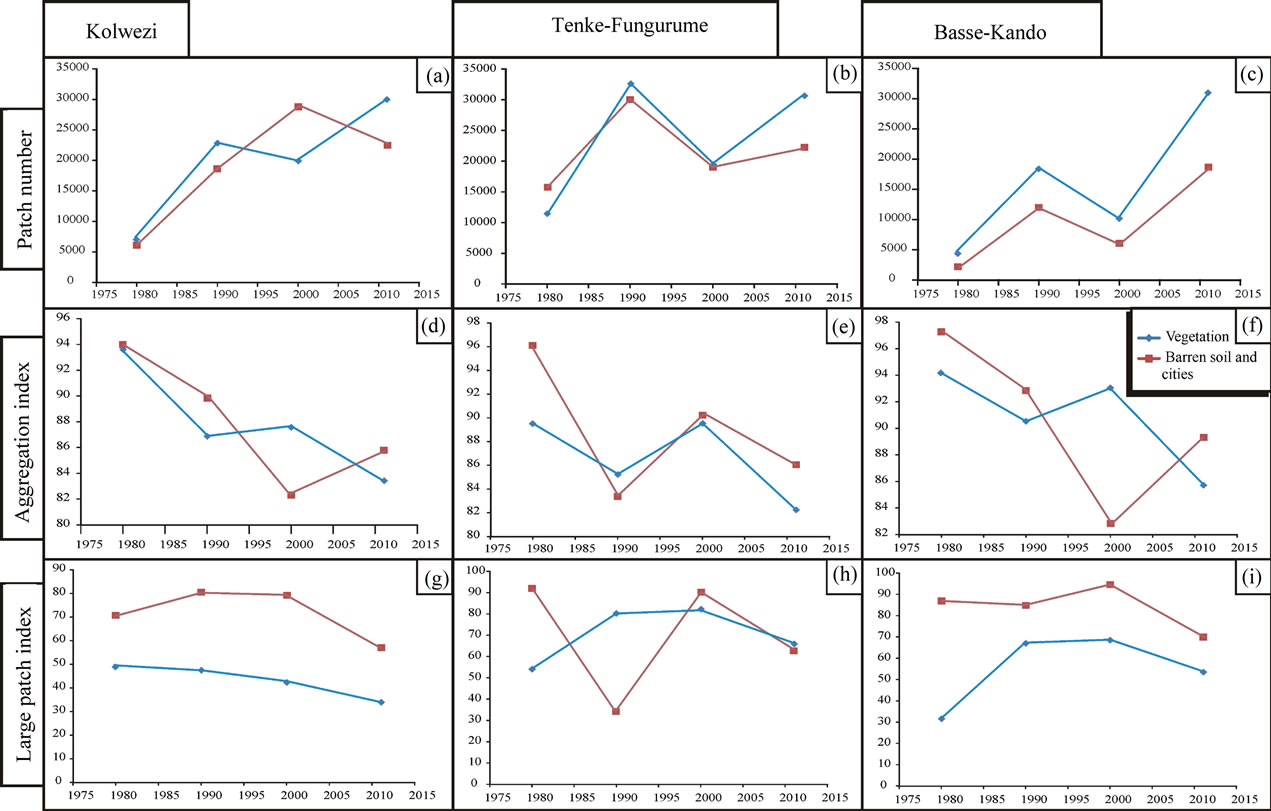
Figure 6. Temporal changes in the study area estimated in term of: %, patch number, aggregation index, and large patch index.
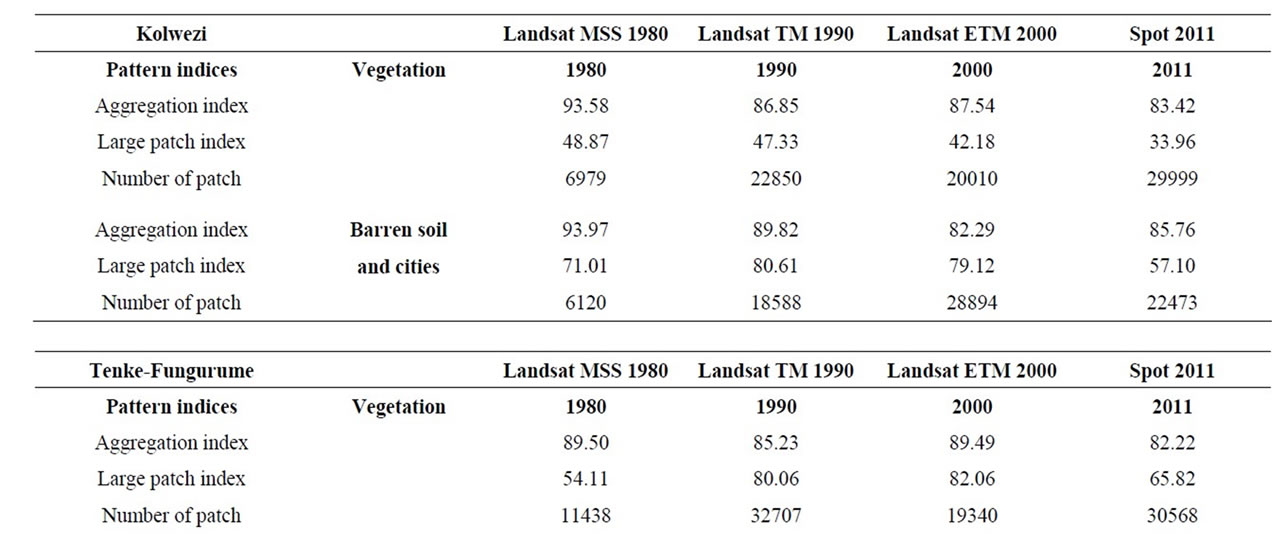
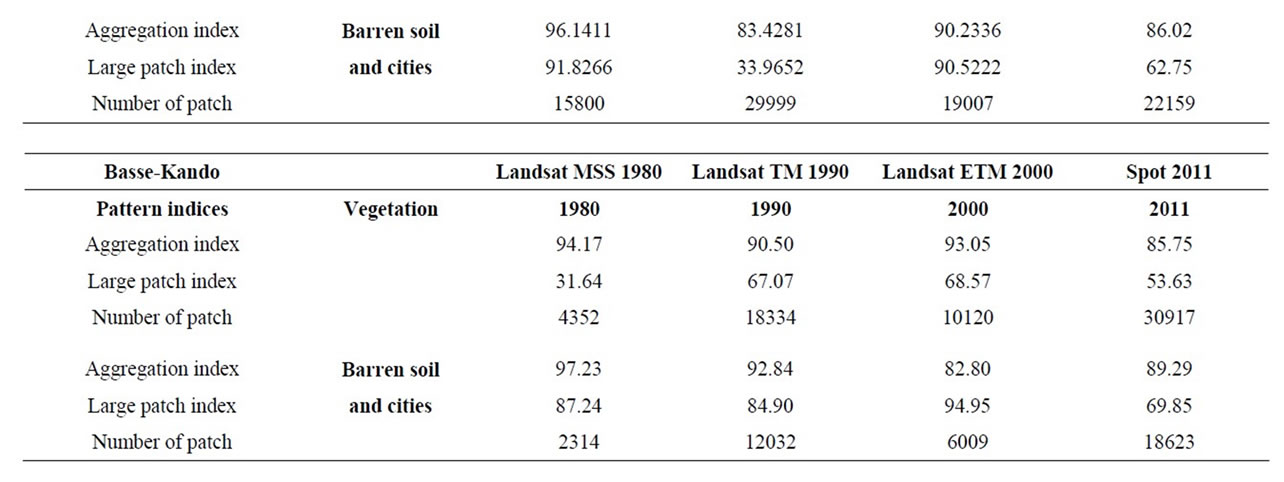
Table 2. Changes in landscape pattern indices for vegetation, and barren soil and cities in the study area for 1979, 1990, 2000, and 2011 years.
index of aggregation of the barren soil and cities continues to decrease, those vegetation increases, producing the first crossing in 1993 (which corresponds to the wave of migration to the east of the DRC population from neighboring Rwanda). From 2000 to 2011, the evolution of this index on the two types of land cover is evolving in the opposite direction with an increase in the index of aggregation of the barren soil and cities, and a decrease in that of vegetation, producing the second crossing in 2007 (corresponds to the resumption of fighting in eastern of DRC).
This aggregation index (Figure 6 and Table 2) have a cyclic variation on the Tenke-Fugurume area. This variation is marked by a decrease during the first and the last decade, and an increasing curve in the second decade. The highest points correspond to the years 1980 and 2000, and the lowest points respectively to 1990 and 2011. The evolution of curves over the past 30 years shows two junctions in 1987, and in 1997.
The aggregation index curves on the site of the BasseKando are drawn on Figure 6. In opposite to the previous settings, these curves have a complementary development similar to that observed in Kolwezi. This evolution is marked by a decrease in this index until 1990. Over the next decade, while the index of aggregation of the barren soil and cities continues to decrease, those vegetation increases, producing the first crossing in 1993. During the past decade, the two curves are evolving in the opposite direction with an increase in the index of aggregation of the barren soil and cities, and a decrease in that of vegetation, producing the second crossing in 2007.
5. Discussion
The present study constitutes an extensive analysis of land cover fragmentation conducted in Katanga. The results demonstrate how changes in spatial patterns of the land cover may be assessed using multi-temporal satellite data, as has been achieved recently in other parts of the world [4,30,31].
5.1. Assessment of Methods and Results
As satellite imagery classifications into land cover types are never completely accurate, landscape pattern analyze of the present study are affected by errors in the classification which alter the accuracy. Image accuracy tends to improve as the image date becomes more recent. The supervised classification, which was strongly supported by ground-based information, provided a suitable identification of land cover types in each of the satellite scenes processed. Although the classification conducted for the oldest scene (MSS 1980) suffered from the disadvantage of limited ground validation, a cautious interpretation considering field control points that had not changed over time involving high values of accuracy to be obtained, and enabling clearly identifiable categories of land cover in the classification.
In the present study, the error was minimized by applying improved topographic correction algorithms in the image processing and by aggregating some of the subcategories of land cover types. Additionally, different ground-based surveys conducted from previous works and additional field visits were used to support the image classifications. Also, the error was minimized by filtering the classified image to remove small patches of less than four 50 m-pixels (equivalent to 0.60 ha).
5.2. Land Cover Change and Spatial Analyzis
Landscape pattern indices provide a useful tool to explore inside variability, cross-site differences and changes over time. The simultaneous use of class-level and patch-level landscape pattern indices enable assessment of the spatial configuration of vegetation cover and its relation to other land cover types.
The various indices and parameters used in the analysis of the land cover change (fragmentation) at Kolwezi site are shown on Figure 6. During the first period (1980-1990), for the vegetation, there is an increase in the patches number, but a regression of the aggregation and the large patch index. This evolution of the parameters suggests that vegetation has enlarged by the formation of small scattered patches. This period corresponds to the decrease of area occupied by barren soil and cities, despite the increase of their patch number, and the large patch index. This variation of parameters shows the regrouping of barren soil and cities, which may correspond to a concentration of the population in areas. At the same time the burned areas decreased strongly, this means a neglect of agriculture by the population that turns towards another socio-economic activity.
The next decade (1990-2000) is marked by the reduction of space occupied by vegetation, the burnt areas, and especially by a growth of barren soil and cities. This evolution is marked for the barren soil and cities by the increase in the large patch index, and the number of patch. For the vegetation, only the aggregation index increases while others parameters decrease. This variation shows that vegetation is replaced by barren soil and cities, mainly by occupation of small scattered areas. This situation would correspond to the degradation of the vegetation zones for a socio-economic activity, which in this case corresponds to the exploitation of mineral resources.
The last decade (2000-2011) is marked by the regeneration of the vegetation, and a decrease in the barren soil and cities surface. This is illustrated by the increase in the number of patches for the vegetation, and a reverse evolution for the barren soil and cities. The simultaneous decrease in the large patch index for both types of land cover illustrates the fact that vegetation has expanded by small patches, and that the barren soil and cities are small isolated areas and increasingly more consolidated.
The various indices and parameters used for the fragmentation of the land cover analysis are represented on Figure 6 for the Tenke-Fungurume site. The first decade here is marked by the regeneration of the vegetation and by the increase in the barren soil and cities. This is illustrated by an increase in the number of patches, but a regression of the index of aggregation. The large patch index brings out a different evolution; it decreased strongly for barren soil and cities and increased for vegetation. This evolution of the parameters shows that vegetation is enlarged by training large scattered patches, and so that the barren soil and cities was enlarged by the formation of small patches. During the same period, the burnt areas decrease strongly; this means a neglect of agriculture by the population that turns to another socioeconomic activity.
The second decade is marked by the reduction of the area covered by vegetation, the burnt areas, and especially by a growth of urban areas. Because of the increase in the large patch index of barren soil and cities, the aggregation index, and the decrease of other parameters, it shows a growth of barren soil and cities specifically located around existing sites. This variation suggests that vegetation and burned areas are replaced by barren soil and cities. This situation is similar to that encountered in Kolwezi where agricultural activity is depreciated in favor of a socio-economic activity, which in this case corresponds to the exploitation of mineral resources.
Over the last decade, the vegetation surface continues to decline, while the barren soil and cities, and burned areas increase. This is illustrated by a raise in the number patches, and a drop decrease the large patch index and index of aggregation for both types of ground covers. This situation brings out the constant development of the barren soil and cities involving the vegetation fragmentation in small patches. This phenomenon suggests a resumption of agricultural activity, coupled with other socio-economic activities.
The variation of the different parameters for the analysis of the fragmentation of the land cover in the BasseKando reserve is illustrated on Figure 6. The first decade was marked by an increase of the vegetation, and a decrease of barren soil and cities, and burned areas. It comes along with a raise in the patches number, and a decrease in the aggregation index for both types of land cover. The large patch index shows a different evolution with an increase for vegetation and a decrease for the barren soil and cities. This reflects an increase of vegetation by large areas close to each other and interconnected. Barren soil and cities are mainly small disconnected groups. At the same time the burned areas drop sharply meaning a neglect of agriculture by the population that turns towards another socio-economic activity.
The second decade is marked by an increase of the barren soil and cities surface, stagnation of vegetation areas, and a reduction of burnt areas occupation. This development is marked by an increase in the large patch index of barren soil and cities and vegetation, a decrease in the patch number. Only the aggregation index shows a different variation, a growth for the vegetation, and a decrease for barren soil and cities. It suggests that vegetation here is protected, and that the surface replacement is operated between the barren soil and cities and the burned areas.
During the last decade a growth of barren soil and cities, areas burned and a small decrease in vegetation is observed. It is illustrated by an increase in the patch number, for both types of land cover, a decline in the large patch index. The aggregation index shows a development in opposite directions, an increase for the barren soil and barren soil and cities and a decrease for vegetation. This situation represents a growth of barren soil and cities by small interconnected patches, and a decrease of the vegetation fragmented into small patches.
5.3. Impacts
Over 12,700 protected areas have been established around the world, accounting for 8.81% of Earth’s land surface. Protected areas are a key strategy used to conserve biodiversity from human activities. Remote sensing is being used to determine how successful protected areas are at mitigating human impact [32].
The 1970’s classification brings out a significant observation with the presence of very large burned patches specifically located around human activity points. The Basse-Kando hunting reserve is well-established as its creation dates back from 1957 by the Congolese government and was recognized and integrated into the Congolese mining code official journal, special number, April 2003 [33]. However, the deforestation and fragmentation rates within the reserve remained over the 30 years of the study. The vegetation regression rate remains lower in the protected (Basse-Kando reserve) area than in mine areas (Kolwezi and Tenke-Fungurume). By adding geological data layers in the Geographic Information System (GIS) to the classification information, it allows us to distinguish the original drivers inducing vegetation regression and fragmentation in the Basse-Kando reserve. Mining companies are focusing on a highly investmentworthy economic geologic unit named the “Mines series” to exploit the copper and cobalt ores (Figure 2). The international economical context is really propitious for the exploitation of copper and cobalt ores. Indeed, the superposition of both layers indicates that the barren land patches within the mine series unit are generated by mining activities and the patches outside are human settlements. The encouraging economic copper and cobalt consumption trends for the forthcoming years imply that the pressure on the Basse-Kando reserve is going to increase and the fragmentation rate will raise in the “mines series” specific location zones. The same trend is observed at the international scale in [34].
The mining areas of Tenke-Fungurume and Kolwezi in the buffer conservation zones as well as the Basse-Kando reserve in Katanga, South-eastern (DRC), are being studied through analysis of remotely sensed data for evaluation of impact due to mining and related activities on the environment. The comparison between different industrialization periods covering a time span of about 30 years depicted through remotely sensed reveals that the face of the assessed areas changed progressively with the development of mining activities. A detailed assessment of impact of mining changes in LULC pattern and fragmentation on time and space has been undertaken to illustrate and quantify the changes. By means of multispectral and multi-date remote sensing data processing and classification, the results show 1) an evolution from extensive large to small scale denudation patches can be observed from 1970’s to 2000’s; 2) 3 observation types corresponding to vegetation cover regression in the 1970’s, vegetation reclamation in the 1990’s, then again a vegetation regression period in the 2000’s and going on more intensively until 2011. Moreover, the comparison of land cover and geological maps and protected areas clearly shows that mining sites are increasingly overlapping vegetation. It brings out a similar trend of vegetation pattern evolution as the buffer areas but not at the same intensity.
The classification of the Basse-Kando reserve, the Kolwezi and Tenke-Fungurume mining centres from the 1979 until 2011 shows different trends, with vegetation regeneration between 1979’s and 1990’s followed by regression phase since the 1990’s.
The observed vegetation changes in the vicinity of the mining sites are the results of (1) direct factors such as the evolution in the type of mining extraction and the variation of the ore production volumes and also (2) to factors indirectly derived from the mining activities such as demographic influx due to the attraction of job offers, economic growth, agriculture development (Figure 2). Deforestation became the dominant process, involving a decline in both mean patch number. The process of fragmentation comes along with the loss of the largest vegetation patch (Table 2). The gradual increase to mining and non-vegetation areas revealed the pressure of this activity on the surrounded landscape. However, most of the mining concessions and operational mining sites are located in governmental protected areas and surrounded protected buffer zones (Figure 2).
5.4. Potentials Drivers
The presence of large burnt and barren soil areas is largely specific to the 1970’s as no such event was observed in the other classification maps. The field campaign interviews gave the opportunity to get some information about this time and to identify the drivers, which triggered the large fire episodes in the area. Indeed this period corresponds to governmental investments to relaunch and stabilizes the DRC economy after the independence of the country which led to some economic instability.
At the beginning of the 1980’s, Kolwezi and TenkeFungurume area some of the spots which benefited from investments in new ore deposit exploitation. Intensive exploration campaigns were carried out in those areas with drilling and trenching programmes as well as copper clearings on surrounding hills, feasibility studies and infrastructure building (airport, buildings for administration and workers, road access, concentrator, etc). These exploration activity appears later in the Basse-Kando area. The burning signature is then considered to be from an anthropogenic origin. Thus, in this study, this signature is associated to the barren soil class in the assessment of mining operation impact. The 1980’s classification brings out a significant observation with the presence of very large burned patches specifically located around human activity points.
6. Conclusions
In this paper, we demonstrate capacity to monitor the vegetation status versus the mining activities of a natural reserve and two important mining areas using a combination of Geographic Information System (GIS), remote sensing techniques, field-based observations and textual data resources. The multi-temporal remote sensing approach is used in the assessment of the spatial changes, their organisation and the determination of the agents involved in the land cover fragmentation. This information coupled with geological data, parks and reserves boundaries suggests the trend of the future pressure on land cover in the study area. The investigation goes further with the identification of drivers which are essential to understand the processes of changes.
The structure of the study areas catchment has changed significantly during the study year period. This study quantifies the degenerating condition of the land cover due to anthropogenic activities. The land cover areas have become more fragmented and are characterized by the proliferation of much smaller, less connected patches. The management of those areas, particularly the identification and prioritization, rehabilitation, preservation, and the development of supporting policies, could be expected to benefit from the use of landscape structure information. Moreover, no environmental assessment is available in the Katanga province, which reveals a real lack in environmental management [15]. Scientific mining advices should provide alternative operational methods for a better use of natural mineral resources by minimizing the damages. Proactive management with a focus on conservation and sustainable management are imperative.
7. Acknowledgements
The authors wish to thank the GECO program (Geology for an ECOnomic sustainable development) financed by the Foreign Affairs Ministry.
REFERENCES
- J. A. Foley, R. DeFries, G. P. Asner, C. Barford, G. Bonan, R. S. Carpenter, F. S. Chapin, M. T. Coe, G. C. Daily, H. K. Gibbs, J. H. Helkowski, T. Holloway, E. A. Howard, C. J. Kucharik, C. Monfreda, J. A. Patz, I. C. Prentice, N. Ramankutty and P. K. Snyder, “Global Consequences of Land Use,” Science, Vol. 309, No. 5734, 2005, pp. 570-574. doi:10.1126/science.1111772
- A. Di Gregorio and L. J. M. Jansen, “New Concepts for a Land Cover Classification System,” The Land, Vol. 1, 1998, pp. 55-65.
- A. B. Brink and H. D. Eva, “Monotiring 25 Years of Land Cover Change Dynamics in Africa: A Sample Based Remote Sensing Approach,” Applied Geography, Vol. 29, No. 4, 2009, pp. 501-512. doi:10.1016/j.apgeog.2008.10.004
- J. E. Wasige, T. A. Groen, E. Smaling and V. Jetten, “Monotoring Basin-Scale Land Cover Changes in Kagera Basin of Lake Victoria Using Ancillary Data and Remote Sensing,” International Journal of Applied Earth Observation and Geoinformation, Vol. 21, 2013, pp. 32-42. doi:10.1016/j.jag.2012.08.005
- B. L. Turner II, D. Skole, S. Sanderson, G. Fischer, L. Fresco and R. Leemans, “Land-Use and Land-Cover Change; Science/Research Plan,” IGBP Report No. 35, HDP Report No. 7, IGBP and HDP, Stockholm and Geneva, 1995.
- B. L. Turner II and B. L. Meyer, “Global Land Use and Land Cover Change: An Overview,” In: W. B. Meyer, B. L. Turner II, Eds., Changes in Land Use and Land Cover: A Global Perspective, Cambridge University Press, Cambridge, 1994, pp. 3-10.
- L. J. M. Jansen and A. Di Gregorio, “Parametric Land Cover and Land-Use Classifications as Tools for Environmental Change Detection,” Agriculture, Ecosystems and Environment, Vol. 91, No. 1-3, 2002, pp. 89-100. doi:10.1016/S0167-8809(01)00243-2
- A. François, “Stratigraphy, Tectonics and Mineralization in the Copper arc of Shaba (Rep. of Zaire),” In: P. Bartholomé, Ed., Stratiform Deposits and Copper-Bearing Provinces, Centennial Geological Society of Belgium, Liege, 1974, pp. 79-101.
- A. François, “Geological Synthesis on the Shaba Copper Arc (Rep. Zaire),” Centennial Belgian Society of Geology, 1987, pp. 15-65.
- A. François, “Problems Relating to the Katangian of Shaba,” In: M. Wendorff and L. Tack, Eds., Late Proterozoic Belts in Central Africa, Musée Royal de l’Afrique Centrale, Tervuren, 1995, pp. 1-20.
- J. L. H. Cailteux, “Proterozoic Sediment-Hosted Base Metal Deposits of Western Gondwana,” 3rd IGCP-450 Meeting and Field Workshop, Lubumbashi, 14 to 24 July 2003, p. 223.
- M. J. Batumike, A. B. Kampunzu and J. H. Cailteux, “Petrology and Geochemistry of the Neoproterozoic Nguba and Kundelungu Groups, Katangan Supergroup, Southeast Congo: Implications for Provenance, Paleoweathering and Geotectonic Setting,” Journal of African Earth Sciences, Vol. 44, No. 1, 2006, pp. 97-115. doi:10.1016/j.jafrearsci.2005.11.007
- S. Dewaele, P. Muchez, H. El Desouky, M. Haest and W. Heijlen, “Multiphase Origin of the Base Metal Deposits in the Lufilian Fold-and-Thrust Belt, Katanga (Democratic Republic of Congo),” 2008. http://www.gecoproject.org/?
- A. B. Kampunzu, J. L. H. Cailteux, A. F. Kamona, M. M. Intiomale and F. Melcher, “Sediment-hosted Zn-Pb-Cu Deposits in the Central African Copperbelt,” Ore Geology Reviews, Vol. 35, No. 3-4, 2009, pp. 263-297. doi:10.1016/j.oregeorev.2009.02.003
- P. Feeney, “Extractive Industries—Their Contribution to the Congos Development,” Natural Resources Management Issue Paper No. 2, Center on International Cooperation, New York, 2009.
- http://glcf.umiacs.umd.edu/index.shtml
- P. S. Chavez, “Image-Based Atmospheric CorrectionsRevisited and Improved,” Photogrammetric Engineering Remote Sensing, Vol. 62, No. 9, 1996, pp. 1025-1036.
- T. M. Lillesand and R. W. Kiefer, “Remote Sensing and Image Interpretation,” 4th Edition, John Wiley & Sons, New York, 1994, pp. 477-482.
- M. Zhang, K. L. Carder, F. E. Muller-Karger, Z. Lee and D. B. Goldgog, “Noise Reduction and Atmospheric Correction for Coastal Applications of Landsat Thematic Mapper Imagery,” Remote Sensing of Environment, Vol. 70, No. 2, 1999, pp. 167-180. doi:10.1016/S0034-4257(99)00031-0
- J. J. Kashaigili, B. P. Mbilinyi, M. Mccartney and F. L. Mwanuzi, “Dyanamics of Usangu Plains Wetlands: Use of Remote Sensing and GIS as Management Decision Tools,” Physics and Chemistry of the Earth, Vol. 31, No. 15-16, 2006, pp. 967-975.
- K. Mcgarigal, S. A. Cushman, M. C. Neel and E. Ene, “Fragstats: Spatial Pattern Analysis Program for Categorical Maps,” Landscape Ecology Program, University of Massachusetts, Boston, 2002.
- D. Armenteras, F. Gast and H. Villareal, “Andean Forest Fragmentation and the Representativeness of Protected Natural Areas in the Eastern Andes, Colombia,” Biological Conservation, Vol. 113, No. 2, 2003, pp. 245-256. doi:10.1016/S0006-3207(02)00359-2
- S. Franklin, “Remote Sensing for Sustainable Forest Management,” Lewis Publishers, Boca Raton, 2001. doi:10.1201/9781420032857
- M. Fitzsimmons, “Effects of Deforestation and Reforestation on Landscape Spatial Structure in Boreal Saskatchewan, Canada,” Forest Ecology and Management, Vol. 174, No. 1-3, 2003, pp. 577-592. doi:10.1016/S0378-1127(02)00067-1
- J. Imbernon and A. Branthomme, “Characterization of Landscape Patterns of Deforestation in Tropical Rain Forests,” International Journal of Remote Sensing, Vol. 22, No. 9, 2001, pp. 1753-1765.
- A. C. Millington, X. M. Velez-Liendo and A. V. Bradley, “Scale Dependence in Multitemporal Mapping of Forest Fragmentation in Bolivia: Implications for Explaining Temporal Trends in Landscape Ecology and Applications to Biodiversity Conservation,” ISPRS Journal of Photogrammetry and Remote Sensing, Vol. 57, No. 4, 2003, pp. 289-299. doi:10.1016/S0924-2716(02)00154-5
- N. Staus, J. Strittholt, D. Dellasala and R. Robinson, “Rate and Patterns of Forest Disturbance in the KlamathSiskiyou Ecoregion, USA between 1972 and 1992,” Landscape Ecology, Vol. 17, No. 5, 2002, pp. 455-470. doi:10.1023/A:1021274701133
- M. Steininger, C. Tucker, P. Ersts, T. Killeen, Z. Villegas and S. Hecht, “Clearance and Fragmentation of Tropical Deciduous Forest in the Tierras Bajas, Santa Cruz, Bolivia,” Conservation Biology, Vol. 15, No. 4, 2001, pp. 856-866. doi:10.1046/j.1523-1739.2001.015004856.x
- C. Echeverria, D. Coomes, J. Sals, J. M. Rey-Benayas, A. Lara and A. Newton, “Rapid Deforestation and Fragmentation of Chilean Temperate Forests,” Biological Conservation, Vol. 130, No. 4, 2006, pp. 481-494. doi:10.1016/j.biocon.2006.01.017
- H. Tommervik, K. Hogda and I. Solheim, “Monitoring Vegetation Changes in Pasvik (Norway) and Pechenga in Kola Peninsula (Russia) Using Multitemporal Landsat MSS/TM Data,” Remote Sensing of Environment, Vol. 85, No. 3, 2003, pp. 370-388. doi:10.1016/S0034-4257(03)00014-2
- W. Rees, M. Williams and P. Vitebsky, “Mapping Land Cover Change in a Reindeer Herding Area of the Russian Artic Using Landsat TM and ETM+ Imagery and Indigenous Knowledge,” Remote Sensing of Environment, Vol. 85, No. 4, 2003, pp. 441-452. doi:10.1016/S0034-4257(03)00037-3
- A. A. Apan, S. R. Raine and M. R. Paterson, “Mapping and Analysis of Changes in the Riparian Landscape Structure of the Lockyer Valley Catchment, Queensland, Australia,” Landscape and Urban Planning, Vol. 59, No. 1, 2002, pp. 43-57. doi:10.1016/S0169-2046(01)00246-8
- Mining code of the Democratic Republic of the Congo. “Law No. 007/2002 of the 11th July, 2002 Relating to the Mining Code,” Official Journal Special No. of the 15th July 2002.
- G. O. Obati and G. Owuor, “Extractive Industries, Natural Resources Management and Sustainable Development: A Review,” Affiliated Network for Social Accountability, ANSA Africa, Pretoria, 2010.
NOTES
*Corresponding author.