Advances in Nanoparticles
Vol.2 No.1(2013), Article ID:28517,5 pages DOI:10.4236/anp.2013.21012
Microwave Synthesis, Characterization and Photocatalytic Properties of SnO2 Nanoparticles
1Nanomaterials and Sensors Laboratory, Defence Institute of Advanced Technology, Pune, India
2DRDO Centre for Piezoceramics and Devices, ARDE, Pune, India
Email: *draksingh@hotmail.com, *aksingh@diat.ac.in
Received December 25, 2012; revised January 23, 2013; accepted January 31, 2013
Keywords: Microwave Synthesis; SnO2; Photocatalytic; Methylene Blue Dye
ABSTRACT
In the present endeavour, SnO2 nanoparticles (NPs) were synthesized using microwave method. Synthesized SnO2 NPs were characterized using X-ray diffraction (XRD), scanning electron microscopy (SEM) and energy dispersive spectrscopy (EDS) to find their structure, morphology and elemental composition. SnO2 NPs were of spherical morphology having crystallite size of 35.42 nm as obtained from Scherrer’s formula using most intense peak of XRD. Synthesized NPs were used for photodegradation of melthylene blue (MB) dye under UV light. The SnO2 NPs ware found to have photodegradation efficiency and apparent rate constant of 55.97% and 2.149 × 10⁻² respectively.
1. Introduction
In the recent past enormous efforts are being directed towards the development of nanometer sized materials and finding applications of these materials. SnO2 is a remarkable n-type semiconductor material having wide band gap (3.6 eV) and is sought for a wide variety of applications. It has been used, for example, as solid state sensor mainly due to its sensitivity towards different gaseous species [1,2], photovoltaic energy conversion [3], to make indium tin dioxide (ITO) transparent conductive thin film coatings [4], etc. Recently, the use of nanomaterials for solar energy conversion to environmental cleanup has been one of the most active research areas in photocatalysis [5-7]. The success in many of these applications relies on the ability in obtaining cost effective, high quality nano sized materials having uniform pore or grain structures.
The preparation of nano tin dioxide has attracted much attention recently, since it shows outstanding properties when used as a gas sensing material and also as a catalyst support. Among the various methods of nonmaterials preparation, microwave method is the most simple and effective in chemical reactions and synthesis of nanomaterials and nanostructures at relatively low temperature [8-11]. Investigations have shown that the microwave method is an attractive choice to promote reactions and is energy effective heating compared to conventional heat conduction methods due to the direct heating of the reaction mixture [12]. In conventional methods, the vessel is heated and this then this heat is transferred by convection. Since microwaves can penetrate the material and supply energy. Heat is generated throughout the volume of the material resulting in volumetric heating [13]. This method is considered to be green, more efficient in terms of the energy used, produces higher temperature homogeneity, and is considerably more rapid than conventional heat sources. Microwave dielectric heating not only enhances the rate of formation, it also enhances the material quality and size distributions. Additionally, the method shows acceleration in reaction rate, yield improvement, short reaction time, small particle size, narrow particle size distribution, high purity materials, and enhanced physicochemical properties [14].
Microwave assisted synthesis being faster, cleaner, and more economical than the conventional methods, in present work high purity SnO2 NPs were synthesized using microwave synthesis method. The photocatalytic (PC) activity for MB dye was studied using these synthesized NPs. Study shows that SnO2 NPs is a potential candidate as catalyst for photodegradation of MB dye in water with the usage of very small amount of NPs.
2. Experimental
2.1. Microwave Synthesis
All the chemicals used in the synthesis have been used as received from chemical suppliers without any further purification and processing. For synthesis of SnO2 NPs, 0.03 M solution of SnCl2∙2H2O (AR grade) was prepared and 0.05 M citric acid mixed in to it drop wise. This solution was heated at 80˚C in oven till becomes 1/4th of its volume. Later on precursor was kept for microwave heating for 10 min at 700 watt. Obtained precipitate was filtered and washed 2 - 3 times with DI water (18.2 MΩ. cm resistivity) then dried at 100˚C in an oven. Dried powder was crushed and annealed at 500˚C for 1 hr.
2.2. Characterizations
The prepared annealed samples were characterized for its structure, morphology and elemental composition using X-ray diffraction analysis (XRD), scanning electron micrograph (SEM) and energy dispersive spectrometer (EDS). Crystallographic study was carried out using Bruker AXS, Germany (Model D8 Advanced) diffractometer in the scanning range of 20˚ - 70˚ (2θ) using Cu Ka radiations of wavelength 1.5406 Å. JEOL ASM 6360 A scanning electron microscope (SEM) was used to study the morphology of the films and the elemental analysis. The intensity of absorption peaks and peak absorbance of NPs was examined by an Ocean Optics UV-Vis high resolution spectrophotometer (HR 4000).
2.3. Photocatalytic Activity
Synthesized SnO2 NPs were used for photodegradation of MB dye. In order to evaluate the PC activity of the SnO2 NPs, we use the MB dye solution as a model contamination to characterize their PC activity at ambient temperature. In the experiment, 40 ml of 0.2 ml MB in 1000 ml DI water and 0.005 gm of catalyst was used. This solution stirred for 10 minutes in dark for equilibrium of adsorption and desorption process of MB with NP’s. After stirring, the solution was irradiated by UV lamp (Blue Wave Tm 50 AS, medium intensity spot lamp, DYMAX Corporation). The UV lamp has radiation range 200 - 600 nm with nominal intensity 1000 - 2000 mW/cm2. Concentrations of MB solution initially and after every 4 minutes irradiation of UV light were taken by using UV-Visible spectrophotometer. According to the Lambert-Beer Law [15,16], the absorbance (A) of MG solution is proportional to its concentration (c), which generally followed the following Equation
 (1)
(1)
where ε is the molar absorption coefficient and b is the thickness of the absorption cell. In our experiment, all the testing parameters were kept constant, so the ε and b can be considered as a constant. Therefore, the changes of the concentration of MB aqueous solution can be determined by a UV-Vis spectrophotometer. As for the MB dye solution aqueous with low concentration, its photocatalytic decolorization is a pseudo-first order reaction and its kinetics may be expressed as [17]
 (2)
(2)
where Kapp is the apparent rate constant, and Co and C are the solution concentration or absorbance before and after degradation of MB aqueous solution, respectively. This apparent rate constant for degradation of dye was obtained by calculating the correlation between the length of time of UV light irradiation and the decreasing ratio of dye, determined using above Equation (2) [18]. The percentage efficiency of photo degradation of dyes (also known as de-colourizing ratio) was determined using following equation [18].
 (3)
(3)
where, Co and C are the solution concentration or absorbance before and after degradation. Concentrations of MB were estimated at peak wavelength (which being characteristic absorbance peak for MB dye) from UV-Vis spectra taken initially and after every 4 minutes irradiation of UV light. All PC experiments were performed at room temperature in the dark.
3. Results and Discussion
3.1. X-Ray Diffraction (XRD)
The X-ray diffraction pattern of SnO2 NPs is shown in Figure 1. The crystallite size of SnO2 NPs calculated using FWHM of from most intense XRD peak using Scherrer’s formula [19]
 (4)
(4)
where l is wavelength of X ray, b is full width and half maxima, q is Bragg’s angle. Crystallite size for these SnO2 NPs is found to be 35.42 nm. The sharpness of peaks shows that SnO2 NPs are highly crystalline.
3.2. Morphology and Elemental Analysis
Morphology of NPs were done using Scanning electron microscope (SEM) shown in Figure 2. In this study SnO2 NPs found to be spherical. There is some agglomeration also observed in image, which may be due to annealing of SnO2 NPs. Elemental analysis NPs was done by using energy dispersive spectrometer (EDS); the plot of spectrum is shown in Figure 3. Emission peaks such as O and Sn observed in the EDS spectrum shows the presence of tin and oxygen elements and confirmed the stoichiometry of NPs.
3.3. Photocatalytic (PC) Activity
For the purification of water from contaminants, catalytic approach plays a vital role, which is based on the feature that the SnO2 is able to photo-catalyze many organic
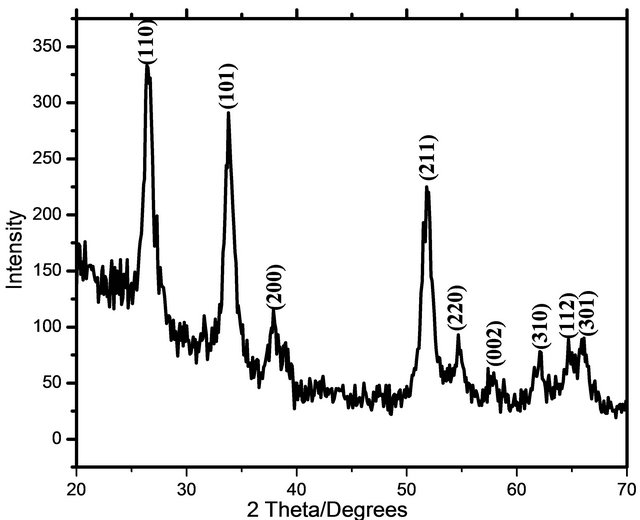
Figure 1. XRD spectra of air annealed SnO2 NPs.
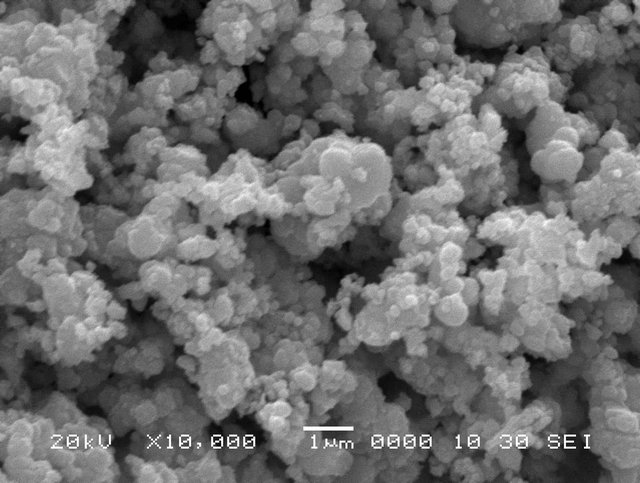
Figure 2. SEM of air annealed image of SnO2 NPs.
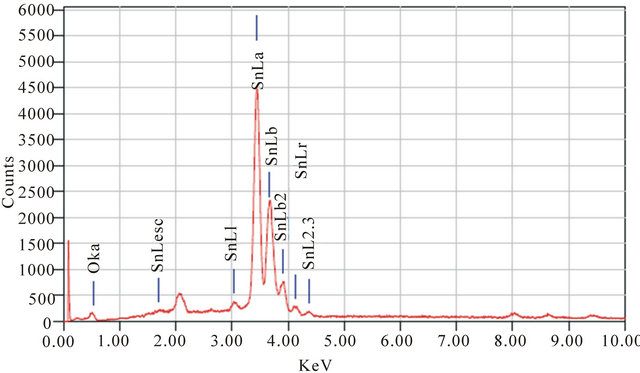
Figure 3. EDS of SnO2 NPs.
substances under UV irradiation (Hoda-Fujishima effect). Under normal atmospheric conditions and UV-Vis light, organic pollutants that are virulent and hard to be decomposed can be thoroughly oxidized to molecules, such as H2O and CO2 by using SnO2 under UV irradiation. PC reaction in the presence of SnO2 consists of a free radical reaction initiated by absorption of the photon with energy equal to or greater than the band gap of SnO2.
UV-Visible absorbance spectra for photodegradation of MB dye using SnO2 NPs is shown in Figure 4. From the plot it is observed that, as irradiation time increases, the concentration of MB dye decreases, which is shown by decrease in UV-absorbance spectra. It can be seen that the intensity of absorption peak gradually decreases with increasing UV irradiation time. The percentage efficiency of NPs was determined using Equation (2). The plot of percentage efficiency with irradiation time is shown in Figure 5 from which we can say that as irradiation time increases the efficiency of NPs to degrade MB dye also increases. The apparent rate constant for degradation of MB was determined using Equation (3). The plot of ln(Co/C) with irradiation time is shown in Figure 6 where the slopes represent apparent rate constant for degradation of MB dye which is 2.149 × 10⁻².
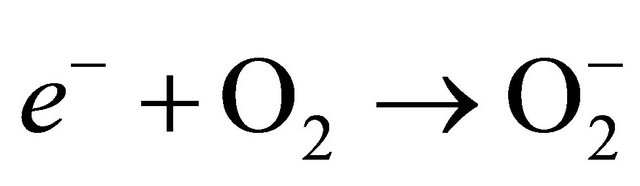
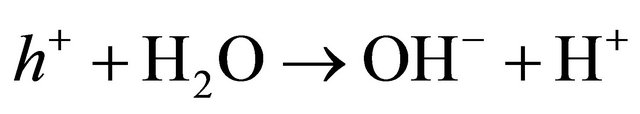
Mechanism for Photo-degradation of MB dye can be explained as follows. On illumination of catalyst surface with enough energy, leads to the formation of a hole (h+) in the valence band and an electron (e−) in the conduction band. The hole oxidizes either pollutant directly or water to produce OH− radicals, where as the electron in the conduction band reduces the oxygen adsorbed on the catalyst. The activation of SnO2 by UV light can be represented by the following steps.
 (5)
(5)
 (6)
(6)
In this reaction, h+ and e− are powerful oxidizing and
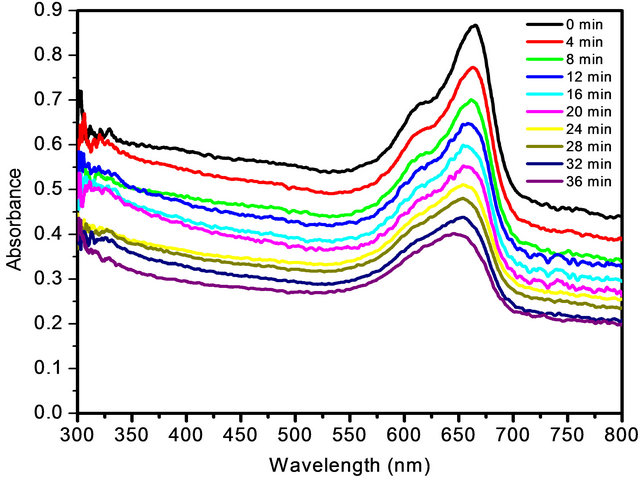
Figure 4. UV-Visible absorbance spectra for photodegradation of MB dye using SnO2 NPs.
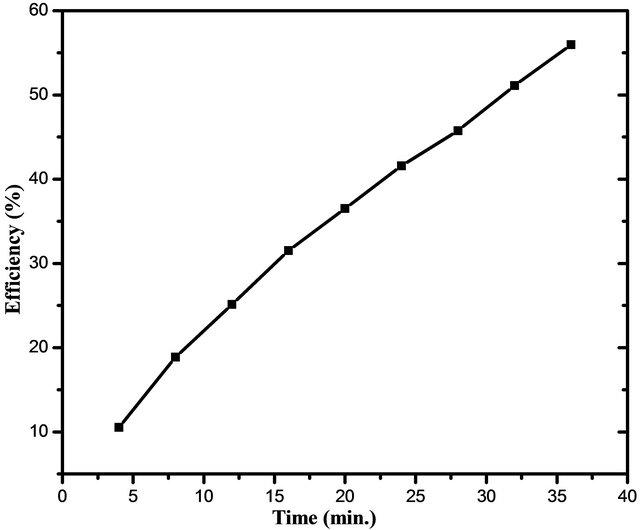
Figure 5. Efficiency (%) with irradiation time for photodegradation of MB dye using SnO2 NPs.
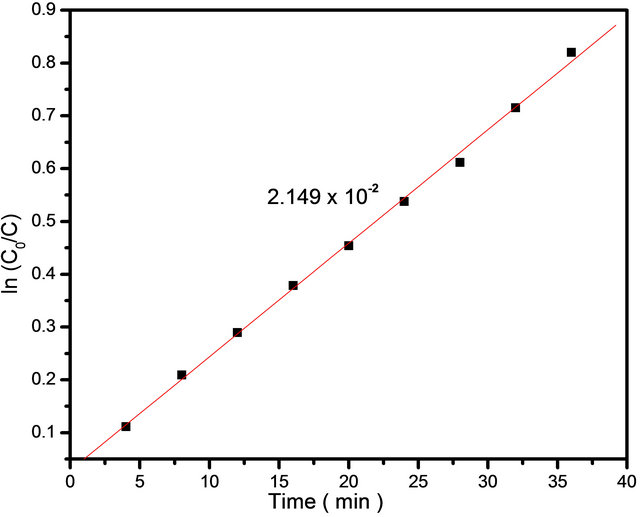
Figure 6. The plot of ln(Co/C) vs irradiation time for photodegradation of MG dye using SnO2 NPs.
reductive agents, respectively. The oxidative and reductive reaction steps are expressed as follows:
 (7)
(7)
 (8)
(8)
 (9)
(9)
4. Conclusion
In this study rapid synthesis of uniform size SnO2 NPs was achieved using microwave synthesis which is considered to be a green, efficient and cost effective method having potential for large scale synthesis of NPs. Photodegradation of MB dye was done using synthesized nanoparticles. SnO2 NPs shows efficient phtodegradation for less concentrated MB dye under UV light.
5. Acknowledgements
Authors are thankful to Vice Chancellor, Defence Institute of Advanced Technology, Girinagar, Pune-411025 (India) for granting permission to publish this work. Authors are also thankful to Dept. of Physics, University of Pune, Pune (India), for SEM, EDS and XRD of samples.
REFERENCES
- N. G. Deshpande, Y. G. Gudage, R. Sharma, J. C. Vyas, J. B. Kim and Y. P. Lee, “Studies on Tin Oxide-intercalated Polyaniline Nanocomposite for Ammonia Gas Sensing Applications,” Sensors and Actuators B: Chemical, Vol. 138, No. 1, 2009, pp. 76-84. doi:10.1016/j.snb.2009.02.012
- V. Krivetskiy, A. Ponzoni, E. Comini, S. Badalyan, M. Rumyantseva and A. Gaskov, “Selectivity Modification of SnO2-Based Materials for Gas Sensor Arrays,” Electroanalysis, Vol. 22, No. 23, 2010, pp. 2809-2816. doi:10.1002/elan.201000277
- H. J. Snaith and C. Ducati, “SnO2-Based Dye-Sensitized Hybrid Solar Cells Exhibiting Near Unity Absorbed Photon-to-Electron Conversion Efficiency,” Nano Letters, Vol. 10, No. 4, 2010, pp 1259-1265. doi:10.1021/nl903809r
- J. C. Manifacier, “Thin Metallic Oxides as Transparent Conductors,” Thin Solid Films, Vol. 90, No. 3, 1982, pp. 297-308. doi:10.1016/0040-6090(82)90381-9
- Y. Hao, W. Wu and L. L. Xie, “Preparation and Photocatalytic Properties of Nanometer SnO2,” 2nd International on Chemical, Biological and Environmental Engineering (ICBEE), Cairo, 2-4 November 2010, pp. 96-100.
- Q.-Q. Wang, B.-Z. Lin, B.-H. Xu, X.-L. Li, Z.-J. Chen and X.-T. Pian, “Preparation and Photocatalytic Properties of Mesoporous SnO2-Hexaniobate Layered Nanocomposite,” Microporous and Mesoporous Materials, Vol. 130, No. 1-3, 2010, pp. 344-351. doi:10.1016/j.micromeso.2009.11.033
- L. H. Zhang, P. J. Li, Z. Q. Gong and X. M. Li, “Photocatalytic Degradation of Polycyclic Aromatic Hydrocarbons on Soil Surfaces Using TiO2 Under UV Light,” Journal of Hazardous Materials, Vol. 158, No. 2-3, 2008, pp. 478-484. doi:10.1016/j.jhazmat.2008.01.119
- A. K. Singh, S. B. Patil and S. S. Multani, “ZnO Nanorods and Nanopolypods Synthesized Using Microwave Assisted Wet Chemical and Thermal Evaporation Method,” Indian Journal of Pure & Applied Physics, Vol. 49, 2011, pp. 270-276.
- A. K. Singh and V. S. Raykar, “Microwave Synthesis of Silver Nanofluids with Polyvinylpyrrolidone (PVP) and Their Transport Properties,” Colloid & Polymer Science, Vol. 286, No. 14-15, 2008, pp. 1667-1673. doi:10.1007/s00396-008-1932-9
- R. S. Varma, “Greener Approach to Nanomaterials and Their Sustainable Applications,” Current Opinion in Chemical Engineering, Vol. 1, No. 1, 2011, pp. 1-6.
- C. M. Sarah, S. K. Pillai, S. Sinha Ray, K. Jalama and R. W. M. Krause, “Recent Trends in the Microwave-Assisted Synthesis of Metal Oxide Nanoparticles Supported on Carbon Nanotubes and Their Applications,” Journal of Nanomaterials, 2012, Article ID: 691503.
- M. Nüchter, B. Ondruschka, W. Bonrath and A. Gum, “Microwave Assisted Synthesis—A Critical Technology Overview,” Green Chemistry, Vol. 6, No. 3, 2004, pp. 128- 141. doi:10.1039/b310502d
- S. Das, A. K. Mukhopadhyay, S. Datta and D. Basu, “Prospects of Microwave Processing: An Overview,” Bulletin of Materials Science, Vol. 32, No. 1, 2009, pp. 1-13. doi:10.1007/s12034-009-0001-4
- L. Perreux and A. Loupy, “A Tentative Rationalization of Microwave Effects in Organic Synthesis According to the Reaction Medium, and Mechanistic Considerations,” Tetrahedron, Vol. 57, No. 45, 2001, pp. 9199-9223. doi:10.1016/S0040-4020(01)00905-X
- H. Kumazawa, M. Inoue and T. Kasuya, “Photocatalytic Degradation of Volatile and Nonvolatile Organic Compounds on Titanium Dioxide Particles Using Fluidized Beds,” Industrial & Engineering Chemistry Research, Vol. 42, No. 14, 2003, pp. 3237-3244. doi:10.1021/ie020723m
- D. Hornero-Mendez and M. I. Minguez-Mosquera, “Rapid Spectrophotometric Determination of Red and Yellow Isochromic Carotenoid Fractions in Paprika and Red Pepper Oleoresins,” Journal of Agricultural and Food Chemistry, Vol. 49, No. 8, 2001, pp. 3584-3588. doi:10.1021/jf010400l
- J. G. Yu, H. G. Yu, B. Cheng, X. J. Zhao, J. C. Yu and W. K. Ho, “The Effect of Calcination Temperature on the Surface Microstructure and Photocatalytic Activity of TiO2 Thin Films Prepared by Liquid Phase Deposition,” Journal of Physical Chemistry B, Vol. 107, No. 50, 2003, pp. 13871-13879. doi:10.1021/jp036158y
- S. Ghasemi, S. Rahimnejad, S. R. Setayesh, S. Rohani and M. R. Gholami, “Transition Metal Ions Effect on the Properties and Photocatalytic Activity of Nanocrystalline TiO2 Prepared in an Ionic Liquid,” Journal of Hazardous Materials, Vol. 172, No. 2-3, 2009, pp. 1573-1578. doi:10.1016/j.jhazmat.2009.08.029
- B. D. Cullity, “Elements of X-Ray Diffraction,” AddisonWesley, Reading, 2005.
NOTES
*Corresponding author.