American Journal of Analytical Chemistry
Vol. 3 No. 1 (2012) , Article ID: 16809 , 9 pages DOI:10.4236/ajac.2012.31012
Liquid Chromatography-Tandem Mass Spectrometry Assay to Detect Ethyl Glucuronide in Human Fingernail: Comparison to Hair and Gender Differences
1United States Drug Testing Laboratories, Inc., Des Plaines, USA
2Center for Addiction and Behavioral Health Research, University of Wisconsin-Milwaukee, Milwaukee, USA
Email: joe.jones@usdtl.com
Received October 28, 2011; revised December 9, 2011; accepted December 18, 2011
Keywords: Alcohol; Biomarkers; Liquid Chromatography-Tandem Mass Spectrometry; LC-MS/MS; Ethyl Glucuronide; Fingernail; Hair
ABSTRACT
Over the past decade, the use of hair specimens for the long-term detection of the alcohol biomarker ethyl glucuronide has been increasing in popularity and usage. We evaluated the usefulness of fingernail clippings as a suitable alternative to hair for ethyl glucuronide detection. A liquid chromatography-tandem mass spectrometry method for the detection of ethyl glucuronide in fingernail clippings was fully validated and used to analyze the hair and/or fingernail specimens of 606 college-aged study participants. The limit of detection was 2 pg/mg, the limit of quantitation was 8 pg/mg and the method was linear from 8 to 2000 pg/mg. Intraand inter-assay imprecision studies at three different concentrations (20, 40, 200 pg/mg) were all within 7.8% and all intraand inter-assay bias studies at these levels were within 115.1% of target concentration. Ethyl glucuronide levels in fingernail (mean = 29.1 ± 55.6 pg/mg) were higher than ethyl glucuronide levels in hair (mean = 9.48 ± 22.3 pg/mg) and a correlation of the matched pairs was observed (r = 0.552, P < 0.01, n = 529). Evaluating each gender separately revealed that the correlation of male fingernail to male hair was large and significant (r = 0.782, P < 0.01, n = 195) while female hair to female fingernail was small yet significant (r = 0.249, P < 0.01, n = 334). The study results demonstrated that fingernail may be a suitable alternative to hair for ethyl glucuronide detection and may be the preferred sample type due to the lack of a gender bias.
1. Introduction
Alcohol abuse has been and continues to be a prevalent public health issue in our society. According to the National Epidemiologic Survey on Alcohol and Related Conditions (NESARC), the incidence of alcohol use disorder, risky drinking, maternal drinking and underage drinking are still increasing [1]. Alcohol abuse is an underlying cause for a number of public health issues such as liver disease, heart disease, cerebro-vascular disease, cancer, unintentional injury, and Fetal Alcohol Spectrum Disorders [2-4]. An objective, sensitive, specific and longerterm direct biomarker is needed to assist health care professionals in monitoring drinking behavior in environments such as substance abuse recovery programs, organ transplantation, chronic disease management, and perinatal care.
Traditionally, alcohol abuse screening has been performed using a number of self-administered questionnaires and indirect alcohol biomarkers. Questionnaires such as the Alcohol Use Disorders Identification Test (AUDIT) [5], the Michigan Alcohol Screening Test (MAST) [6], and the Fast Alcohol Screening Test (FAST) [7] may be problematic because of participant deception and recall bias [8]. Indirect alcohol biomarkers, such as gamma-glutamyl transferase (GGT), mean corpuscular volume (MCV) and carbohydrate-deficient transferrin (CDT) detect the effects of excessive alcohol consumption on various body organ functions but are also adversely affected by age, gender, organ pathology and pregnancy [9-11]. Direct alcohol biomarkers such as ethyl glucuronide (ETG) and fatty acid ethyl esters (FAEE) are advantageous because the original ethanol molecule is a moiety of the detected compound.
The detection of both FAEE and ETG in hair has been reported in the literature over the past 10 years as longterm markers to identify chronic alcohol abuse [12-15]. The Society of Hair Testing, an international group devoted to hair testing research, has recommended a cutoff of 30 pg/mg of ETG and 0.5 ng/mg FAEE as indicators of excessive alcohol consumption [16]. The widespread use of FAEE in hair has been limited, in part, because of reports of post-collection synthesis of FAEE following exposure to ethanol vapor [17] and reports of false positive FAEE following the use of popular ethanol containing cosmetic products [18]. Gareri et al. further reported that ETG was not detected in hair following external ethanol contamination [18] and a recent report demonstrated that hair bleaching adversely affects the detection of ETG [19].
Fingernail clippings have been utilized for the detection of drug and drug metabolites for over a decade [20- 24]. Fingernail, a layered partially crystalline keratinsed structure, originates at the fingernail matrix from specialized epidermal cells and grows along the nail bed at a rate of approximately 0.1 mm/day. Analytes are incorporated into the fingernail by blood flow in the nail matrix and blood flow from the nail bed underneath as the fingernail grows in length and thickness [25]. Together, these mechanisms allow for detection as recently as a few weeks ago and extending several months back.
To the best of our knowledge, reports describing the detection of ETG in human fingernail are lacking in the literature. We hypothesized that human fingernail is a suitable alternative to hair for the detection of ETG. The objective of this paper was twofold. First, we seek to present for the first time a fully validated LC-MS/MS procedure for the detection of ETG in human fingernail adapting, with minor modifications, previously published oral fluid and hair procedures [26,27]. Second, using this newly validated procedure, hair and fingernail specimens collected from a large group of college-aged participants were analyzed and compared.
2. Materials and Methods
2.1. Ethics Statement
The participants of this study provided written informed consent, received compensation for their cooperation, and the Western Institutional Review Board (Olympia, WA, USA) approved the research protocol (protocol 20091951).
2.2. Subjects
The Center for Addiction and Behavioral Health Research, a public/private consortium, located at the University of Wisconsin-Milwaukee, recruited 606 students aged 18 to 26 years old (373 females and 231 males). Hair and fingernail specimen collection procedures were initiated after the subjects provided informed consent to participate in the study. The hair specimen collection procedure instructed the study staff to cut approximately 200 strands of hair as close as possible to the scalp from the back of the head with a clean pair of scissors. The hair strands were aligned in a standard hair collection kit, taking note of the position of the root end of the specimen. The fingernail collection procedure requested that the participants clip the distal edges of all 10 digits as close as possible without injury to the hyponychium (the quick). The fingernail clippings were secured in a foil wrapper and the de-identified biological specimens were forwarded to United States Drug Testing Laboratories (Des Plaines, IL, USA) for analysis. The minimum amount of hair or fingernail specimen required for analysis was 10 mg.
2.3. Chemicals, Reagents and Materials
ETG and ETG-d5 were purchased from Cerilliant (Round Rock, TX, USA) as 100 μg/mL reference standards. Solid phase extraction (SPE) cartridges (CUQAX12Z— Quaternary Amine with chloride counter ion) with a 200- mg bed in a 10 mL reservoir were purchased from United Chemical Technologies (Bristol, PA, USA). All reagents were ACS grade and all solvents were HPLC grade and were purchased from Thermo-Fisher Scientific (Hanover Park, IL, USA).
2.4. Calibrator, Control and Internal Standard Spiking Solutions
A 20 ng/mL ETG calibrator spiking solution was prepared by appropriate dilution of a 100 μg/mL ETG reference standard with methanol. Using a different lot of 100 μg/mL ETG reference standard, a 20 ng/mL ETG control spike solution was prepared by the appropriate dilution with methanol. A 20 ng/mL ETG-d5 internal standard spiking solution was prepared by the appropriate dilution of the 100 μg/mL ETG-d5 reference standard with methanol. A single point calibrator was prepared by adding 50 μL of ETG calibrator spiking solution to 50 mg of certified negative nail powder in a labeled 13 × 100 mm-glass test tube. The negative, low (8 pg/mg), mid (25 pg/mg) and high (160 pg/mg) controls were prepared by the addition of 0, 20, 62.5, and 400 μL of ETG control spike solution to certified negative nail specimens (50 mg) in labeled 13 × 100 mm-glass test tubes, respectively. DI water (3 mL) was added to each calibrator and control.
2.5. Specimen Preparation
An accurately weighed portion between 10 - 50 mg of each fingernail specimen was carefully transferred to a labeled 2 mL polypropylene microvial fitted with a screw top cap and o-ring. Prior to analysis each specimen was subjected to an organic solvent decontamination step using hexane, methylene chloride and methanol to cover a broad range of solvent polarities. To each tube, 1 mL of hexane was added, agitated on a vortex mixer and the solvent removed with a Pasteur pipette. This procedure was repeated with methylene chloride and methanol. The uncapped vials were dried in an 80˚C vacuum oven until dry. To each calibrator, control and specimen, 50 μL of ETG internal standard spiking solution was added with vortex mixing. After the addition of 5 - 6 steel ball bearings (2 mm diameter) to each vial, the capped vials were placed in a Mini-Bead-Beater-8, a high energy cell disrupter (BioSpec Products, Bartlesville, OK, USA) for approximately 3 minutes or until powdered. The powdered specimens were transferred into a labeled 13 × 100 mm-glass test tube by rinsing the 2 mL microvial 3 times with 1 mL of DI water. The batch was allowed to incubate in a 40˚C sonicating water bath for 2 hours and then allowed to incubate at room temperature over night.
SPE cartridges were conditioned with methanol (2 mL) followed with 2 mL of DI water. The specimens were loaded onto the cartridges and allowed to flow under the force of gravity. The cartridges were rinsed with 2 mL of DI water followed by 2 mL of methanol and were dried by drawing air through the SPE cartridges using full vacuum for approximately 5 minutes. The ETG and ETG-d5 were eluted using 2 mL of 2% formic acid in methanol. The eluates were evaporated under a stream of nitrogen at 40˚C and reconstituted in 100 μL of DI water. The extracts were transferred to 2 mL autosampler vials that contained 250 μL conical inserts and forwarded to the LC-MS/MS laboratory for analysis.
2.6. LC-MS/MS Conditions
The specimens were analyzed using an Agilent Technologies 1200 system that consisted of a G1367D autosampler, a G1379B degasser, G1312B binary pump, and a G1310 isocratic pump (Wilmington, DE, USA). Separation was achieved using a Synergi Polar RP (50 mm × 2.0 mm, 2.5 mm particle size) C-18 column (Phenomenex, Torrence, CA, USA). The column was held at 30˚C in a G1316B Thermostatted Column Compartment (Wilmington, DE, USA). The solvent system was a gradient that consisted of A (0.1% formic acid) and B (acetonitrile), using a flow rate of 0.100 mL/min. The solvent program held B at 0% from 0.0 min to 1.0 min. Solvent B was increased to 1% between 1.0 min and 9.25 min. Solvent B was decreased to 0% at 9.25 min and held at 0% until 10.0 min.
The detector was an Agilent Technologies 6460 Triple Quad LC/MS System using electro-spray ionization (ESI) in the negative mode (Wilmington, DE, USA). The capillary voltage was set at 4000 V, the nozzle voltage set at 300 V and the desolvation gas (nitrogen) was heated to 350˚C with a flow of 10 L/min. The sheath gas (nitrogen) was heated to 350˚C and delivered at 11 l/min. The internal standard (ETG-d5) was monitored using the m/z 226.1 > 74.9 (quantification ion) transition and the m/z 226.1 > 85.2 (qualifying ion) transition. The m/z 221.1 > 74.9 (quantification ion) and m/z 221.1 > 85.0 (qualifying ion) transitions were used to monitor ETG. All three transitions used a fragmentor voltage of 100 V and collision energy of 12 V. All data were processed using Mass Hunter B.02.01 (Wilmington, DE, USA).
2.7. Identification Criteria
The identification criteria used for this procedure included four components: retention time, signal to noise, baseline resolution and relative ion intensity. The retention time of each analyte was required to be within 0.2 min of the retention time established by the single point calibrator. A signal to noise of greater than 3:1 was required of each ion chromatogram. A minimum of 90% return to baseline was required to consider a peak to be adequately resolved from a co-eluting peak. The relative ion intensity of the product ions for each analyte (mass ratio) was required to be within 20% of the corresponding relative ion intensity that was established by the single point calibrator.
2.8. Validation
The previously detailed method, a slightly modified version of previously published methods [26,27], was validated according to the recommendations of commonly accepted guidelines [28-31]. The following parameters were evaluated: limit of detection (LOD), limit of quantitation (LOQ), linear range, carryover potential, selectivity, bias, imprecision, extraction efficiency, matrix effect, stability of extracts on the autosampler, and stability of specimens during freeze-thaw conditions. Additionally, the potential of post-collection synthesis was assessed for specimens stored in the presence of ethanol vapor.
The LOD and LOQ were determined by analyzing a series of fortified controls in triplicate. The LOQ was the lowest point where the mean of the measured concentrations was within 20% of target value and satisfied all identification criteria. The LOD was the lowest triplicate that satisfied all identification criteria without consideration of the measured concentration. The concentrations assayed were 2, 4, 8, 10, and 20 pg/mg.
Linearity was determined by analyzing a series of fortified negative controls in replicates of five. Calibration curves were constructed using analyte/internal standard area response ratios. A weighted (1/x) least squares linear regression was used to mitigate heteroscedasticity. The concentrations tested were 8, 20, 40, 100, 200, 400, 500, and 2000 ng/mg. Each point was required to be within 15% of target with the exception of the LOQ (8 ng/mg) where 20% was allowed.
The potential for carryover was determined by analyzing a known negative control after a control containing 400 pg/mg. A successful carryover challenge must be less than the determined LOD.
Evaluating 6 negative controls spiked at 500 pg/mg with a cocktail of potentially interfering substances (Table 1) assessed the specificity of the assay. The results of the 6 controls must be less than the LOD of the assay. Analyzing 6 LOQ controls fortified at 500 pg/mg with a cocktail of potentially interfering compounds challenged the selectivity of the method. All 6 replicates must satisfy the identification criteria and the measured concentrations must be within 20% of target value.
Bias and imprecision were determined by analyzing prepared controls at three different concentrations, replicates of five over four different days. The concentrations investigated were 20, 100, and 200 pg/mg. The bias and imprecision challenge was considered to be successful if each intra-assay mean and the inter-assay mean was within 15% of target value and the maximum intraand inter-assay variance was less than 20%, respectively.
The relative matrix effect was determined using the procedure defined by Matuszewski [31], which entailed analysis of standard curves that utilized at least 5 different biological sources of fortified negative material. The relative matrix effect is defined as the precision (%CV) of the standard line slopes constructed from this analysis. The extraction efficiency was determined by comparing the mean area responses of 2 sets of extracted controls (target concentration = 160 pg/mg, n = 5) where set 1 was spiked prior to extraction and set 2 was spiked after elution from the SPE cartridge [30]. The efficiency of the recovery of ETG from the powder of authentic fingernail was evaluated by performing 3 successive extractions on the remaining residue of 3 specimens in duplicate.
The stability of prepared extracts was assessed by the re-analysis of a control set (20, 100, and 200 ng/mg) that had been stored at room temperature for five days. The stability was expressed as a ratio of the results of the incubated controls and the original measured concentrations. The stability of the fingernail specimens to freezethaw conditions was evaluated by subjecting five control sets (20, 100, and 200 ng/mg) to three daily freeze-thaw cycles. Freeze-thaw stability was expressed as a ratio of the observed means versus the respective target concentration.
A concern with the use of ethanol biomarkers is the possibility of post-collection synthesis when specimens have been exposed to or contaminated with ethanol [17, 18,32-35]. Inadvertent contamination with ethanol such as Purell® or gasoline additives should be expected in real world samplings. To eliminate this concern, we examined negative controls, which were stored at room
Table 1. Cocktail of 86 potentially interfering substances.
temperature in an airtight 1000 mL beaker containing an open 10 mL vial of ethanol.
2.9. Statistical Analysis
Statistical analysis was performed using IBM® SPSS® Statistics version 19.0.0. Pearson correlations were used to evaluate the associations of hair ETG and nail ETG concentrations with and without controlling for gender. Paired-sample t-test (t) was used to compare the means of ETG concentrations in hair and fingernails of men and women. A probability of P < 0.01 was considered to be significant.
3. Results
The parameters for the chromatography and mass spectrometry were consistent with previous reports [14,36]. The transitions described previously proved to be clean and stable throughout the validation process. The number of identification points for ETG was 4, satisfying the commonly accepted recommendation of at least 3 identification points [29]. Extracted ion chromatograms of an 8-pg/mg LOQ control of ETG are presented in Figure 1.
The determined LOD for this method was 2 pg/mg. The method allowed for the proper identification of ETG for the 20, 10, 8, 4 and 2 pg/mg controls. However, the mean of the measured concentrations of 4 and 2 controls were outside the required 20% range. The LOQ for this assay was 8 pg/mg. All identification criteria and quantitation criteria for the 8.0 pg/mg controls were acceptable with a mean concentration of 8.3 pg/mg and %CV of 2.6%.
Linearity of the method was assessed by replicate analysis (n = 5) of negative fingernail fortified at 8, 20, 40, 100, 200, 400, 500, and 2000 pg/mg. Standard lines were constructed using a 1/x weighted linear regression. The assessment yielded a mean slope of 1.84 × 10⁻² ± 2.75 × 10⁻⁴ and an intercept of 8.37 × 10⁻² ± 1.06 × 10⁻². The mean coefficient of determination (r2) was 0.9967 ± 0.0018. All points were within 15% of target value.
ETG was not detected (<LOD) in a negative control analyzed immediately following a control fortified with 400 pg/mg of ETG. The potential for carryover at 400 pg/mg of ETG was acceptable. Based on these findings, any specimen that followed a specimen with an oncolumn value greater than 400 pg/mg was reanalyzed following a clean solvent injection.
Negative controls spiked with 500 pg/mg of 86 potentially interfering compounds (Table 1) did not exhibit any detectable ETG at or above the reported LOD. The selectivity of the method proved to be adequate by successful analysis of 6 LOQ controls prepared from negative control that were spiked with 500 pg/mg of 97 potentially interfering compounds. The mean of the 6 LOQ controls was 8.3 pg/mg and the %CV was 2.6%.
The bias and imprecision of the method proved to be acceptable. The results are listed in Table 2. All intraand inter-assay bias determinations were within 15.1% of target concentration. All intraand inter-assay imprecision calculations were less than 7.8%.
The relative matrix effect was determined over 5 concentrations, replicates of 8, from 8 different biological sources. Standard lines were constructed using analyte/ internal standard area response ratios. The precision of the standard line slopes was calculated (relative matrix effect) to be 4.4%. The determined extraction efficiency (ratio of mean area responses of pre-extraction spiked and post-extraction spiked controls) was 95.2%. The mean recovery of ETG from authentic fingernail powder was 90.9% on the first extraction, 6.4% on the second extraction and 2.7% on the third extraction.
Re-injection of 20, 100 and 200 pg/mg controls after incubating 4 days at room temperature did not demonstrate any obvious degradation. The results ranged from 96.4% to 105.3% of the original measured concentrations.
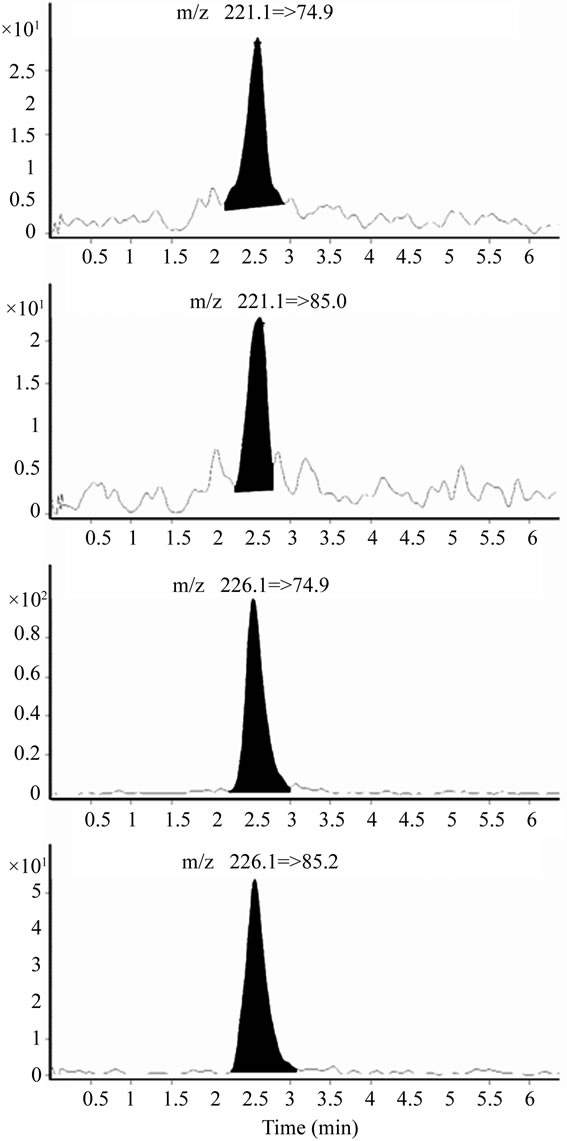
Figure 1. Multiple reaction monitoring (MRM) chromatograms of ETG and ETG-d5 for a control fortified to be at the LOQ (8 pg/mg).
The 5 control sets subjected to 3 freeze-thaw cycles proved to be stable. The %Target values ranged from 95.6% to 101.8%. All 5 specimens exposed to ethanol vapor for 3 days at room temperature did not demonstrate any detectable ETG.
Authentic Specimens
The racial distribution of the study participants was 492 (81.5%) White, 33 (5.4%) African-American, 30 (4.9%) Asian, 28 (4.6%) Hispanic, 10 (1.7%) American Indian/ Alaskan Native, 1 (0.2%) Native Hawaiian/Pacific Islander, and 10 (1.7%) other. One subject self reported an age of 16 years and was removed from the study. Of the remaining 605 consented participants, 570 hair speci-
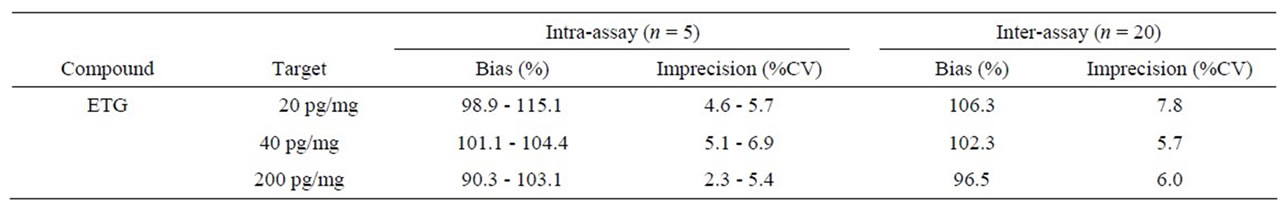
Table 2. Bias and imprecision of ETG in nails.
mens (359 female and 211 male) and 561 fingernail specimens (349 female and 212 male) were collected. The ETG hair result of one female participant was absurdly high (>700 ng/mg) with an insufficient quantity of specimen available for re-analysis. This female subject was removed from the study. Of the remaining 604 participants, there were 529 matched pairs of hair and fingernail specimens (334 female and 195 male), 40 subjects with only a hair specimen (24 female and 16 male), 31 subjects with only a fingernail specimen (14 female and 17 male), and 4 subjects did not provide any adequate biological specimen (1 female and 3 male).
Of the 529 matched pairs, there were 187 (35.3%) hair specimens and 203 (38.3%) fingernail specimens with detectable concentrations of ETG. Hair concentrations ranged from <LOD to 180 pg/mg (mean = 9.48 ± 22.3 pg/mg) and fingernail concentrations ranged from < LOD to 397 pg/mg (mean = 29.1 ± 55.6 pg/mg). A comparison of means using a paired-sample t-test demonstrated a mean difference of 19.6 ± 47.1 pg/mg (t = 9.57, df = 528, P < 0.01) and was significant.
The mean ETG concentration in the fingernails of the male participants was 35.2 ± 60.9 pg/mg and 17.4 ± 32.6 pg/mg in the male hair (t = 6.08, df = 194, P < 0.01). The mean ETG concentration in the fingernails of the female participants was 25.51 ± 52.0 pg/mg and the mean concentration of ETG found in the hair of female participants was 4.85 ± 10.4 pg/mg (t = 7.48, df = 333, P < 0.01).
The Pearson product-moment correlation coefficient (r) of the matched pairs was 0.5523 (P < 0.01, n = 529), a medium positive correlation and the correlation was significant. The Pearson coefficient comparing the hair and fingernails of the male participants was 0.782 (P < 0.01, n = 195), a strong positive correlation and the correlation was significant. The Pearson coefficient comparing the hair and fingernails of the female participants was 0.249 (P < 0.01, n = 334), a weaker positive but yet significant correlation.
4. Discussion
This study, for the first time, presented a fully validated method for the detection of ETG in human fingernail clippings. In this study, we also investigated whether human fingernail clippings could be a suitable alternative to hair for the routine determination of the direct alcohol biomarker ETG. The validated method was utilized to compare the detection of ETG in fingernail clippings and head hair by collecting and analyzing 529 matched pairs from a college-aged population. Our data demonstrated that fingernail was not only a suitable alternative to hair clippings for the detection of ETG, but further suggested that fingernail may be the preferred specimen type for the detection of ETG.
This study found that ETG concentrations were significantly higher in fingernail specimens compared to matching hair specimens and exposure of nail to ethanol vapor did not produce ETG in vitro. The mean concentration of ETG in matched fingernail and hair specimens was 29.1 and 9.48 pg/mg, respectively. The higher concentrations of ETG in fingernail contributed to a slightly improved detection of ETG in fingernail (38.3%) compared to hair (35.3%). Our findings for the concentrations of ETG in hair are consistent with those of previously published studies [8,13,14,34-38]. The failure of nail to produce ETG in vitro was consistent with recent reports which demonstrated that ethanol containing products did not contribute to ETG hair levels [35].
Hair color, which is caused by the presence of various melanins, is a significant source of variation for the detection of alkaline drugs in hair. Due to the slightly acidic nature of ETG, ETG hair concentrations are not influenced by natural variation of hair color [12]. Therefore, the significant increase of ETG concentrations in fingernail compared to hair may be attributed to the slower growth rate of fingernail compared to hair and once incorporated, an increased diffusion distance for ETG in fingernail compared to hair.
The correlation of matched fingernail and hair ETG concentration for males was much higher (r = 0.782, P < 0.01) than the correlation for female matched pairs (r = 0.249, P < 0.01), suggesting a gender bias (Figures 2 and 3). The reported concentrations of ETG in female hair were notably less than the ETG found in male hair.
A recent report demonstrated that hair ETG determinations were affected by exposure to varying amounts of hydrogen peroxide and ammonium hydroxide, which are common constituents of cosmetic hair treatments [19]. A higher frequency of hair care treatment among the female participants may be one explanation for the diminished ETG concentrations in female hair and the weak corre-
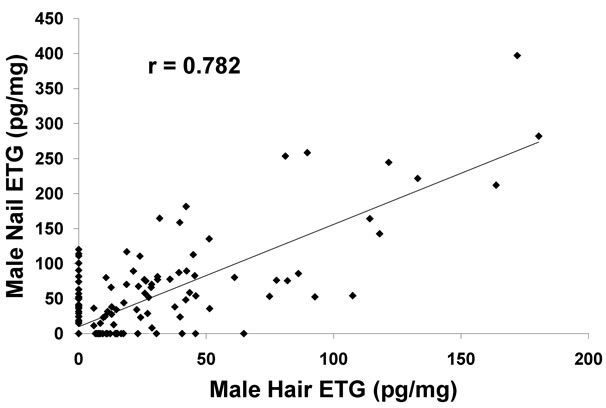
Figure 2. Comparison of results of ETG in male hair and male nails. A very strong correlation (r = 0.782) was observed for ETG in male hair versus male nails.
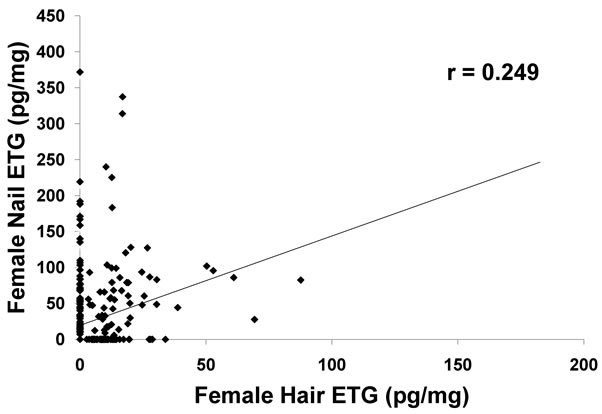
Figure 3. Comparison of results of ETG in female hair and female nails. A weak correlation (r = 0.249) was observed for ETG concentrations in female hair and nails.
lation between female ETG hair and fingernail. The higher concentrations of ETG in fingernail and the observed gender bias of hair ETG suggested that fingernail may be the preferred specimen type for long-term ETG detection.
Limitations of the study include a narrow age range of the participants, the lack of detailed information concerning cosmetic treatment, an evaluation of the effect of ETG containing cosmetic products, and the comparison of ETG levels in hair and fingernail to the actual amount of alcohol consumed. The participants ranged from 18 to 26 with over half of the participants being 21 to 22 years old. Various hair care treatments are not obvious to the untrained technician. Objective cosmetic treatment information would have allowed assessment for exposure to hydrogen peroxide and ammonium hydroxide. A recent report indicated that at least one unidentified commercially available hair lotion was contaminated with ETG and was responsible for a positive hair ETG result [34]. Further studies are required to determine if ETG contaminated products may influence ETG nail measurements. Lastly, further studies that include self-reported alcohol use or controlled dosing are needed to evaluate the performance of this assay.
5. Conclusion
This study concludes that fingernail clippings may be a suitable alternative to hair for monitoring the direct alcohol biomarker ETG. The data indicate that fingernail may be the preferred specimen because of higher concentrations present and the lack of a gender bias. Over the past decade, the identification of individuals engaged in risky alcohol drinking behavior using ETG detection in urine and hair has gained recognition as a reliable long-term direct alcohol biomarker. The ETG fingernail assay will be an additional analytical tool to detect risky alcohol drinking behavior in a number of venues such as substance abuse treatment monitoring, maternal abstinence monitoring, alcohol-confounded chronic disease management, and preand post-organ transplant monitoring.
6. Acknowledgements
This work was sponsored by the National Institute on Alcohol Abuse and Alcoholism (NIAAA) grant R 44 AA016463. The funders had no role in study design, data collection and analysis, decision to publish, or preparation of the manuscript. The authors would like to thank the staff of the Center for Behavioral and Addiction Research-University of Wisconsin-Milwaukee for their efforts to obtain the specimens for this study.
REFERENCES
- National Institute on Alcohol Abuse and Alcoholism, “National Epidemiologic Survey on Alcohol and Related Conditions,” Alcohol Alert, Vol. 70, 2006, pp. 1-6.
- K. L. Jones, D. W. Smith, C. H. Ulleland and A. P. Streissguth, “Pattern of Malformation in Offspring of Chronic Alcoholic Mothers,” Lancet, Vol. 301, No. 7815, 1973, pp. 1267-1271. doi:10.1016/S0140-6736(73)91291-9
- K. Pass and G. Mizejewski, “Is It Time for Newborn Screening for Fetal Alcohol Spectrum Disorders: A Commentary,” Journal of Pediatric Sciences, Vol. I, 2009, pp. e5. http://www.pediatricsciences.com/ojs/
- National Institute on Alcohol Abuse and Alcoholism. “Beyond Hangovers: Understanding Alcohol’s Impact on Your Health,” NIH Publication Number 10-7604, National Institutes of Health, Rockville, 2010.
- T. Babor, J. de la Furente, J. Saunders and M. Grant, “The Alcohol Use Disorders Identification Test: Guidelines for Use in Primary Health Care,” World Health Organization, Geneva, 1992.
- M. Selzer, “The Michigan Alcoholism Screening Test: The quest for a New Diagnostic Instrument,” American Journal of Psychiatry, Vol. 127, No. 12, 1971, pp. 1653- 1658.
- R. Hodgson, T. Alwyn, B. John, B. Thom and A. Smith, “The Fast Alcohol Screening Test,” Alcohol and Alcohol ism, Vol. 37, No. 1, 2002, pp. 61-66. doi:10.1093/alcalc/37.1.61
- P. Marques, S. Tippetts, J. Allen, M. Javors, C. Al-ling, M. Yegles, F. Pragst and F. Wurst, “Estimating Driver Risk Using Alcohol Biomarkers, Interlock Blood Alcohol Concentration Tests and Psychometric Assessments: Initial Descriptives,” Addiction, Vol. 105, 2010, pp. 226-239. doi:10.1111/j.1360-0443.2009.02738.x
- F. Wurst, C. Kempter, S. Seidl and A. Alt, “Ethyl Glucuronide—A Marker of Alcohol Consumption and a Relapse Marker with Clinical and Forensic Implications,” Alcohol and Alcoholism, Vol. 34, No. 1, 1999, pp. 71-77. doi:10.1093/alcalc/34.1.71
- G. Skipper, W. Weinmann, A. Thierauf, P. Schaefer, G. Wiesbeck J. Allen, M. Miller and F. Wurst, “Ethyl Glucuronide: A Biomarker to Identify Alcohol Use by Health Professionals Recovering from Substance Use Disorders,” Alcohol and Alcoholism, Vol. 39, No. 5, 2004, pp. 445-449. doi:10.1093/alcalc/agh078
- R. Litten, A. Bradley and H. Moss, “Alcohol Bio-Markers in Applied Settings: Recent Advances and Future Research Opportunities,” Alcoholism: Clinical and Experimental Research, Vol. 34, No. 6, 2010, pp. 955-967. doi:10.1111/j.1530-0277.2010.01170.x
- G. Skopp, G. Schmiitt, L. Potsch, P. Dronner, R. Adderjan and R. Mattern, “Ethyl Glucronide in Human Hair,” Alcohol and Alcoholism, Vol. 35, No. 3, 2000, pp. 283- 285. doi:10.1093/alcalc/35.3.283
- C. Jurado, “Diagnosis of Chronic Alcohol Consumption: Hair Analysis for Ethyl Glucuronide,” Forensic Science International, Vol. 145, No. 2-3, 2004, pp. 161-166. doi:10.1016/j.forsciint.2004.04.031
- M. Yegles, “Comparison of Ethyl Glucuronide and Fatty Acid Ethyl Ester Concentrations in Hair of Alcoholics, Social Drinkers and Teetotallers,” Forensic Science International, Vol. 145, No. 2-3, 2004, pp. 167-173. doi:10.1016/j.forsciint.2004.04.032
- F. Pragst, M. Rothe, B. Moench, M. Hastedt, S. Herre and D. Simmert, “Combined Use of Fatty Acid Ethyl Esters and Ethyl Glucuronide in Hair for Diagnosis of Alcohol Abuse: Interpretation and Advantages,” Forensic Science International, Vol. 196, No. 1-3, 2010, pp. 101-110. doi:10.1016/j.forsciint.2009.12.028
- Society of Hair Testing, “Consensus of the Society of Hair Testing on Hair Testing for Chronic Excessive Alcohol Consumption 2011,” 2011. http://soht.org/
- S. Hartwig, V. Auwarter and F. Pragst, “Effect of Hair Care and Hair Cosmetics on the Concentrations of Fatty Acid Ethyl Esters in Hair as Markers of Chronically Elevated Alcohol Consumption,” Forensic Science International, Vol. 131, 2003, pp. 90-97. doi:10.1016/S0379-0738(02)00412-7
- J. Gareri, B. Appenzeller, P. Walasek and G. Koren, “Impact of Hair-Care Products on FAEE Hair Concentration in Substance Abuse Monitoring,” Analytical and Bioanalytical Chemistry, Vol. 400, No. 1, 2011, pp. 183- 188. doi:10.1007/s00216-011-4685-0
- L. Morini, A. Zucchella, A. Polettini, P. Lucia and A. Groppi, “Effect of Bleaching on Ethyl Glucuronide in Hair: An in Vitro Experiment,” Forensic Science International, Vol. 198, No. 1, 2010, pp. 23-27. doi:10.1016/j.forsciint.2009.11.005
- G. Skopp and L. Pötsch, “Drug Screening of Nail Clippings to Detect Prenatal Drug Exposure,” Therapeutic Drug Monitoring, Vol. 19, No. 4, 1997, pp. 386-389. doi:10.1097/00007691-199708000-00004
- N. Lemos, R. Anderson and J. Robertson, “Nail Analysis for Drugs of Abuse: Extraction and Determination of Cannabis in Fingernails by RIA and GC-MS,” Journal of Analytical Toxicology, Vol. 23, No. 3, 1999, pp. 147-152.
- M. Cingolani, S. Scavella, R. Mencarelli, D. Mirtella, R. Froldi and D. Rodriguez, “Simultaneous Detection and Quantitation of Morphine, 6-Acetylmorphine, and Cocaine in Toenails: Comparison with Hair Analysis,” Journal of Analytical Toxicology, Vol. 28, No. 2, 2004, pp. 128-131.
- J. Jenkins and D. A. Engelhart, “Phencyclidine Detection in Nails,” Journal of Analytical Toxicology, Vol. 30, No. 8, 2006, pp. 643-644.
- S. Valentecampos, M. Yonamine, R. Moreau and O. Silva, “Validation of a Method to Detect Cocaine and Its Metabolites in Nails by Gas Chromatography-Mass Spectrometry,” Forensic Science International, Vol. 159, No. 2-3, 2006, pp. 218-222. doi: 10.1016/j.forsciint.2005.07.021
- A. Palmeri, S. Pichini, R. Pacifici, P. Zuccaro and A. Lopez, “Drugs in Nails: Physiology, Pharmacokinetics and Forensic Toxicology,” Clinical Pharmacokinetics, Vol. 38, No. 2, 2000, pp. 95-110. doi:10.2165/00003088-200038020-00001
- S. Hegstad, L. Johnsen, J. Morland and A. Christophersen, “Determination of Ethylglucuronide in Oral Fluid by Utra-Performance Liquid Chromatography-Tandem Mass Spectrometry,” Journal of Analytical Toxicology, Vol. 33, No. 4, 2009, pp. 204-207.
- L. Morini, L. Politi, A. Groppi, C. Stramesi and A. Polettini, “Determination of Ethyl Glucuronide in Hair Samples by Liquid Chromatography/Electro-Spray Tandem Mass Spectrometry,” Journal of Mass Spectrometry, Vol. 41, No. 1, 2006, pp. 34-42. doi:10.1002/jms.943
- Food and Drug Administration, Center for Drug Evaluation Research, Center for Veterinary Medicine. “Guidance for Industry: Bioanalytical Method Validation,” 2001. http://www.fda.gov/downloads/Drugs/GuidanceComplianceRegulatoryInformation/Guidances/ucm 070107.pdf
- Official Journal of the European communities L, Vol. 221, 2002, p. 8.
- B. Matuszewski, M. Constanzer and C. Chavez-Eng, “Strategies for the Assessment of Matrix Effect in Quantitative Bioanalytical Methods Based on HPLC-MS/MS,” Analytical Chemistry, Vol. 75, No. 13, 2003, pp. 3019- 3030. doi:10.1021/ac020361s
- B. Matuszewski, “Standard Line Slopes as a Measure of a Relative Matrix Effect in Quantitative HPLC-MS Bioanalysis,” Journal of Chromatography B, Vol. 830, No. 2, 2006, pp. 293-300. doi:10.1016/j.jchromb.2005.11.009
- N. De Giovanni, G. Donadio and M. Chiarotti, “Ethanol Contamination Leads to Fatty Acid Ethyl Esters in Hair Samples,” Journal of Analytical Toxicology, Vol. 32, No. 2, 2008, pp. 156-159.
- A. Helander, I. Olsson and H. Dahl, “Postcollection Synthesis of Ethyl Glucuronide by Bacteria in Urine May Cause False Identification of Alcohol Consumption,” Clinical Chemistry, Vol. 53, No. 10, 2007, pp. 1-3. doi:10.1373/clinchem.2007.089482
- F. Sporkert, H. Kharbouche, M. Augsburger, C. Klemm and M. Baumgartner, “Positive EtG Findings in Hair as a Result of a Cosmetic Treatment,” Forensic Science International, 2011, Ahead of Print, doi:10.1016/j.forsciint.2011.10.009
- L. Ferreira, T. Binz and M. Yegles, “The Influence of Ethanol Containing Cosmetics on Ethyl Glucuronide Concentration in Hair,” Forensic Science International, 2011, Ahead of Print. doi: 10.1016/j.forsciint.2011.10.015
- J. Janda, W. Weinmann, T. Kuehnle, M. Lahode and A. Alt, “Determination of Ethyl Glucuronide in Human Hair by SPE and LC-MS-MS,” Forensic Science International, Vol. 128, No. 1, 2002, pp. 59-65. doi:10.1016/S0379-0738(02)00163-9
- R. Krondstrand, L. Brinkhagen and F. Nystrom, “Ethyl Glucuronide in Human Hair after Daily Consumption of 16 or 32 g of Ethanol for 3 Months,” Forensic Science International, 2011, Ahead of Print. doi:10.1016/j.forsciint.2011.01.044
- L. Politi, L. Morini, F. Leone and A. Polettini, “Ethyl Glucuronide in Hair: Is It a Reliable Marker of Chronic High Levels of Alcohol Consumption?” Addiction, Vol. 101, No. 10, 2006, pp. 1408-1412. doi:10.1111/j.1360-0443.2006.01537.x