Paper Menu >>
Journal Menu >>
 Vol.2, No.1, 45-50 (2010) doi:10.4236/health.2010.21008 SciRes Copyright © 2010 Openly accessible at http://www.scirp.org/journal/HEALTH/ Health The effect of high fat food on erythrocyte phospholipids, fatty acids composition and glutathione redox-system of rats with alimentary dyslipidemia Tatyana P. Novgorodtseva1, Yulia K. Karaman1, Natalia V. Zhukova2 1Institute of Medical Climatology and Rehabilitative Treatment SB RAMS, Vladivostok, Russia; karaman@inbox.ru 2Institute of marine biology of name A.V. Zhirmunskogo FEB RAS, Vladivostok, Russia Received 6 November 2009; revised 7 December 2009; accepted 9 December 2009. ABSTRACT To evaluate the effects of high fat food consisted of tallow (19% of total diets) and cholesterol (2%) on modification of erythrocyte phospholipids, fatty acids composition and glutathione redox- system of male Wistar rats with alimentary dysli- pidemia. The results demonstrated that after 30 and 180 days of high-fat feed erythrocyte phos- phatidylinositol and phosphatidylcholine levels were reduced, phosphatidylserine were in- creased. Only on the 90 days of the experiment phosphatidylinositol level increased. In all grow- ups the erythrocyte 18:0 saturated fatty acids and 20:4n6, 22:4n6 polyunsaturated fatty acids (PUFA) were increased. Deficit of n3 PUFA- 20:5n3 and 22:6n3 after 90 and 180 days high fat feed promoted compensatory synthesis from 18:1n9 on 20:3n9. Erythrocyte maleic dialde- hyde increased, glutathione level decreased in all groups of rats after fed with high-fat feed. Glutathione reductase and glutathione peroxi- dase activity decreased in erythrocytes after 30 and 180 days of high-fat feed. In conclusion: high-fat diet during 30-90 days started adaptive answer in lipids of membrane and glutathione redox-system. Important mechanism of adapta- tion of a cellular membrane to high-fat diet is increase major, structuring a membrane phos- phatidylethanolamine and minor, most meta- bolic significant fractions phospholipids (phos- phatidylinositol), keeps homeostasis of 18:2n6 and 22:6n3, 20:3n9 compensatory synthesis, decrease in activity of processes lipid peroxi- dation, activation of enzymes of redox-system glutathione. But prolonging the high-fat feeding (180 days and more) formed failure compensa- tory processes (dysadaptation). It is a risk factor of developmening atherosclerosis, diabetes, steatogepatitis and other diseases. Keywords: Fatty Acids; Phospholipids; Adaptation; Dyslipidemia; GSH; Glutathione Reductase; Glutathione Peroxidase 1. INTRODUCTION Clinical, experimental and epidemiological researches have proved that the high-fat feeding is a risk factor of development of atherosclerosis, diabetes, steatogepatitis and other diseases [1-4]. Insufficient or superfluous con- sumption of separate components of food (deficiency of fiber, surplus of fat, carbohydrates etc.) at the initial stages forms the cascade of the stressful reactions di- rected on activation of mechanisms of adaptation in an organism. In cellular processes of adaptation one of leading roles is occupied with a plasma membrane and forming it phospholipids (PL) and fatty acid composition [5,6]. The fatty acid composition of phospholipids affects the phys- icochemical properties of the membrane and thus influ- ences conformation and function of membrane-bound proteins, such as receptors, ion channels, and transporters and also influences cell function by serving as precursors for prostaglandins and other signaling molecules and modulating gene expression through the activation of transcription factors [7-9]. Thanks to ability PL transform each other and also to be redistributed in a membrane between an internal and external layer realize important adaptable mechanism supporting the structural organiza- tion and functional properties of a plasma membrane [10] is carried out. The lipid peroxidation initiate modification membrane PL and it fatty acid composition. The impor- tant role in realization antioxidant protection from lipid peroxidation is played by glutathione redox-system which regulation of NF κβ (nuclear factor-κβ), ARE (antioxidant response element) [11-14]. The urgent fast adaptive answer of glutathione redox-system, consisting of activation of enzymes glutathione reductase, glu- 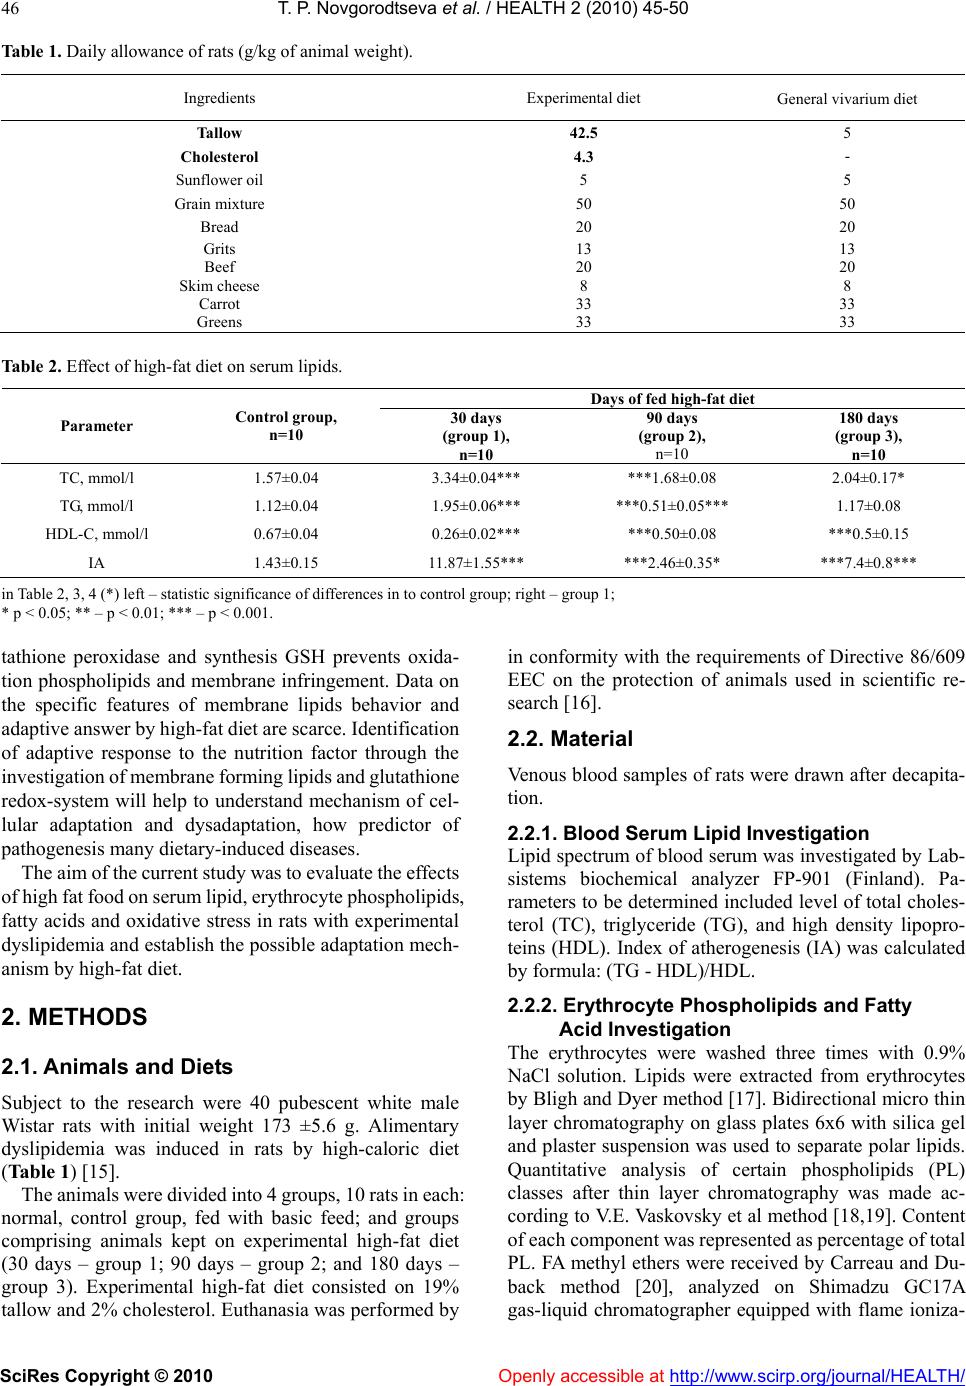 T. P. Novgorodtseva et al. / HEALTH 2 (2010) 45-50 SciRes Copyright © 2010 Openly accessible at http://www.scirp.org/journal/HEALTH/ 46 Table 1. Daily allowance of rats (g/kg of animal weight). Ingredients Experimental diet General vivarium diet Tallow 42.5 5 Cholesterol 4.3 - Sunflower oil 5 5 Grain mixture 50 50 Bread 20 20 Grits 13 13 Beef 20 20 Skim cheese 8 8 Carrot 33 33 Greens 33 33 Table 2. Effect of high-fat diet on serum lipids. Days of fed high-fat diet Parameter Control group, n=10 30 days (group 1), n=10 90 days (group 2), n=10 180 days (group 3), n=10 TC, mmol/l 1.57±0.04 3.34±0.04*** ***1.68±0.08 2.04±0.17* TG, mmol/l 1.12±0.04 1.95±0.06*** ***0.51±0.05*** 1.17±0.08 HDL-C, mmol/l 0.67±0.04 0.26±0.02*** ***0.50±0.08 ***0.5±0.15 IA 1.43±0.15 11.87±1.55*** ***2.46±0.35* ***7.4±0.8*** in Table 2, 3, 4 (*) left – statistic significance of differences in to control group; right – group 1; * р < 0.05; ** – р < 0.01; *** – р < 0.001. tathione peroxidase and synthesis GSH prevents oxida- tion phospholipids and membrane infringement. Data on the specific features of membrane lipids behavior and adaptive answer by high-fat diet are scarce. Identification of adaptive response to the nutrition factor through the investigation of membrane forming lipids and glutathione redox-system will help to understand mechanism of cel- lular adaptation and dysadaptation, how predictor of pathogenesis many dietary-induced diseases. The aim of the current study was to evaluate the effects of high fat food on serum lipid, erythrocyte phospholipids, fatty acids and oxidative stress in rats with experimental dyslipidemia and establish the possible adaptation mech- anism by high-fat diet. 2. METHODS 2.1. Animals and Diets Subject to the research were 40 pubescent white male Wistar rats with initial weight 173 ±5.6 g. Alimentary dyslipidemia was induced in rats by high-caloric diet (Table 1) [15]. The animals were divided into 4 groups, 10 rats in each: normal, control group, fed with basic feed; and groups comprising animals kept on experimental high-fat diet (30 days – group 1; 90 days – group 2; and 180 days – group 3). Experimental high-fat diet consisted on 19% tallow and 2% cholesterol. Euthanasia was performed by in conformity with the requirements of Directive 86/609 EEC on the protection of animals used in scientific re- search [16]. 2.2. Material Venous blood samples of rats were drawn after decapita- tion. 2.2.1. Blood Serum Lipid Investigation Lipid spectrum of blood serum was investigated by Lab- sistems biochemical analyzer FP-901 (Finland). Pa- rameters to be determined included level of total choles- terol (TC), triglyceride (TG), and high density lipopro- teins (HDL). Index of atherogenesis (IA) was calculated by formula: (TG - HDL)/HDL. 2.2.2. Erythrocyte Phospholipids and Fatty Acid Investigation The erythrocytes were washed three times with 0.9% NaCl solution. Lipids were extracted from erythrocytes by Bligh and Dyer method [17]. Bidirectional micro thin layer chromatography on glass plates 6x6 with silica gel and plaster suspension was used to separate polar lipids. Quantitative analysis of certain phospholipids (PL) classes after thin layer chromatography was made ac- cording to V.E. Vaskovsky et al method [18,19]. Content of each component was represented as percentage of total PL. FA methyl ethers were received by Carreau and Du- back method [20], analyzed on Shimadzu GC17A gas-liquid chromatographer equipped with flame ioniza-  T. P. Novgorodtseva et al. / HEALTH 2 (2010) 45-50 SciRes Copyright © 2010 Openly accessible at http://www.scirp.org/journal/HEALTH/ 47 tion detector and capillary column (0.25 mm х 30 m) with implanted phase Supelcowax 10. Temperature of column and detector was 210С, temperature of evapo- rator was 240С. Media gas was helium. Gas discharge ratio in the evaporator was 1:30 at 1.8 atm. Z-Chrom station was used for calculating area of chromatographic peaks and processing the results. FA methyl ethers were identified by retention time using standards and carbon numbers [21]. Results were represented in relative per- centage of total FA. 2.2.3. Determination of Srythrocyte Pro-Oxidant and Anti-Oxidant Erythrocyte maleic dialdehyde (MDA) was estimated spectrophotometrically using thiobarbituric acid assay [22]. GSH was measured according to the Ellman method [23]. Glutathione reductase activity was measured ac- cording to the method described [24], glutathione per- oxidase activity – [25]. 2.2.4. Statistic Methods All data were analyzed by ANOVA using computer pro- gram Statistika 6.1 (series 1203С for Windows). Data present as means ± SEM. (М). Differences between means were assessed by Student's significance test. 3. RESULTS AND DISCUSSION Analysis result of serum lipids indexes of rats in different stages are shown in Table 2. Serum TC, TG levels, index of atherogenesis increased (р < 0.001) of rats in the group 1. Serum HDL-C levels reduced (р < 0.001). After 90 days of the experiment, serum TG, TC levels of rats in the group 2 decreased compared with of rats in group1. At the end experiment, no significant difference was present between TG levels of group 3 and control group, neither between HDL-C levels. Compared with the result of group 2, the TG, TC levels were increased; the index of atherogenesis of group 3 was lower than that of group 1 and group 2. 3.1. Erythrocyte Phospholipids Separation of erythrocyte PL of rats identified six com- ponents including phosphatidylcholine (PC), phosphati- dylethanolamine (PE), phosphatidylserine (PS), sphin- gomyelin (SM), phosphatidylinositol (PI) and phos- phatidic acid. Phosphatidic acid was found as traces (Table 3). Erythrocyte phospholipids fraction of phosphatidy- linositol and phosphatidylcholine were reduced in the group 1 (р < 0.001). Levels of phosphatidylserine and phosphatidylethanolamine were increased in erythrocyte membrane. Onset of the deficit PI and PC which form outer layer of membrane, indicate activation of specific phospholipases and intensification of lipid peroxidation processes contributing to plasma membrane destruction [26,27]. A quick-response was increase in PE level ac- cumulating in inner layer of membrane lipid fraction, where most of the active centers of membrane bonded enzymes are located. Research results prove that on the 30 day of high-fat diet membrane forming lipids promptly responded to the stress to prevent deep structural and functional damage to cell. Changes in erythrocyte membrane at PS, PC and PE level in rats of group 2 was of the same direction as in rats of group 1. Decrease PC lever in outer layer of erythro- cyte membranes was compensated by SM maintenance within the range pertinent to control group animals. Such condition can be described as a compensatory response of cell to long-term exposure to stress alimentary factors. Moreover, due to the high saturation of PE the cholesterol is not hardly building into the inner monolayer. This helps to preserve hydrophilic surrounding of cell membrane integral proteins and, therefore, their function [28]. Depletion of erythrocyte PC which forms outer shell of cell lipid matrix was evidenced at a longer exposure to high-caloric diet (180 days) as well. PC reduction in group 3 was accompanied by reliable increase in PS and SM level as compared to control group, meaning that erythrocyte cell was structurally and functionally inade- quate. Due to high saturation with SM, the clusters forming phospholipids in a membrane receive large quantity of cholesterol, and this results in lower perme- ability of cell membrane and interference in active metabolic processes [28]. Thus, on the 180 day of the experiment cell membrane became unable to resist the continuous flow of alimentary stress factors, and the stage of cell compensatory protection depletion occurred that had been formed by the 90 day of high-caloric diet. 3.2. Erythrocytes Fatty Acids Qualitative composition of erythrocytes FA in rats was represented by components with carbon chain length from С10 to С24, both even and odd, of normal and isomeric structure, saturated, monounsaturated and polyunsatu- rated (Table 3). Certain FA with content below 0.1% were not included into Table 3. These mostly include saturated FA with normal structure, (10:0, 19:0, 20:0, 22:0), some monounsaturated (14:1, 18:1n5, 20:1, 22:1), 18:2n5/9 and 20:3n3 FA. Analysis of the qualitative composition of FA of erythrocyte lipids showed that rats with dyslipidemia have considerable changes in FA composition as com- pared to control group. Myristic (14:0), stearic (18:0) FA share was observed to increase in group 1. Unsaturated FA demonstrated minor increase of monoenoic oleic FA (18:1n9, р<0.01) level, reliable accumulation of n6 FA – 20:4n6, 22:4n6, 22:5n6 and decrease in essentially li group 1 is related to the specific features of experimental- noleic FA (18:2n6). Share of n3 polyunsaturated fatty acids (PUFA) slightly reduced due to the identified de  T. P. Novgorodtseva et al. / HEALTH 2 (2010) 45-50 SciRes Copyright © 2010 Openly accessible at http://www.scirp.org/journal/HEALTH/ 48 Table 3. Effect of high-fat diet on phospholipids and fatty acids percentage in the erythrocyte of rats. Days of fed high-fat diet Phospholipids and fatty acids components Control group, n=10 30 days (group 1), n=10 90 days (group 2), n=10 180 days (group 3), n=10 Phospholipids, % PS 6.800.85 13.000.67*** 11.10.5*** *13.011.04*** PI 3.900.00 1.140.17*** ***4.690.19* 1.660.29*** SM 14.420.97 15.772.09 14.50.39 ***17.80.52*** PC 55.881.14 42.380.96*** 47.70.66** 46.42.37** PE 21.500.75 28.820.99*** *22.010.34 **20.41.05 Fatty acids, % 12:0 0.25±0.02 tr 0.100.01*** ***0.400.07*** 14:0 0.52±0.04 0.83±0.08* **0.5±0.06 ***1.010.12*** 15:0 0.74±0.11 0.58±0.07 0.43±0.02** *0.560.04 15:1 0.24±0.08 0.18±0.02 tr **0.300.05 16:0 23.72±0.84 24.38±0.57 **28.6±0.56*** 27.61.4*** 16:1n7 1.90±0.25 1.83±0.12 ***0.83±0.05*** 2.040.21 17:0 0.94±0.11 0.65±0.10* 0.7±0.01** 0.580.05 17:1 0.96±0.16 0.32±0.02*** ***0.18±0.03* 0.260.04 18:0 10.1±0.5 14.68±0.48** 17.3±0.57*** 13.92.77*** 18:1n9 7.66±0.57 11.45±1.22** 10.5±0.31 11 . 2 1.38 18:1n7 3.90±0.25 2.95±0.38 3±0.08 2.590.13** 18:2n6 14.02±0.64 9.78±0.23*** *12.6±0.4 **11.30.97** 18:3n3 1.45±0.32 tr tr 0.30.08*** 20:2n6 0.27±0.02 0.43±0.03 **0.78±0.06*** ***0.290.02** 20:3n9 0.35±0.12 tr 0.17±0.03 ***0.950.09*** 20:3n6 0.6±0.13 0.88±0.09 *1.23±0.06** 0.90.08** 20:4n6 6.78±1.72 21.27±1.92*** *16.3±0.5*** **16.30.94*** 20:4n3 0.17±0.03 0.38±0.02*** tr 0.320.08*** 20:5n3 0.9±0.23 0.73±0.29 0.58±0.05* 0.680.05** 21:5n3 0.67±0.09 tr 0.3±0.01*** **0.780.18 22:4n6 0.58±0.07 1.58±0.09** ***0.85±0.05** ***0.660.08 22:5n6 0.23±0.15 0.55±0.05* ***0.17±0.03 ***0.530.13*** 22:5n3 1.32±0.16 1.62±0.27 1.68±0.09** 1.150.27 22:6n3 5.53±0.92 3.93±0.71 *2.22±0.08** *2.850.53*** Total n6 36.4±1.1 34.32±1.86 31.9±0.26** *27.11.93*** Total n3 8.77±0.22 6.47±1.19 4.55±0.1** *3.750.68*** UI 183.5±20.8 167.92±3.14* *140±1.35* ***11811.3*** U I – unsaturation index (sum of products of double bond and FA relative percentage in each FA); tr – less 0.1 %. crease in eicosapentaenoic (20:5) and docosahexaenoic (22:6) FA. FA saturation index in rats of group 1 was low. The reduction of general erythrocyte lipids unsaturation revealed by the experiment is mostly conditioned by decrease in relative level of essential linoleic FA and redistribution between n6 and n3 family acids [29,30]. Metabolism of n6 FA is known to originate from linoleate consumed with food. Low linoleate content in rats of diet, poor in PUFA. Further metabolic transformations of es- sential FA resulted in accumulation of arachidonic (20:4n6) FA, which is a predecessor of synthesis of anti-inflammatory leukotriens and thromboxanes with their strong aggregation and vasoconstriction properties [31, 32]. Growing share of 22:4n6 and 22:5n6 in eryth- rocyte lipids can be deemed a compensatory response to the deficiency of docosahexaenoic FA.  T. P. Novgorodtseva et al. / HEALTH 2 (2010) 45-50 SciRes Copyright © 2010 Openly accessible at http://www.scirp.org/journal/HEALTH/ 49 Table 4. Effect of high-fat diet on parameter of erythrocytes pro-oxidant and anti-oxidant. Days of fed high-fat diet Parameter Control group, n=10 30 days (group 1), n=10 90 days (group 2), n=10 30 days (group 1), n=10 MDA, mkmol/g Hb 4,6±0,3 5,3±0,3* ***8,1±0,2** 9,1±0,2*** GSH, nmol/g Hb 5,30,2 3,50,3*** **4,10,1* **2,00,2*** Glutatione reductase, mkmol NАDPН/mgHb/min 75,11,5 68,01,5** *73,31,6 **50,12,4*** Glutathione peroxidase, mkmol GSH /mgHb/min 44,5±0,8 32,51,3** **40,1±2,2 ***21,4±1,2*** In group 2 unsaturated fatty acids (12:0, р<0.001) in- crease in comparison to the control group. On the contrary, rats of group 3 demonstrated growth of 12:0 level (р<0.001). Accumulation of saturated 14:0, 16:0 FA in erythrocyte lipids group 3 was more evident than in rats of group 2. Modification of n6 composition in PUFA was distinguished by reducing 18:2n6 (р<0.01) share in comparison to the control group, reliable figures being obtained from rats of group 3; and growth of 20:2n6 (р<0.001), 20:3n6 (р<0.01) and 22:4n6 (р<0.01) content, more considerable in rat of group 2. Increase in 22:5n6 (р<0.001) share was noticed for rats of group 3 only. Rats subject to long-term high-caloric diet demonstrated defi- cit of n3 PUFA – 20:5n3 (р<0.01) and 22:6n3 (р<0.001) FA. 20:3n9 compensatory synthesis from 18:1n9 FA was a natural consequence of n3 deficit in rats with prolonged dyslipidemia. The change in FA composition profile, as revealed by the experiment indicates higher risk of car- diovascular pathology occurrence [30]. 3.3. Erythrocytes Pro-Oxidant and Anti-Oxidant MDA erythrocytes content increased in all groups of rats with dyslipidemia in comparison to the control group (Table 4). GSH level decreased in all groups after fed with high-fat feed in comparison to the control group (р < 0.001). GSH differences of rats in group 1 and group 2 had no statistical significance. Glutathione reductase activity decreased in erythrocytes in group 1 (р < 0.01) and group 3 (р < 0.001) in comparison to the control group (р < 0.001). Glutathione reductase activity in group 2 was higher then in group 1 (р < 0.05) and no statistical significance in comparison to the control group. Glu- tathione peroxidase activity decreased in 1 group and 3 group of rats with dyslipidemia. Glutathione reductase activity in group 2 had no statistical significance the control group. 4. CONCLUSIONS Thus, generalizing results of researches it is possible to conclude that the important mechanism of adaptation of a cellular membrane to high-fat diet loading is increase major, structuring a membrane PL (PE) and minor, most metabolic significant fractions PL (PI), keeps homeosta- sis of 18:2n6 and 22:6n3 FA, 20:3n9 compensatory syn- thesis, decrease in activity of processes lipid peroxidation at the expense of activation of enzymes of glutathione redox-system and glutathione synthesis. Active formation and realization by a cage of the adaptable answer at high-fat diet loading occurs during the period from 30 till 90 days. Apparently, at the expense of exhaustion com- pensatory mechanisms in glutathione system and inten- sifications of processes lipid peroxidation for 180 days of fatty loading occur more essential deep reorganizations of lipids at biological membrane. This is one of the impor- tant mechanisms of pathogenesis heart diseases, meta- bolic syndrome. The received results of research expand knowledge of mechanisms of adaptation and dysadapta- tion cages at stressful loadings and can be a basis for diagnostics and treatment of a cellular pathology. REFERENCES [1] Jacobsen, M.U., Overvard, K., Dyerberg, J. et al. (2004) Dietary Fat and Risk of Coronary Heart Disease: Possible Effect Modification by Gender and Age. Am. J. Epidemiol, 160(2), 141-149. [2] Susan, M., Castracane, V., Mantzoros, S. (2004) Energy homeostasis, obesity and eating disorders: Recent Ad- vances in Endocrinology. J. Nutr, 134, 295-298. [3] Wymann, M.P., Schneiter, R. (2008) Lipid signaling in disease. Nature, 9, 162-176. [4] Denke, M.A. (2005) Diet, lifestyle and nonstatin trials: review of time to benefit. Am J Cardiol, 96, 3-10. [5] Hulbert, A.J., Turner, N., Storlien, L.H. et al. (2005) Dietary fats and membrane function: implications for metabolism and disease. Biol. Rev. Camb. Philos. Soc, 80(1), 155-169. [6] Beth, L., Marlies, K.O., Carlson, S.E. (2007) Diet (n-3) Polyunsaturated Fatty Acid Content and Parity Affect Liver and Erythrocyte Phospholipid Fatty Acid Composi- tion in Female Rats. J. Nutr, 137, 2425-2430. [7] Beth, L., Marlies, K.O., Susan, E. Carlson. (2007) Diet (n-3) Polyunsaturated Fatty Acid Content and Parity Af- fect Liver and Erythrocyte Phospholipid Fatty Acid Composition in Female Rats. J. Nutr, 137, 2425-2430. [8] Berra, B., Mortontano, G., Adouni, L. et al. (1998) Serum lipids and lipid composition of red blood cell membranes  T. P. Novgorodtseva et al. / HEALTH 2 (2010) 45-50 SciRes Copyright © 2010 Openly accessible at http://www.scirp.org/journal/HEALTH/ 50 after diet with sunflower oil normal or high content of oleic acid. Riv. Ital. Sostanze Grasse, 75, 127-132. [9] Jula, A., Marniemi, J., Ronnemaa, T. et al. (2005) Effects of diet and simvastatin on fatty acid composition in hypercholesterolemiс men. Arterioscler Thromb Vasc Biol, 25, 1952-1959. [10] Poppitt, S.D., Kilmartin, P., Butler, P., Keogh, G.F. (2005) Assessment of erythrocyte phospholipid fatty acid com- position as a biomarker for dietary MUFA, PUFA or saturated fatty acid intake in a controlled cross-over in- tervention trial. Lipids Health Dis, 4, 30. [11] Poole, L.B., Karplus, P.A., Claiborn, A. (2004) Protein sulfenic asids in redox signaling. Annu. Rev. Pharmacol. Toxicol, 44, 325-347. [12] Iton, K., Ishii, T., Wakabayashi, N., Yamomoto, M. (1999) Regulatory mechanisms of cellular response to oxidative stress. Free radic. Res, 31, 319-324. [13] Bea, F., Hudson, F.N., Chait, A. et al. (2003) Induction of glutathione synthesis in macrophages by oxidized low- density lipoproteins is mediated by consensus antioxidant response elements. Circ. Res, 92, 386-393. [14] Format, H.J., Fukuto, J.M., Torres, M. (2004) Redox signaling: thiol chemistry defines which reactive oxygen and nitrogen species can act second messengers, Am. J. Physiol. Cell Physiol, 287, 246-256. [15] Fan, J.G., Zhong, L., Xu, Z.J. (2003) Effect of low-cal orie diet on steatohepatitis in rats with obesity and hyperlipi- demia. World J. Of Gastroenterology, 9(9), 2045-2049. [16] European Convention for the Protection of Vertebrate Animals used for exsperimental and other scientific pur- poses. Strasburg: Council of Europe, (1986), 51. [17] Bligh, E.G., Dyer, W.J. (1959) A rapid method of total lipid extraction and purification. Can. J. Biochem. Physiol, 37(8), 911-917. [18] Svetashev, V.I., Vaskovsky, V.E. (1972) A simplified technique for thinlayer chromatography of lipids. J. Chromatogr.; 67:376-378. [19] Vaskovsky, V.E., Kostetsky, E.X., Vasendin, J.M. (1975) A universal reagent for phospholipids analysis. J. Chro- matogr, 111, 129-141. [20] Carreau, J.P., Duback, J. P. (1978) Adaptation of a mac- roscale method to the microscale for fatty acid methyl transesterification of biological lipid extract. J. Chroma- togr, 151(3), 84-390. [21] Stransky, K., Jursik, T., Vitek, A., Skorepa, J. (1992) An improved method of characterizing fatty acids by equivalent chain length values, J. High. Res, Chromatogr, 15, 730-740. [22] Yagi, K. (1987) Lipid peroxides and human diseases. Chem Phys Lipids, 45, 337-351. [23] Ellman, G.L. (1959) Tissue sulfhydryl group. Arch. Bio- chem. Biophys, 82: 70-77. [24] Ramos-Martines I.L., Torres A.M. (1985) Glutatione reductase of mantle tissue from sea mussel medulis 1. Рurification and characterization two seasonal enzymatic forms. Biochem. Physiol, 80(213), 355-360. [25] Mills, G.C. (1959) The purification and properties of glutathione peroxidase of erythrocytes. J. Biol. Chem, 234 (3), 502-506. [26] McIntyre, T.M., Zimmerman, G.A., Prescott, S.M. (1999) Biologically Active Oxidized Phospholipids. J Biol Chem, 274(36), 25189-25192. [27] Steenbergen, R., Nanowski, T.S., Nelson, R. et al. (2006) Phospholipid homeostasis in phosphatidylserine syn- thase-2-deficient mice. Bioch. Et Biophys. Acta. 1761(3), 313-323. [28] Hulbert, A.J., Turner, N., Storlien, L.H. et al. (2005) Dietary fats and membrane function: implications for metabolism and disease. Biol. Rev. Camb. Philos. Soc, 80(1), 155-169. [29] Simopoulos, A.P. (2002) The importance of the ratio of omega-6/omega-3 essential fatty acids. Biomed Phar- macother, 56, 365-79. [30] Harris, W.S., Poston, W.C., Haddock, C.K. (2007) Tissue n-3 and n-6 fatty acids and risk for coronary heart disease events. Atherosclerosis, 193, 1-10. [31] Zhou L., Nilsson А. (2001) Sources of eicosanoid pre- cursor fatty acid pools in tissues. J. Lipid Res, 42, 1521- 1542. [32] Novgorodtseva, T.P., Karaman, Yu.K., Antoniuk, M.V., Zhukova, N.V. (2009) The role of free and esterified fatty acids in pathogenesis of metabolic syndrome. Klin Med, 87(5), 33-7. |