Paper Menu >>
Journal Menu >>
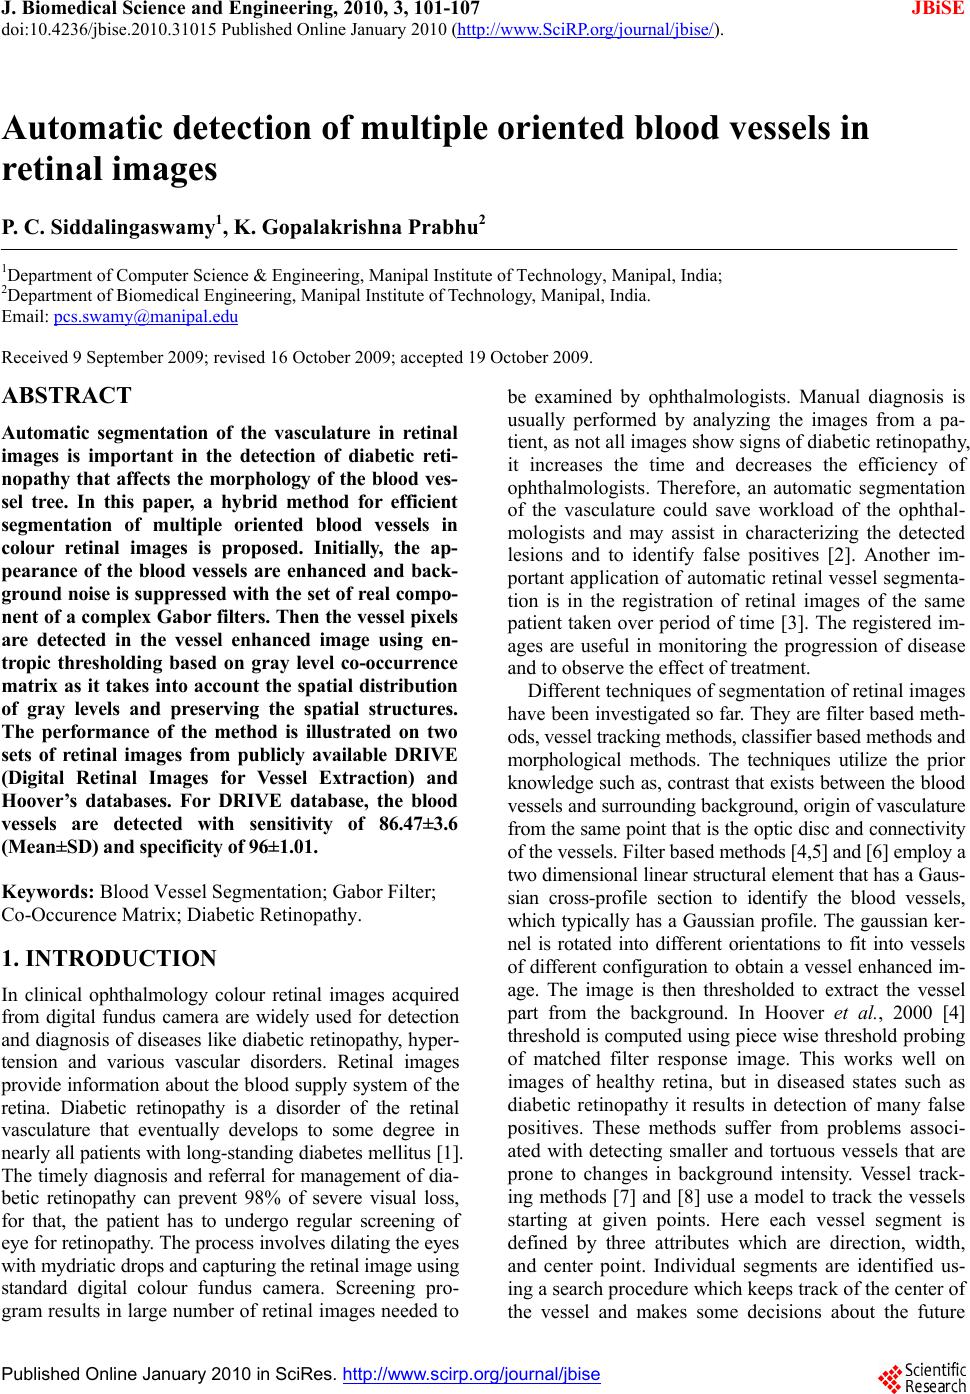 J. Biomedical Science and Engineering, 2010, 3, 101-107 doi:10.4236/jbise.2010.31015 Published Online January 2010 (http://www.SciRP.org/journal/jbise/ JBiSE ). Published Online January 2010 in SciRes. http://www.scirp.org/journal/jbise Automatic detection of multiple oriented blood vessels in retinal images P. C. Siddalingaswamy1, K. Gopalakrishna Prabhu2 1Department of Computer Science & Engineering, Manipal Institute of Technology, Manipal, India; 2Department of Biomedical Engineering, Manipal Institute of Technology, Manipal, India. Email: pcs.swamy@manipal.edu Received 9 September 2009; revised 16 October 2009; accepted 19 October 2009. ABSTRACT Automatic segmentation of the vasculature in retinal images is important in the detection of diabetic reti- nopathy that affects the morphology of the blood ves- sel tree. In this paper, a hybrid method for efficient segmentation of multiple oriented blood vessels in colour retinal images is proposed. Initially, the ap- pearance of the blood vessels are enhanced and back- ground noise is suppressed with the set of real compo- nent of a complex Gabor filters. Then the vessel pixels are detected in the vessel enhanced image using en- tropic thresholding based on gray level co-occurrence matrix as it takes into account the spatial distribution of gray levels and preserving the spatial structures. The performance of the method is illustrated on two sets of retinal images from publicly available DRIVE (Digital Retinal Images for Vessel Extraction) and Hoover’s databases. For DRIVE database, the blood vessels are detected with sensitivity of 86.47±3.6 (Mean±SD) and specificity of 96±1.01. Keywords: Blood Vessel Segmentation; Gabor Filter; Co-Occurence Matrix; Diabetic Retinopathy. 1. INTRODUCTION In clinical ophthalmology colour retinal images acquired from digital fundus camera are widely used for detection and diagnosis of diseases like diabetic retinopathy, hyper- tension and various vascular disorders. Retinal images provide information about the blood supply system of the retina. Diabetic retinopathy is a disorder of the retinal vasculature that eventually develops to some degree in nearly all patients with long-standing diabetes mellitus [1]. The timely diagnosis and referral for management of dia- betic retinopathy can prevent 98% of severe visual loss, for that, the patient has to undergo regular screening of eye for retinopathy. The process involves dilating the eyes with mydriatic drops and capturing the retinal image using standard digital colour fundus camera. Screening pro- gram results in large number of retinal images needed to be examined by ophthalmologists. Manual diagnosis is usually performed by analyzing the images from a pa- tient, as not all images show signs of diabetic retinopathy, it increases the time and decreases the efficiency of ophthalmologists. Therefore, an automatic segmentation of the vasculature could save workload of the ophthal- mologists and may assist in characterizing the detected lesions and to identify false positives [2]. Another im- portant application of automatic retinal vessel segmenta- tion is in the registration of retinal images of the same patient taken over period of time [3]. The registered im- ages are useful in monitoring the progression of disease and to observe the effect of treatment. Different techniques of segmentation of retinal images have been investigated so far. They are filter based meth- ods, vessel tracking methods, classifier based methods and morphological methods. The techniques utilize the prior knowledge such as, contrast that exists between the blood vessels and surrounding background, origin of vasculature from the same point that is the optic disc and connectivity of the vessels. Filter based methods [4,5] and [6] employ a two dimensional linear structural element that has a Gaus- sian cross-profile section to identify the blood vessels, which typically has a Gaussian profile. The gaussian ker- nel is rotated into different orientations to fit into vessels of different configuration to obtain a vessel enhanced im- age. The image is then thresholded to extract the vessel part from the background. In Hoover et al., 2000 [4] threshold is computed using piece wise threshold probing of matched filter response image. This works well on images of healthy retina, but in diseased states such as diabetic retinopathy it results in detection of many false positives. These methods suffer from problems associ- ated with detecting smaller and tortuous vessels that are prone to changes in background intensity. Vessel track- ing methods [7] and [8] use a model to track the vessels starting at given points. Here each vessel segment is defined by three attributes which are direction, width, and center point. Individual segments are identified us- ing a search procedure which keeps track of the center of the vessel and makes some decisions about the future  P. C. Siddalingaswamy et al. / J. Biomedical Science and Engineering 3 (2010) 101-107 Published Online January 2010 in SciRes. http://www.scirp.org/journal/jbise 102 (a) (b) (c) (d) Figure 1. (a) Colour retinal image; (b-d) Red, Green and Blue component images. path of the vessel based on certain vessel properties. These methods require that beginning and ending search points are manually selected using cursor or by using simple thresholding techniques. Vessel tracking methods provide very accurate measurements of vessel widths but tracking methods often tend to terminate at branch points. Classifier-based method employs two-step approach [9]. They start with a segmentation step often by employing one of the mentioned matched filter-based methods and then the regions are classified according to many fea- tures. In the next step neural networks classifier is con- structed using selected features by the sequential for- ward selection method with the training data to detect vessel pixels. Mathematical Morphology is employed for segmentation of blood vessels as reported in [10,11] and [12]. These methods exploits features of the vasculature shape that are known prior, such as it being piecewise linear and connected. They work well on normal retinal images with uniform contrast but suffer when there is a noise due to pathologies within the retina of eye. Many papers have reported work on segmentation of vessels, but still there is scope for improvement as these methods detect vessels along with artifacts. Also detection proc- ess becomes much more complicated in presence of le- sions and other pathological changes affect the retinal images. The proposed retinal vessel detection method is com- prised of two steps that is the retinal vessel enhancement followed by entropic thresholding. A set of Gabor filters tuned to particular frequency and orientation are used to enhance the blood vessels suppressing the background. Entropy based thresholding based on gray level co-oc- currence matrix is employed for the segmentation of the vessels. The following sections elucidate materials and methods for vessel segmentation method, results and discussion. 2. MATERIALS AND METHODS To develop a retinal vessel segmentation system, the first important thing is to obtain an effective database. To realize this and also for facilitating comparison with the existing methods, two sets of publicly available data- bases are used. 2.1. Retinal Image Database The DRIVE database provides forty images [19]. The images are acquired using a Canon CR5 non-mydriatic 3CCD camera with a 45 degree field of view (FOV). Each image was captured using 8 bits per colour plane at 768×584 pixels. The FOV of each image is circular with a diameter of approximately 540 pixels. The Hoover’s database [4] consists of twenty digitized slides captured by a TopCon TRV-50 fundus camera at 35 FOV. The slides were digitized to 700× 605 pixels with eight bits per colour channel. Both the databases provide the hand labeled blood vessels identified by experts as gold stan- dard and binary mask image identifying the boundary of the effective portion of each image. Apart from these  P. C. Siddalingaswamy et al. / J. Biomedical Science and Engineering 3 (2010) 101-107 SciRes Copyright © 2010 JBiSE 103 (a) (b) Figure 2. (a) Surface representation of Gabor filter; (b) Real part of Gabor filter. two databases the images are also acquired from the Department of Ophthalmology, Kasturba medical col- lege (KMC), Manipal using Sony FF450IR digital colour fundus camera with 24 bit colour depth and 768×576 pixel resolution. These images are of very large variabil- ity in terms of fundus disease and image quality and were used to test the robustness of proposed retinal ves- sel detection method. 2.2. Preprocessing In the colour retinal images, blood vessels appear darker than the background similar to the colour of lesions like microaneurysms and hemorrhages. So it becomes essen- tial to exempt the vessel area during the detection of lesions to avoid false positives. Only one step is in- volved in the preprocessing of retinal images for seg- mentation of vessels. It can be seen in the Figure 1 that the blood vessels appear most contrasted in the green channel compared to red and blue channels in RGB im- age. Only the green channel image is used for further processing suppressing the other two colour compo- nents. 2.3. Vessel Enhancement The Gabor filters are widely applied to image processing and computer vision application problems such as face recognition and texture segmentation, strokes in charac- ter recognition and roads in satellite image analysis [13,14] and [15]. Since, the vessels in the retinal image are connected and piecewise linear, for their segmenta- tion gabor filters are better suited as they are capable of detecting oriented features and can be fine tuned to spe- cific frequencies. Because of their frequency sensitive- ness it is possible to filter out the background noise of retinal images. The spatial Gabor filter kernels are sinu- soids modulated by a Gaussian window, the real part of which is expressed by 22 ,c pp os2 p yx xy g x yexpfx (1) where, p x =xcos+ ysin p yxsin+ycos The Gabor function is defined by five parameters as follows. is the orientation of the filter, an angle of zero gives a filter that responds to vertical features. f is the central frequency of pass band. x is the stan- dard deviation of Gaussian in x direction along the filter that determines the bandwidth of the filter. y is the standard deviation of Gaussian across the filter that con- trol the orientation selectivity of the filter. The parame- ters are to be derived by taking into account the size of the lines or curvilinear structures to be detected. In reti- nal images the width of the vessels varies along the length of the vessel and in manual segmentation it is found that majority of the vessel diameters are of 4 pix- els wide. Therefore to accommodate the all vessels in the detection the thickness parameter t is set to four. The other parameters are derived using the procedure in [15] as 0.5t f, 0.75 xt and 0.85 yx and 2ln2 π . The surface representation and real part of resulting Gabor kernel is shown in Figure 2. It can be seen that it is suited for the orientation of directional features to provide good response for pixels associated with retinal blood vessels. To obtain good response of the vessels oriented along  P. C. Siddalingaswamy et al. / J. Biomedical Science and Engineering 3 (2010) 101-107 SciRes Copyright © 2010 JBiSE 104 Figure 3. Enhanced vessels in Gabor response. Figure 4. (a) Gray level distribution in GLCM; (b) Represen- tation of GLCM of 4 quadrants different directions, the of filter is rotated from 0o to 170o in the steps of ten degrees to produce a single peak response on the center of a vessel segment. At each pixel only the maximum response is retained. Figure 3 shows the result of convolving the image in Figure 1(c) with the vessels oriented along the set of gabor filters. It can be seen that the vessels are enhanced and background is suppressed considerably. To obtain good response of different directions, the of filter is rotated from 0o to 170o in the steps of ten degrees to produce a single peak response on the center of a vessel segment. At each pixel only the maximum response is retained. Figure 3 shows the result of convolving the image in Figure 1(c) with the set of gabor filters. It can be seen that the vessels are enhanced and background is suppressed considerably. 2. . contains information on the distribution of gray level frequency and edge infor- 4. Entropic Thresholding Thresholding is used to segment the blood vessels from the background. An entropy based thresholding method based on gray level co-occurrence matrix (GLCM) is used to find optimal threshold as it takes into account the spatial distribution of gray levels and preserves the spa- tial structures in thresholded image [16,17] and [18] Gray level co-occurrence matrix mation, as it is very useful in finding the threshold value. The gray level co-occurrence matrix T = [ti,j ] of the image I with M×N dimensional matrix gives an idea about the transition of intensities between adjacent pix- els, indicating spatial structural information of an image. Depending upon the ways in which the gray level i fol- lows gray level j, different definitions of co-occurrence matrix are possible. The GLCM is obtained as follows: , 11 MN ij lk t (2) where, (, )(,1) (, )(1, ) 1{ f lkiand flkj or f lkiand flkj if 0otherwi se The probability of co-occurre and j is written as nce Pij of gray levels i , , , ij ij ijij t Pt (3) Let Th be the threshold within tnge h Oh TL w e 4. Quadrant A represents gray le transition within the object while qu gray level transition within the ba level transition between the object and the background or adran an he ra-1, vel here L is the number of gray levels. Threshold Th parti- tions the GLCM into four quadrants, namely A, B, C, and D as in Figur adrant D represents ckground. The gray across the object’s boundary is placed in qut B d quadrant C. The probabilities of object class and background class are defined as , 00 hh TT Aij ij PP (4) Table 1. Performance of retinal blood vessels segmentation method. Database No. of Sensitivity Specificity images (%) (%) DRIVE 40 86.47±3.6 96±1.01 Table 2. Comparison of vessel segmentation results on Hoo- Method Sensitivity range (%) Specificity range ver’s database. (%) Proposed method79-91 94-98 Hoover 2000 80-90 92-93 et al. 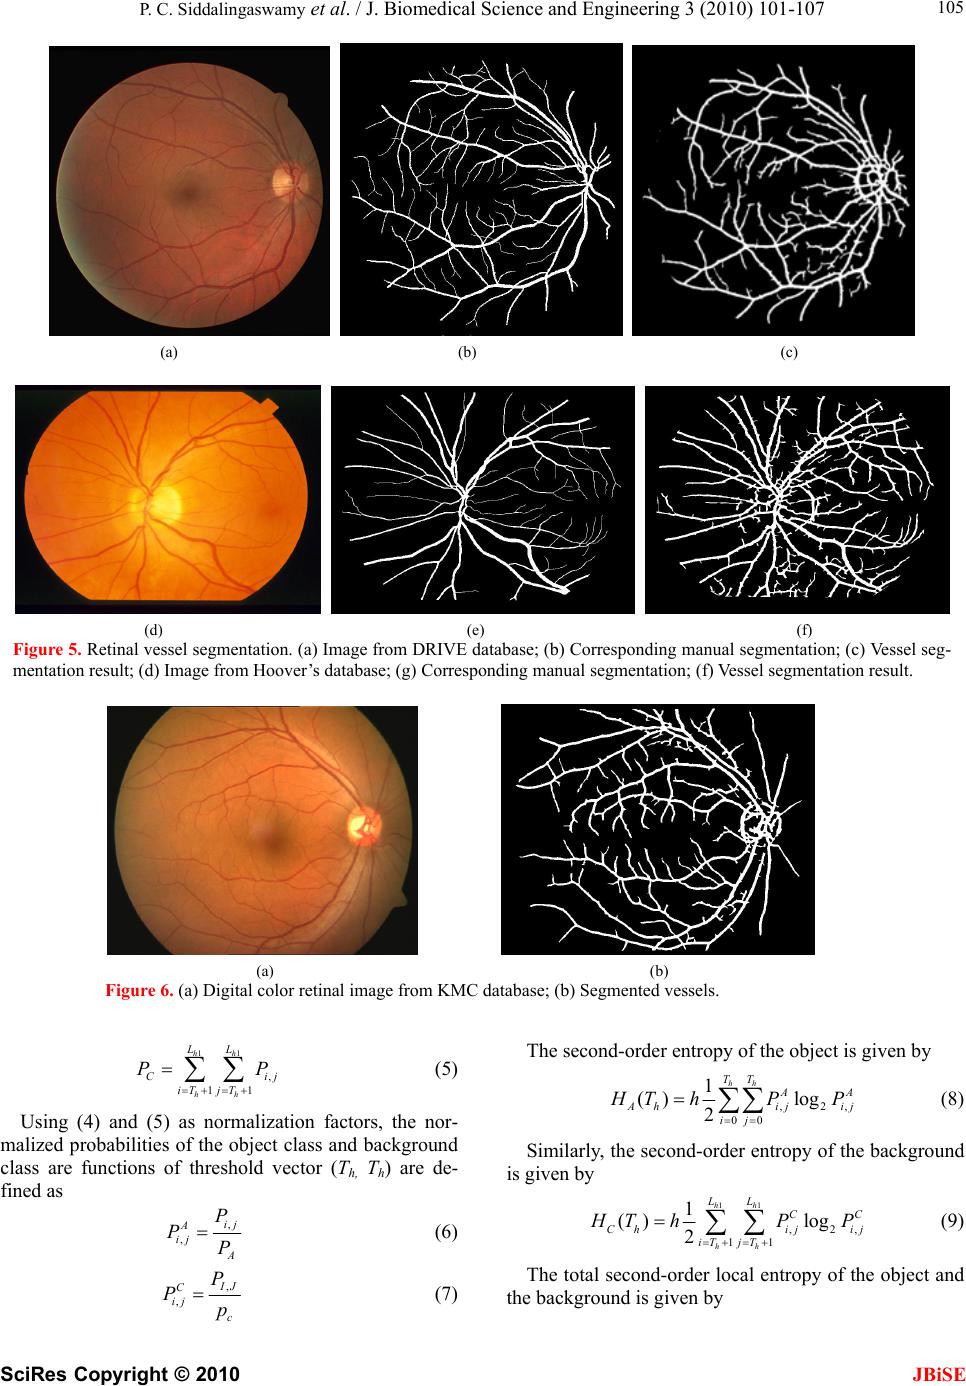 P. C. Siddalingaswamy et al. / J. Biomedical Science and Engineering 3 (2010) 101-107 SciRes Copyright © 2010 JBiSE 105 (a) (b) (c) (d) (e) (f) Figure 5. Retinal vessel segmentation. (a) Image from DRIVE database; (b) Corresponding manual segmentation; (c) Vessel seg- mentation result; (d) Image from Hoover’s database; (g) Corresponding manual segmentation; (f) Vessel segmentation result. (a) (b) Figure 6. (a) Digital color retinal image from KMC database; (b) Segmented vessels. Using (4) and (5) as normalization factors, the nor- malized probabilities of the object class and background class are functions of threshold v fined as 11hh LL , 11 hh Cij iT jT P P (5) ector (Th, T h) are de- , , ij A ij A P PP (6) (7) the obct is given by , , I J C ij c P Pp The second-order entropy ofje ,2, 00 1 () TT lo g 2 hh AA Ahij ij ij H ThP P (8) Similarly, the second-order is given by entropy of the background 11 ,2, lo g CC ij ij T11 1 () 2 hh hh LL C h iT j H Th nd the background is given by P P (9) The total second-order local entropy of the object a 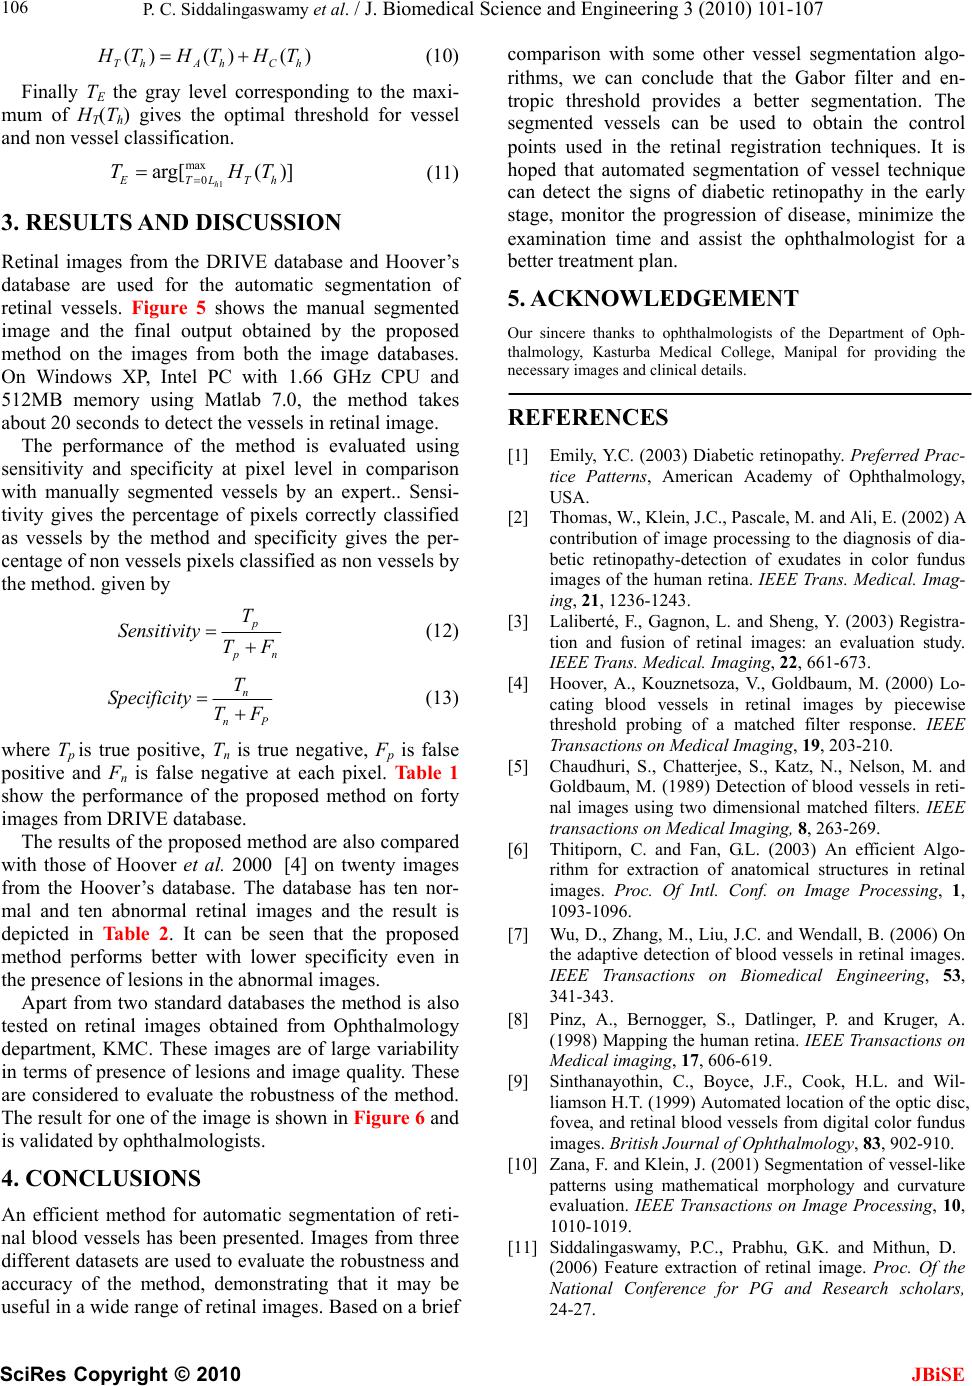 P. C. Siddalingaswamy et al. / J. Biomedical Science and Engineering 3 (2010) 101-107 SciRes Copyright © 2010 JBiSE 106 ()() () ThAh Ch HTHTHT Finally TE the gray level corresponding to the maxi- m T (11) 3. RESULTS AND DISCUSSION automatic retinal vessels. Figure 5 shows the m im with 1.66 GHz CPU and 512MB memory using Matlab 7.0 about 20 seconds to detect the vesse ng comparison (10) um of HT(Th) gives the optimal threshold for vessel and non vessel classification. 1 max 0 arg[( )] h ETLTh TH Retinal images from the DRIVE database and Hoover’s database are used for the segmentation of anual segmented age and the final output obtained by the proposed method on the images from both the image databases. On Windows XP, Intel PC , the method takes ls in retinal image. The performance of the method is evaluated usi sensitivity and specificity at pixel level in with manually segmented vessels by an expert.. Sensi- tivity gives the percentage of pixels correctly classified as vessels by the method and specificity gives the per- centage of non vessels pixels classified as non vessels by the method. given by p p n T Sensitivity TF (12) n nP T Specificity TF (13) where Tp is true positive, Tn is true negative, Fp is false positive and Fn is false negative at each pixel. Table 1 show the performance of the proposed method on forty images from DRIVE database. The results of the proposed method are also comp with those of Hoover et al. 2000 from the Hoover’s database. The mal and ten abnormal retinal images and the resu depicted in Table 2. It can be method performs better with lower specificity even in of reti- na er segmentation. The e used to obtain the control registration techniques. It is . and Ali, E. (2002) A the diagnosis of dia- [3] Laliberté, F., Gagnon, L. and Sheng, Y. (2003) Registra- inal images: an evaluation study. cal. Imaging, 22, 661-673. sh Journal of Ophthalmology, 83, 902-910. ared [6] Thitiporn, C. and Fan, G.L. (2003) An efficient Algo- rithm for extraction of anatomical structures in retinal images. Proc. Of Intl. Conf. on Image Processing, 1, [4] on twenty images database has ten nor- lt is 1093-1096. [7] Wu, D., Zhang, M., Liu, J.C. and Wendall, B. (2006) On the adaptive detection of blood vessels in retinal images. IEEE Transactions on Biomedical Engineering, 53, seen that the proposed the presence of lesions in the abnormal images. Apart from two standard databases the method is also tested on retinal images obtained from Ophthalmology department, KMC. These images are of large variability in terms of presence of lesions and image quality. These are considered to evaluate the robustness of the method. The result for one of the image is shown in Figure 6 and is validated by ophthalmologists. 4. CONCLUSIONS An efficient method for automatic segmentation l blood vessels has been presented. Images from three different datasets are used to evaluate the robustness and accuracy of the method, demonstrating that it may be useful in a wide range of retinal images. Based on a brief comparison with some other vessel segmentation algo- rithms, we can conclude that the Gabor filter and en- tropic threshold provides a bett segmented vessels can b points used in the retinal hoped that automated segmentation of vessel technique can detect the signs of diabetic retinopathy in the early stage, monitor the progression of disease, minimize the examination time and assist the ophthalmologist for a better treatment plan. 5. ACKNOWLEDGEMENT Our sincere thanks to ophthalmologists of the Department of Oph- thalmology, Kasturba Medical College, Manipal for providing the necessary images and clinical details. REFERENCES [1] Emily, Y.C. (2003) Diabetic retinopathy. Preferred Prac- tice Patterns, American Academy of Ophthalmology, USA. [2] Thomas, W., Klein, J.C., Pascale, M contribution of image processing to betic retinopathy-detection of exudates in color fundus images of the human retina. IEEE Trans. Medical. Imag- ing, 21, 1236-1243. tion and fusion of ret IEEE Trans. Medi [4] Hoover, A., Kouznetsoza, V., Goldbaum, M. (2000) Lo- cating blood vessels in retinal images by piecewise threshold probing of a matched filter response. IEEE Transactions on Medical Imaging, 19, 203-210. [5] Chaudhuri, S., Chatterjee, S., Katz, N., Nelson, M. and Goldbaum, M. (1989) Detection of blood vessels in reti- nal images using two dimensional matched filters. IEEE transactions on Medical Imaging, 8, 263-269. 341-343. [8] Pinz, A., Bernogger, S., Datlinger, P. and Kruger, A. (1998) Mapping the human retina. IEEE Transactions on Medical imaging, 17, 606-619. [9] Sinthanayothin, C., Boyce, J.F., Cook, H.L. and Wil- liamson H.T. (1999) Automated location of the optic disc, fovea, and retinal blood vessels from digital color fundus images. Briti [10] Zana, F. and Klein, J. (2001) Segmentation of vessel-like patterns using mathematical morphology and curvature evaluation. IEEE Transactions on Image Processing, 10, 1010-1019. [11] Siddalingaswamy, P.C., Prabhu, G.K. and Mithun, D. (2006) Feature extraction of retinal image. Proc. Of the National Conference for PG and Research scholars, 24-27.  P. C. Siddalingaswamy et al. / J. Biomedical Science and Engineering 3 (2010) 101-107 SciRes Copyright © 2010 107 to, Y. and Tamura, S. (2000) Orientation , Cai, J. and Buse, R. (2003) Hand-writing rec- 996) Hierar- nal entropic thresholding algo- d Chang, C. (1995) Target de- d S.A.R and Bakar A. (2007) Adaptive (2004) Ridge based vessel seg- JBiSE [12] Yang, Y., Huang, S.Y. and Rao, N. (2008) An automatic hybrid method for retinal blood vessel extraction. Jour- nal of Appl. Math. Comp. Sci., 18, 399-407. [13] Lee, T.S. (1996) Image representation using 2D Gabor wavelets. IEEE Transactions of Pattern Analysis and Machine Intelligence. 18, 959-971. [14] Chen, J., Sa space filtering for multiple orientation line segmentation. IEEE Transactions of Pattern Analysis and Machine In- telligence, 22, 417-429. [15] Liu, Z.Q. ognition: soft computing and probablistic approaches. Springer Verlag. Berlin. [16] Yang, C.W., Chung, P.C. and Chang, C.I. (1 chical fast two dimensio rithm using a histogram pyramid. Optical Engineering, 35, 3227-3241. [17] Mark, L. Althouse, G. an tection in multispectral images using the spectral co- oc- currence matrix and entropy thresholding. Optical Engi- neering, 34, 2135-2148. [18] Mokji, M.M. an thresholding based on co occurrence matrix edge infor- mation. Journal of Computers, 2, 44-52. [19] Staal, J.J., Abràmoff, M.D., Niemeijer, M., Viergever, M. A. and van Ginneken, B. mentation in color images of the retina. IEEE Trans. Med. Imag., 23, 501-509. |