Paper Menu >>
Journal Menu >>
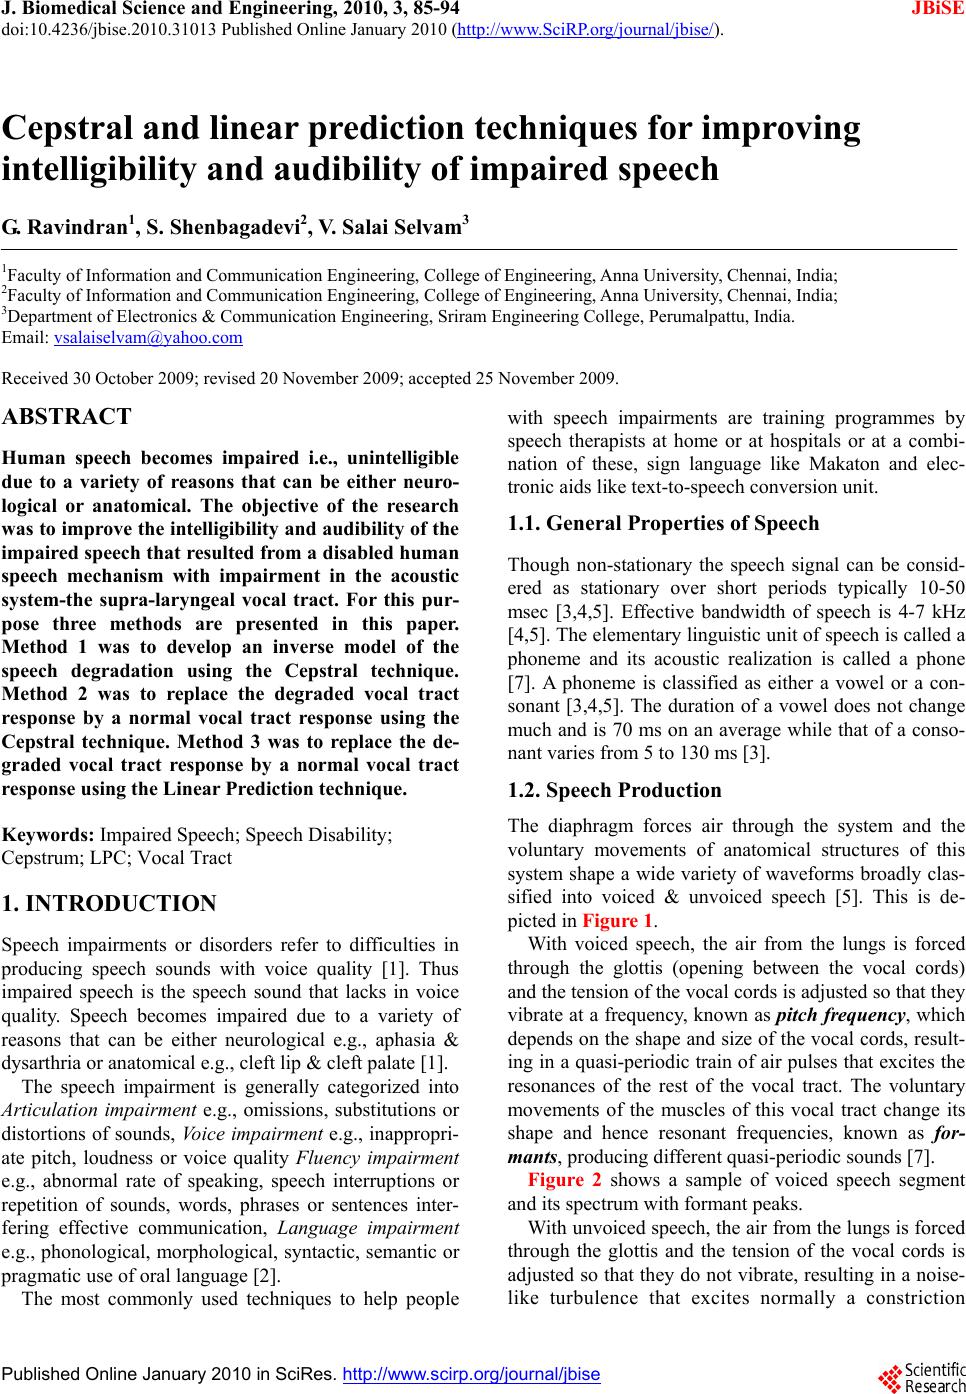 J. Biomedical Science and Engineering, 2010, 3, 85-94 doi:10.4236/jbise.2010.31013 Published Online January 2010 (http://www.SciRP.org/journal/jbise/ JBiSE ). Published Online January 2010 in SciRes. http://www.scirp.org/journal/jbise Cepstral and linear prediction techniques for improving intelligibility and audibility of impaired speech G. Ravindran1, S. Shenbagadevi2, V. Salai Selvam3 1Faculty of Information and Communication Engineering, College of Engineering, Anna University, Chennai, India; 2Faculty of Information and Communication Engineering, College of Engineering, Anna University, Chennai, India; 3Department of Electronics & Communication Engineering, Sriram Engineering College, Perumalpattu, India. Email: vsalaiselvam@yahoo.com Received 30 October 2009; revised 20 November 2009; accepted 25 November 2009. ABSTRACT Human speech becomes impaired i.e., unintelligible due to a variety of reasons that can be either neuro- logical or anatomical. The objective of the research was to improve the intelligibility and audibility of the impaired speech that resulted from a disabled human speech mechanism with impairment in the acoustic system-the supra-laryngeal vocal tract. For this pur- pose three methods are presented in this paper. Method 1 was to develop an inverse model of the speech degradation using the Cepstral technique. Method 2 was to replace the degraded vocal tract response by a normal vocal tract response using the Cepstral technique. Method 3 was to replace the de- graded vocal tract response by a normal vocal tract response using the Linear Prediction technique. Keywords: Impaired Speech; Speech Disability; Cepstrum; LPC; Vocal Tract 1. INTRODUCTION Speech impairments or disorders refer to difficulties in producing speech sounds with voice quality [1]. Thus impaired speech is the speech sound that lacks in voice quality. Speech becomes impaired due to a variety of reasons that can be either neurological e.g., aphasia & dysarthria or anatomical e.g., cleft lip & cleft palate [1]. The speech impairment is generally categorized into Articulation impairment e.g., omissions, substitutions or distortions of sounds, Voice impairment e.g., inappropri- ate pitch, loudness or voice quality Fluency impairment e.g., abnormal rate of speaking, speech interruptions or repetition of sounds, words, phrases or sentences inter- fering effective communication, Language impairment e.g., phonological, morphological, syntactic, semantic or pragmatic use of oral language [2]. The most commonly used techniques to help people with speech impairments are training programmes by speech therapists at home or at hospitals or at a combi- nation of these, sign language like Makaton and elec- tronic aids like text-to-speech conversion unit. 1.1. General Properties of Speech Though non-stationary the speech signal can be consid- ered as stationary over short periods typically 10-50 msec [3,4,5]. Effective bandwidth of speech is 4-7 kHz [4,5]. The elementary linguistic unit of speech is called a phoneme and its acoustic realization is called a phone [7]. A phoneme is classified as either a vowel or a con- sonant [3,4,5]. The duration of a vowel does not change much and is 70 ms on an average while that of a conso- nant varies from 5 to 130 ms [3]. 1.2. Speech Production The diaphragm forces air through the system and the voluntary movements of anatomical structures of this system shape a wide variety of waveforms broadly clas- sified into voiced & unvoiced speech [5]. This is de- picted in Figure 1. With voiced speech, the air from the lungs is forced through the glottis (opening between the vocal cords) and the tension of the vocal cords is adjusted so that they vibrate at a frequency, known as pitch frequency, which depends on the shape and size of the vocal cords, result- ing in a quasi-periodic train of air pulses that excites the resonances of the rest of the vocal tract. The voluntary movements of the muscles of this vocal tract change its shape and hence resonant frequencies, known as for- mants, producing different quasi-periodic sounds [7]. Figure 2 shows a sample of voiced speech segment and its spectrum with formant peaks. With unvoiced speech, the air from the lungs is forced through the glottis and the tension of the vocal cords is adjusted so that they do not vibrate, resulting in a noise- like turbulence that excites normally a constriction 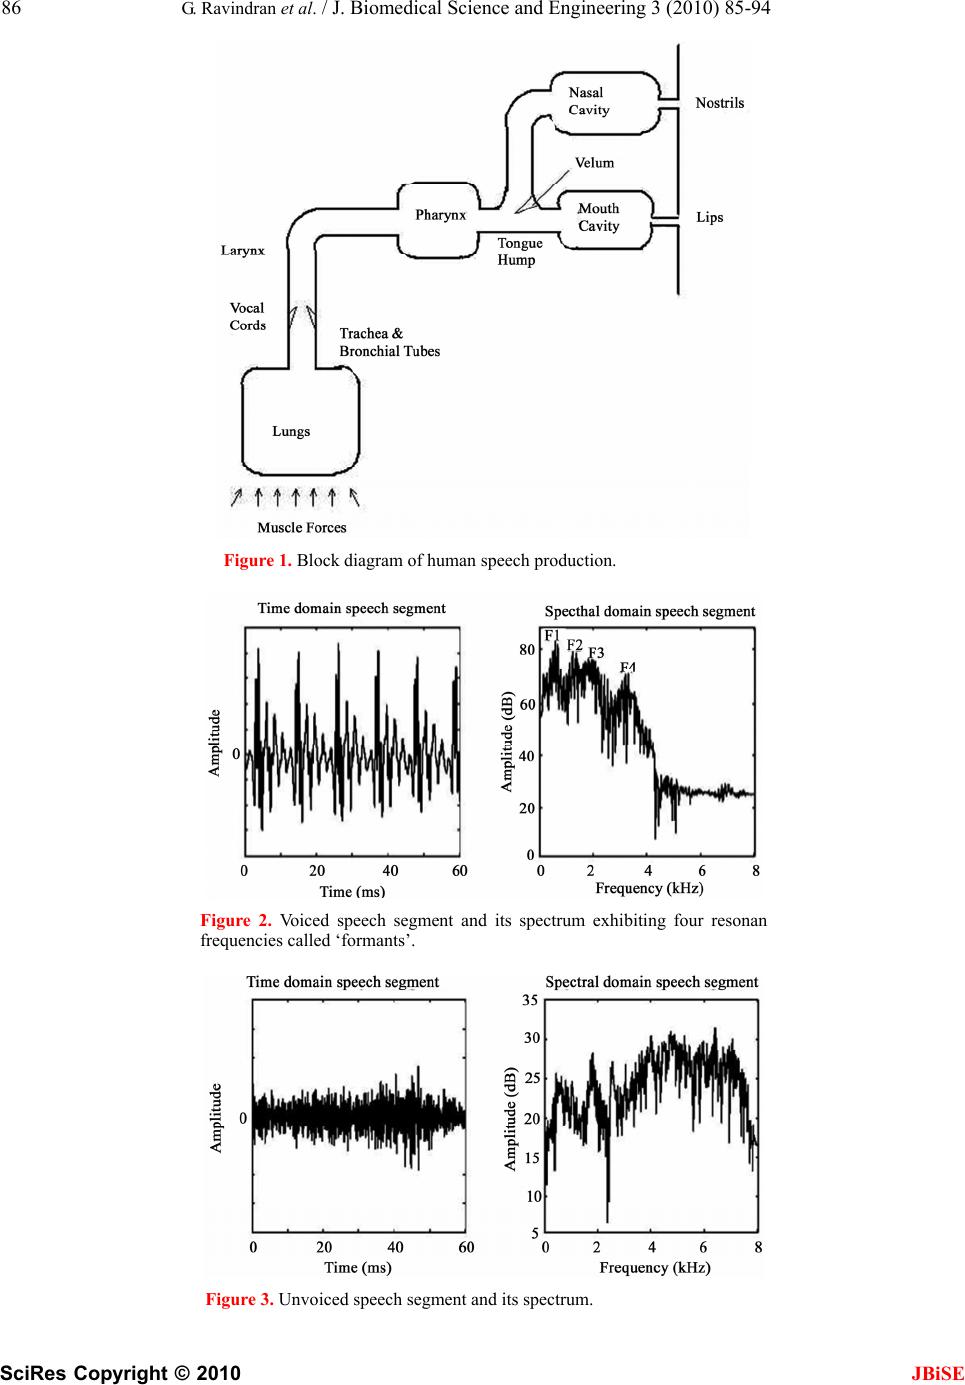 86 G. Ravindran et al. / J. Biomedical Science and Engineering 3 (2010) 85-94 SciRes Copyright © 2010 JBiSE Figure 1. Block diagram of human speech production. Figure 2. Voiced speech segment and its spectrum exhibiting four resonan frequencies called ‘formants’. Figure 3. Unvoiced speech segment and its spectrum. 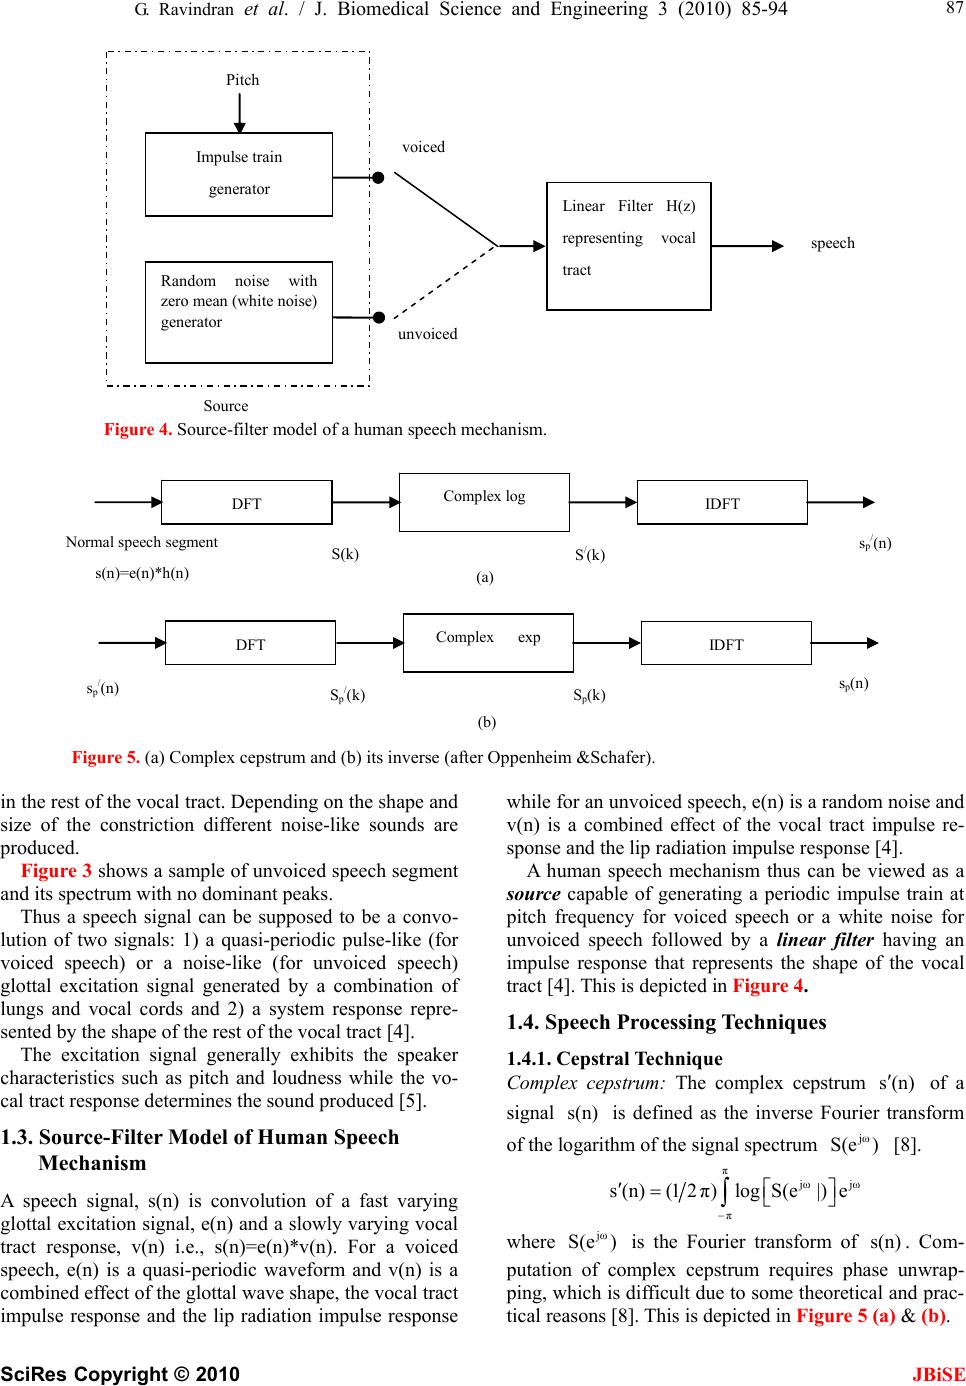 G. Ravindran et al. / J. Biomedical Science and Engineering 3 (2010) 85-94 SciRes Copyright © 2010 87 speech voiced unvoiced Random noise with zero mean (white noise) generator Linear Filter H(z) representing vocal tract Pitch Impulse train generator Source Figure 4. Source-filter model of a human speech mechanism. (b) S p/ (k) s p (n) S p (k) s p/ (n) DFT Complex exp IDFT S / (k) s p/ (n) S(k) (a) Normal speech segment s(n)=e(n)*h(n) DFT Complex log IDFT Figure 5. (a) Complex cepstrum and (b) its inverse (after Oppenheim &Schafer). in the rest of the vocal tract. Depending on the shape and size of the constriction different noise-like sounds are produced. Figure 3 shows a sample of unvoiced speech segment and its spectrum with no dominant peaks. JBiSE Thus a speech signal can be supposed to be a convo- lution of two signals: 1) a quasi-periodic pulse-like (for voiced speech) or a noise-like (for unvoiced speech) glottal excitation signal generated by a combination of lungs and vocal cords and 2) a system response repre- sented by the shape of the rest of the vocal tract [4]. The excitation signal generally exhibits the speaker characteristics such as pitch and loudness while the vo- cal tract response determines the sound produced [5]. 1.3. Source-Filter Model of Human Speech Mechanism A speech signal, s(n) is convolution of a fast varying glottal excitation signal, e(n) and a slowly varying vocal tract response, v(n) i.e., s(n)=e(n)*v(n). For a voiced speech, e(n) is a quasi-periodic waveform and v(n) is a combined effect of the glottal wave shape, the vocal tract impulse response and the lip radiation impulse response while for an unvoiced speech, e(n) is a random noise and v(n) is a combined effect of the vocal tract impulse re- sponse and the lip radiation impulse response [4]. A human speech mechanism thus can be viewed as a source capable of generating a periodic impulse train at pitch frequency for voiced speech or a white noise for unvoiced speech followed by a linear filter having an impulse response that represents the shape of the vocal tract [4]. This is depicted in Figure 4. 1.4. Speech Processing Techniques 1.4.1. Cepstral Technique Complex cepstrum: The complex cepstrum s(n) of a signal is defined as the inverse Fourier transform of the logarithm of the signal spectrum [8]. s(n) jω S(e ) π jωjω π s(n) (12π)logS(e|)e where is the Fourier transform of . Com- putation of complex cepstrum requires phase unwrap- ping, which is difficult due to some theoretical and prac- tical reasons [8]. This is depicted in Figure 5 (a) & (b). jω S(e )s(n)  88 G. Ravindran et al. / J. Biomedical Science and Engineering 3 (2010) 85-94 SciRes Copyright © 2010 JBiSE S / (k) s(n) DFT log|.| IDFT S(k) s r/ (n) (a) (b) s p (n) S r/ (k) S r (k) s r/ (n) DFT log|.| IDFT Figure 6. (a) Real cepstrum and (b) its inverse (after Oppenheim & Schafer). Cepstral domain is known as quefrency (coined from ‘frequency’) domain [8]. Real cepstrum: The real cepstrum sr /(n) of a signal s(n) is defined as the inverse Fourier transform of the loga- rithm of the signal magnitude spectrum |S(ej)| [8]. sr /(n)=(1/2)log(|S(ej)|)ej where S(ej) is the Fourier transform of s(n). Real cepstrum is not invertible but provides a mini- mum phase reconstruction of the signal [8]. This is de- picted in Figure 6 (a) and (b). Since speech is convolution of a fast varying glottal excitation signal, e(n) and a slowly varying vocal tract response, h(n), the cepstrum of a speech segment con- sists of the glottal excitation signal that occupies the low quefrency region and the vocal tract response that occu- pies the high quefrency region [8]. Since the phase information is not as much important as the magnitude information in a speech spectrum, the real cepstrum is used due to its computational easiness [8]. The first M samples where M is the number of chan- nels allotted to specifying spectral envelope information [9], typically first 2.5 ms to 5 ms duration, of the cep- strum of a speech segment represent the vocal tract re- sponse while the remaining samples represent the glottal excitation signal. A simple windowing process using a rectangular window separates the vocal tract response from the glot- tal excitation signal in the quefrency domain. The inverse process of cepstrum involving exponen- tiation obtains these signals in time domain. 1.4.2. Linear Prediction Technique Linear prediction technique is a system modeling tech- nique that models the vocal tract response in a given speech segment as an all-pole linear filter with transfer function of the form G H(z)= -------------------------- P 1+ap(k)zk k=1 where G is dc gain of the filter, p is the order of the filter, ap(k), k=1,2,...p are the filter coefficients, leaving out the glottal excitation as the residual of the process [4]. Thus the LP technique separates the vocal tract response from the glottal excitation. The various formulations of linear prediction tech- nique are 1) the covariance method 2) the autocorrela- tion method 3) the lattice method 4) the inverse filter formulation 5) the spectral estimation formulation 6) the maximum likelihood formulation and 7) the inner prod- uct formulation [4,14]. In this paper the filter coefficients and the dc gain were estimated from speech samples via the autocorrela- tion method by solving the so-called Yule-Walker equa- tions with the help of Levinson-Durbin recursive algo- rithm [11,14]. 2. DATA ACQUISITION & SIGNAL PRE-PROCESSING Adult subjects, 52 subjects (11 females and 41 males) with distorted sound, 41 subjects (3 females and 38 males) with prolonged sound, 12 subjects (all males) with stam- mering, 9 subjects (1 female and 8 males) with omissions and 5 (all males) with substitutions were selected. They were asked to spell the phonemes “a” as in “male”, “ee” as in “speech”, “p” as “pet”, “aa” as in “Bob” and “o” as in “boat”. These speech signals were recorded using a Pentium-IV computer with 2 GB RAM, 160 GB HDD, PC-based microphone, 16-bit sound card, and free audio recording and editing software at a sampling rate of 8 KHz. These signals hereafter will be referred to as  G. Ravindran et al. / J. Biomedical Science and Engineering 3 (2010) 85-94 SciRes Copyright © 2010 JBiSE 89 Source e(n) (lungs+vocal cards) Filter h(n) (normal vocal tract response ) Normal speech segment s(n)=e(n)*h(n) Figure 7. Source-filter model of a normal human speech mechanism. Source e(n) (lungs+vocal cards) Filter h d (n) (degraded vocal tract response) Degraded speech segment s d (n)=e(n)*h d (n) Figure 8. Source-filter model of a degraded human speech mechanism. Degraded speech segment s d (n)=e(n)*h(n)*g(n) =e(n)*h d (n) Normal speech segment s(n)=e(n)*h(n) Filter h(n) (normal vocal tract response) Degrading system g(n) Source e(n) (lungs+vocal card) Figure 9. Source-filter model of a degraded human speech mechanism with degradation as separate system. Cepstrum of normal speech segment s/(n)=e/(n)+ h /(n) (/ means cepstrum) Normal speech segment s(n)=e(n)*h(n) Real Cepstrum Figure 10. Cepstrum of normal speech segment. Cepstrum of degraded speech segment s d/ (n)= e / (n ) +h d/ (n) =e / (n)+h / (n)+g / (n) ( / means cepstrum ) Degraded speech segment s d (n)=e(n)*h d (n) =e(n)*h(n)*g(n) Real Cepstrum Figure 11. Cepstrum of degraded speech segment. Degraded speech segment s d (n) Inverse model of g(n) Restored speech segment s r (n) Figure 12. Restoring normal speech segment from degraded speech segment via inverse model of degradation.  90 G. Ravindran et al. / J. Biomedical Science and Engineering 3 (2010) 85-94 SciRes Copyright © 2010 JBiSE impaired speech signals or utterances in the text. Same number (119) of normal subjects of similar age and sex were selected and asked to spell the same set of phonemes. These signals were recorded under similar conditions and will hereafter be referred to as normal speech signals or utterances in the text. These signals were then lowpass-filtered to 4 KHz to avoid any spectral leakage. The arithmetic mean of each filtered signal was sub- tracted from it in order to remove the DC offset, an arti- fact of the recording process [12]. The speech portion of each speech signal was ex- tracted from its background using an endpoint detection algorithm explained in [13]. 3. METHODS Three methods were developed, all being based on the source-filter model of the human speech mechanism. The first two methods were based on the cepstral tech- nique and the third method was based on the Linear Pre- diction Coding (LPC) technique. In all these three method, the speech was assumed to be the linear convo- lution of the slowly varying vocal tract response, and the fast varying glottal excitation [4,5,8,9]. 3.1. Method 1 This method was based on the following facts: 1) Though non-stationary, speech signal can be considered as sta- tionary for a short period of 20-40 ms [3,4], 2) Speech is a convolution of two signals: the glottal excitation signal and the vocal tract response [4], 3) The excitation signal generally exhibits the speaker characteristics such as pitch and loudness while the vocal tract response deter- mines the sound produced [5] and 4) Cepstrum trans- forms a convolution process into an addition process [8]. 1) and 2) make the short-term analysis of speech sig- nal possible and model a normal human speech mecha- nism as a linear filter excited by a source as shown in Figure 7. Similarly a disabled human speech mechanism with an impaired vocal tract is modeled as shown in Figure 8. If the degraded vocal tract is modeled as the normal vocal tract followed by a degrading system, then the above source-filter model can be equivalently repre- sented as shown in Figure 9. As suggested by 4), the cepstrum of normal speech segment would be the addition of the cepstrum of nor- mal vocal tract response and the cepstrum of excitation as shown in Figure 10. Similarly for an impaired speech segment the cepstral deconvolution of degraded speech segment is shown in Figure 11. As suggested by 3), if the speech segment, in both cases, represents a similar sound unit (e.g., a similar phoneme), then the hd /(n) can be represented in term of h/(n) from Figure 9 to Figure 11 as follows hd(n)=h(n)*g(n) hd /(n)=h/(n) +g/(n) Subtraction of the cepstrum of normal vocal tract from the cepstrum of degraded vocal tract for a similar sound unit yields the cepstrum of degradation as follows g/(n)=hd /(n)h/(n) The inverse cepstrum of g/(n) yields the degradation in time domain, g(n). The inverse model of g(n) is ob- tained as the reciprocal of autoregressive or all-pole model of g(n) obtained via the Levinson-Durbin algo- rithm. The speech segment is restored by passing the de- graded speech segment through the inverse model of the degradation as shown in Figure 12. Figure 13 shows a complete block diagram represen- tation of the entire method of restoring the speech via the inverse model of the degradation. 3.2. Method 2 Method 2 was based on the same set of facts as Method 1. In this method, the degraded vocal tract response, hd(n) for a particular phoneme from a disabled speech mecha- nism is replaced by the normal vocal tract response, h(n) for the same phoneme from a normal speech mechanism. The extraction of the vocal tract responses and recon- structing the speech of improved intelligibility and audi- bility is done using cepstral technique. The cepstrum of a speech segment consists of the glottal excitation signal that occupies the low quefrency region and the vocal tract response that occupies the high quefrency region [8]. The first M samples where M is the number of channels allotted to specifying spectral envelope infor- mation [9], typically first 2.5 ms to 5 ms duration, of the cepstrum of a speech segment represent the vocal tract response while the remaining samples represent the glottal excitation signal. A simple windowing process using a rectangular window separates the vocal tract response from the glottal excitation signal in the que- frency domain [8]. The block diagram representation of the second method has been shown in Figure 14. 3.3. Method 3 Method 3 was based on the following facts: 1), 2) and 3) were the same and 4) A speech segment of short duration, e.g., 10-40 ms can be effectively represented by an all-pole filter of order p [14], which is often chosen to be at least 2*f*l/c where f is the sampling frequency, l is the vocal tract length and c is the speed of sound [7,14]. For a typical male utterance with l=17 cm and c=340 m/s, p=f/1000. These filter coefficients were estimated through linear predictive analysis for a speech segment of short duration, e.g., 10-40 ms. The excitation signal is  G. Ravindran et al. / J. Biomedical Science and Engineering 3 (2010) 85-94 SciRes Copyright © 2010 JBiSE 91 Restored speech segment s r ( n ) Cepstrum of normal vocal tract response h d/ (n)=h / (n)+g / (n) Cepstrum of normal vocal tract response h / (n) + Cepstrum of normal speech segment s / (n)=e / (n )+h / (n) ( / means cepstrum) Normal speech segment s(n)=e(n)*h(n) Real Cepstrum Short pass liftering Cepstrum of degraded speech segment s d/ (n)=e / (n)+h d/ (n) =e / (n)+h / (n)+g / (n) Degraded speech segment s d (n)=e(n)*h d (n) =e(n)*h(n)*g(n) Inverse Cepstrum Cepstrum of degradation g / (n) Inverse model of degradation g(n) Real Cepstrum Short pass liftering Figure 13. Block diagram representation of Method 1. obtained either by passing the speech segment through this filter or by synthesizing with estimated pitch period, gain and voicing decision for that segment [14,4]. Here the former is utilized. Thus the linear predictive analysis splits a speech segment into excitation and vocal tract response [14,4]. The first two assumptions make the short-term analy- sis of speech signal possible and model both the normal and disabled human speech mechanisms as described for Method 1 & 2. As suggested by 4), both the normal and impaired speech can be split into excitation and vocal tract re- sponse. As suggested by 3), the LP coefficients of the normal speech segment in the place of those of the impaired speech segment are used while the excitation is obtained either from the LP residual for the impaired speech seg- ment or from synthesis from pitch period, gain and voicing decision estimated from the impaired speech segment. Here the former is utilized Here the degraded vocal tract response, hd(n) for a particular phoneme from a disabled speech mechanism, obtained via the LPC technique, is replaced by the nor- mal vocal tract response, h(n) for the same phoneme from a normal speech mechanism obtained via the LPC technique. The glottal excitation from the degraded (impaired) speech is obtained via the LPC technique as the linear prediction residual [14,4]. The block diagram representation of the method has been depicted in Figure 15. 4. IMPLEMENTATION In all three methods, the speech portions from both the normal and degraded phonemes were extracted using the algorithm in [13] and the normal utterance was time- scaled to match the length of the impaired utterance us- ing the modified phase vocoder [15]. Then each utter-  92 G. Ravindran et al. / J. Biomedical Science and Engineering 3 (2010) 85-94 SciRes Copyright © 2010 JBiSE Restored speech segment s r (n) + + Cepstrum of degraded speech segment s d / (n)=e / (n)+h d / (n) ( / means cepstrum) Cepstrum of normal speech segment s d / (n)=e / (n)+h / (n) ( / means cepstrum) Short pass lifter Cepstrum of normal vocal tract response h / (n) Long pass lifter Cepstrum of excitation e / (n) Inverse ce p stru m Figure 14. Block diagram representation of Method 2. Restored Speech segment Linear Predictive Analysis Normal speech segment LP coefficients Linear Predictive Analysis Degraded Speech se g ment LP coefficients LP residual Figure 15. Block diagram representation of Method 3. ance was segmented into short frames of 20 msec dura- tion overlapping by 5 msec. In Method 1 & 2, both the frames were preemphasised to cancel the spectral contributions of the larynx and the lips to the speech signal using H(z) = 1z1 with = 0.95 [7,12]. Then the cepstra of both the frames were computed [8,9]. In Method 1, the first 40 samples of the cepstrum of the normal speech frame were subtracted from those of the cepstrum of the degraded speech frame to extract the cepstrum of the degrading function. The inverse cep- strum of the resultant yielded the degrading function which was then modeled as an all-pole filter. The inverse of the model was then used to restore the speech. In Method 2, the first 40 samples of the cepstrum of the degraded speech frame were replaced by those of the cepstrum of the normal speech frame. In Method 3, after segmentation, the frames were preemphasised and their autocorrelations were computed. The resultant autocorrelations were used to compute the LPC coefficients using Levinson-Durbin recursive algo- rithm. Then the LPC coefficients computed from the degraded speech frame and the frame itself were used to compute the LPC residues. These LPC residues and The LPC coefficients computed from the normal speech frame were used to synthesize the restores speech frame.  G. Ravindran et al. / J. Biomedical Science and Engineering 3 (2010) 85-94 SciRes Copyright © 2010 JBiSE 93 All the above steps were repeated for all frames and for all phonemes. MATLAB 7 was used for program- ming purposes. 5. COMPARISON OF METHODS The main advantage of these three methods was that the restored speech had the speaker characteristics since the excitation from the distorted sound was used for restora- tion as the excitation (the glottal impulse) exhibits mainly the speaker characteristics while the vocal tract response (the articulation) gives rise to various phonetic realization. All the three methods worked acceptably well with certain articulation impairment such as distorted sound & prolonged sound. All the three methods suffered from a basic problem, the phonetic mismatching. That is, the process of matching the respective phonemes in the normal and impaired utterances lacks the accuracy due to the fact that the duration of a phoneme in a syllable or a word from two different speakers may not be equal and also its articulation and temporal-spectral shape varies with respect to the preceding and succeeding phones. More- over, the dynamic time warping techniques used to match two similar time-series may not be used to match the normal and the distorted strings, though they are the same utterances, since they are not ‘similar’, one being normal and the other, distorted. All the three methods did not suit for all the speech impairments. For example they did not help solving cer- tain common impairments such as stammering, omis- sions, substitutions. Method 1 & 2 suffered from the fact that the real cep- strum is not invertible; only a minimum phase recon- struction is possible. The phase information was lost. Method 1 suffered from the problem of extracting the degradation exactly since the vocal tract response for a phoneme independently obtained from two speakers do not match sample vice. Hence subtracting the first 25 samples of the cepstrum (representing the normal vocal tract response) of normal speech segment from those (representing the degraded vocal tract response) of im- paired speech segment may not exactly give the degra- dation in the vocal tract response of the impaired subject. The LP coefficients do not represent the vocal tract response independently of speakers. Hence the restored sound possessed the quality of both of the speakers, the normal and the problem but more towards the problem speaker and less towards the normal speaker. 6. RESULT In order to assess the result of the above experiments, one thousand observers (500 females and 500 males) of different age group varying from 20 to 40 were selected and requested to listen to the degraded, normal and re- Table 1. Votes of favour for subjects with dis- torted sound: Total No. of Votes=521000. Bad Good Excellent “a” in “male” 2080 46904 3016 “ee” in “speech” 1976 46956 3068 “p” in “pet” 5304 46644 156 “aa” in “Bob” 1144 49452 1404 “o” in “boat” 520 50076 1404 Table 2. Votes of favour for subjects with pro- longed sound: Total No. of Votes=411000. Bad Good Excellent “a” in “male” 820 39360 820 “ee” in “speech” 2747 37761 492 “p” in “pet” 6150 34850 0 “aa” in “Bob” 2132 37392 1517 “o” in “boat” 369 39360 1271 Table 3. Votes of favour for subjects with stam- mering: Total No. of Votes=121000. Bad Good Excellent “a” in “male” 9612 1800 588 “ee” in “speech” 9612 1800 588 “p” in “pet” 11856 144 0 “aa” in “Bob” 10680 1200 120 “o” in “boat” 1200 10800 - Table 4. Votes of favour for subjects with omis- sions: Total No. of Votes=91000. Bad Good Excellent “a” in “male” 8982 18 - “ee” in “speech” 8955 45 - “p” in “pet” 9000 - - “aa” in “Bob” 8982 18 - “o” in “boat” - - -  94 G. Ravindran et al. / J. Biomedical Science and Engineering 3 (2010) 85-94 SciRes Copyright © 2010 Table 5. Votes of favour for subjects with substitu- tions: Total No. of Votes=51000. [2] (2002) Department of Education, Special education pro- grams and services guide, State of Michigan State. [3] Shuzo, S. and Kazuo, N. (1985) Fundamental of Speech Signal Processing. Academic Press, London. BadGood Excellent “a” in “male” 5000- - “ee” in “speech” 5000- - “p” in “pet” 5000- - [4] Rabiner, L.R. and Schafer, R.W. (1978) Digital process- ing of speech signal, Prentice-Hall, Engliwood Cliffs, NJ. [5] Rabiner, L.R. and Juang, B.H. (1993) Fundamentals of speech recognition, Prentice-Hall, Engliwood Cliffs, NJ. [6] Rabiner, L.R. and Bernard, G. (1992) Theory and appli- cation of digital signal processing, Prentice-Hall of India, New Delhi, Chapter 12. [7] Thomas, F.Q. (2004) Discrete-time speech signal proc- essing. Pearson Education, Singapore. stored phonemes and to rate them as bad, good or excel- lent in terms of their intelligibility and audibility. The votes obtained in favour was tabulated as shown in Ta- bles 1, 2, 3, 4, & 5. [8] Oppenheim, A.V. and Schafer, R.W. (1992) dis- crete-time signal processing, Prentice-Hall of India, New Delhi. [9] Oppenheim, A.V. (1969) Speech analysis-synthesis based on homomorphic filtering, Journal of Acoustic So- ciety of America, 45, 458-465. 7. CONCLUSIONS [10] Oppenheim, A.V. (1976) Signal analysis by homomor- phic prediction. Proc. IEEE, ASSP, 24, 327. The future development of this research work, thus, will be focused on developing 1) a formant-based technique and 2) a homomorphic prediction-based technique with complex cepstrum since real cepstrum lacks in phase information [8,9] and on developing a system for con- tinuous speech i.e., words and sentences. For a real-time continuous speech processing, use of dedicated digital signal processor could be an opt suggestion. [11] Proakis, J. G. and Manolakis, D. G. (2000) Digital Signal Processing, Prentice-Hall of India, New Delhi. [12] Tony, R. (1998) Speech Analysis Lent Term. [13] Nipul, B, Sara, M., Slavinskym J.P. and Aamirm V. (2000) A project on speaker recognition’ rice university. [14] Makhoul, J. (1975) Linear prediction: a tutorial review, Proc. IEEE, 63, 561-580. [15] Jean, L. and Mark, D. (1999) New phase-vocoder tech- niques for pitch-shifting, harmonizing and other exotic effects, Proc. IEEE WASPAA. REFERENCES [1] (2004) NICHCY disability fact sheet., Speech & Lan- guage Impairments. NICHCY. 11. JBiSE |