J. Biomedical Science and Engineering, 2010, 3, 78-82
doi:10.4236/jbise.2010.31011 Published Online January 2010 (http://www.SciRP.org/journal/jbise/
JBiSE
).
Published Online January 2010 in SciRes. http://www.scirp.org/journal/jbise
A new approach for classification of human brain CT
images based on morphological operations
Ali Reza Fallahi1, Mohammad Pooyan1, Hassan Khotanlou2
1Biomedical Engineering Department, Shahed University, Tehran, Iran;
2Computer Engineering Department, Bu-Ali Sina University, Hamedan, Iran.
Email: afallahi@shahed.ac.ir; pooyan@shahed.ac.ir; hkh@basu.ac.ir
Received 5 September 2009; revised 30 September 2009; accepted 8 October 2009.
ABSTRACT
Automatic diagnosis may help to decrease human
based diagnosis error and assist physicians to focus
on the correct disease and its treatment and to avoid
wasting time on diagnosis. In this paper computer
aided diagnosis is applied to the brain CT image
processing. We compared performance of morpho-
logical operations in extracting three types of features,
i.e. gray scale, symmetry and texture. Some classifi-
ers were applied to classify normal and abnormal
brain CT images. It showed that morphological op-
erations can improve the result of accuracy. More-
over SVM classifier showed better result than other
classifiers.
Keywords: CT Image; Feature Extraction; Classification;
Morphological Operations; Automatic Diagnosis
1. INTRODUCTION
Medical CT image has been applied in clinical diagnosis
widely. It can assist physicians to detect and locate
pathological changes, and determine the property of
them. But the diagnosis result is often subjective, differ-
ent physicians may get different diagnosis result at dif-
ferent time [1]. Computer Aided Diagnosis (CAD) aims
to provide a computer output as a second opinion in or-
der to assist physicians in the detection of abnormalities,
quantification of disease progress and differential diag-
nosis of lesions [2].
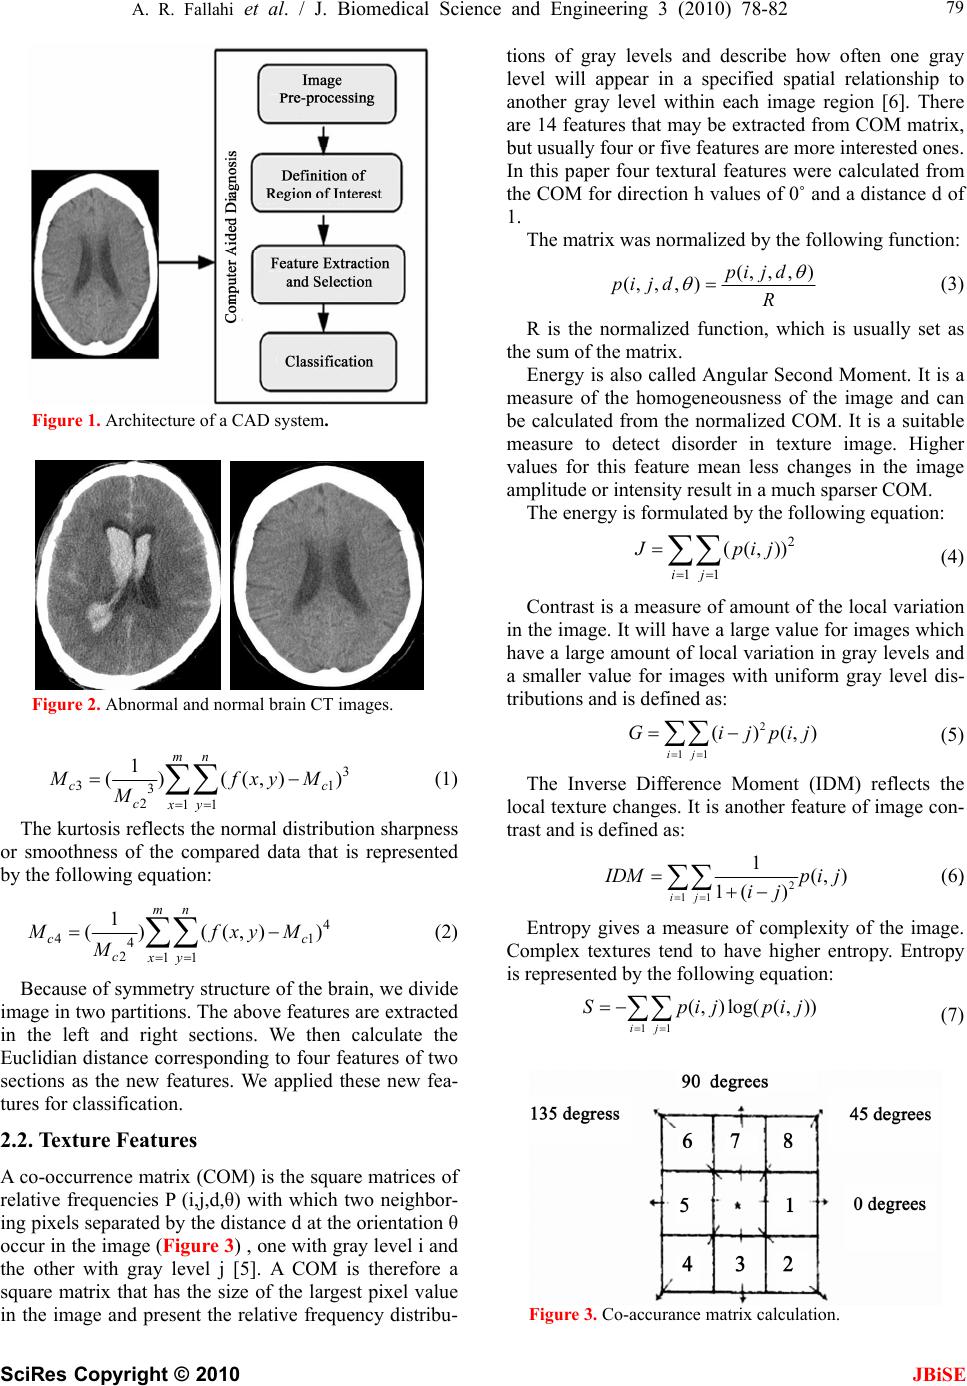
The typical architecture of a CAD system (Figure 1)
includes four main modules: image pre-processing, defi-
nition of region(s) of interest (ROI), extraction and se-
lection of features and classification of the selected ROI
[3].
The aim of image pre-processing is to improve the
quality of data through the application of methods for
denoising such as mean, median, Laplacian and Gaus-
sian filters and enhancing the edges of image structures
such as unsharpening and wavelet transform and en-
hancing image contrast like histogram equalization.
Feature extraction refers to various quantitative meas-
urements of medical images typically used for decision
making related to the pathology of a structure or tissue.
When the features have been extracted, selection of a
subset of the most robust features is essential, aiming at
improving classification accuracy and reducing the
overall complexity. Some methods such as PCA, LDA
and genetic algorithms can be used for this purpose.
One of the major problems of pattern recognition in
medical image analysis is the classification of a set of
features into the proper classes. The main methods in the
brain CT images classification include RBFNN [1], de-
cision tree, See5, inductive learning [4] and Bayesian.
In this paper we applied morphological operations to
the images and then extracted three types of features. We
then evaluated performance of these operations and ex-
tracted features by six types of classifiers.
2. MATERIALS AND METHOD
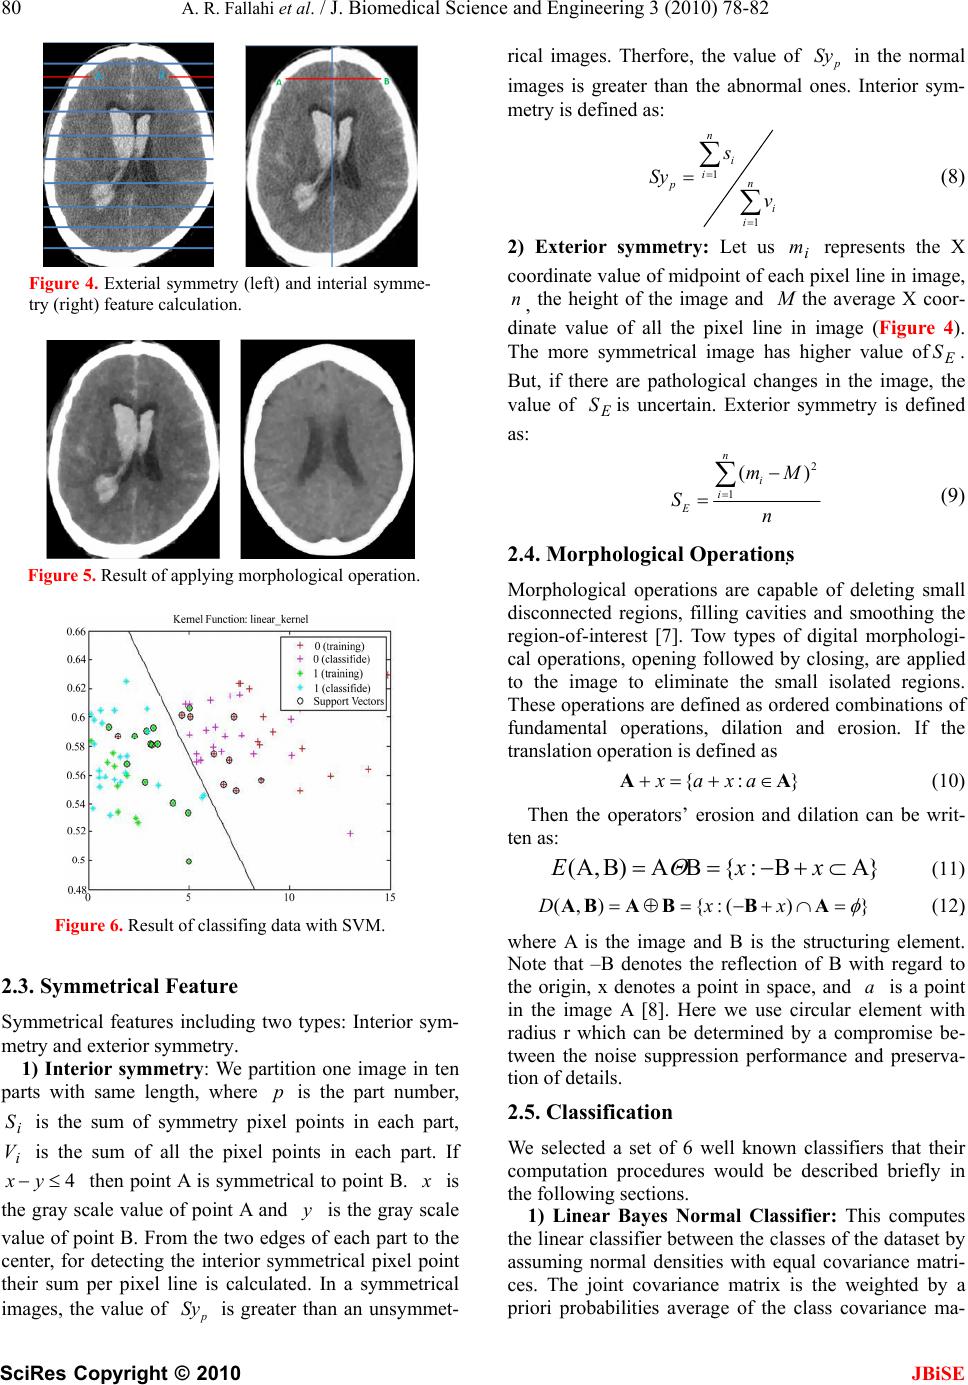
There are lots of diseases that originate in the brain. The
CT image is the lamination cross-sectional image. Dif-
ferent stratification plane images have different patterns.
In order to get the better image analysis, we select one
kind of disease to determine whether it is normal or ab-
normal and to extract features from one plane in the CT
of brain image (Figure 2). The ordinary utilized features
are texture, gray scale, shape and symmetry. Our expe-
riment focuses on texture, symmetry, gray scale and their
formulation.
2.1. Gray Scale Feature
In digital image processing, the two-dimensional digi-
tized gray scale image (M×N) can be seen as M×N pixels
in two-dimensional surface XOY, each pixel (x,y) can be
represented as its gray value. Grayscale features that can
be extracted are mean, variance, skewness and kurtosis.
Among them, the standard variance reflects the separate
degree of gray scale value. The skewness takes the mean
value as the central data distribution. Skewness is repre-
sented by the following equation:
A. R. Fallahi et al. / J. Biomedical Science and Engineering 3 (2010) 78-82
SciRes Copyright © 2010 JBiSE
79
Figure 1. Architecture of a CAD system.
Figure 2. Abnormal and normal brain CT images.
3
3
3
211
1
() ((,)
mn
c
cxy
Mfxy
M

 1
)
c
M (1)
The kurtosis reflects the normal distribution sharpness
or smoothness of the compared data that is represented
by the following equation:
4
4
4
211
1
() ((,)
mn
c
cxy
Mfxy
M
 1
)
c
M (2)
Because of symmetry structure of the brain, we divide
image in two partitions. The above features are extracted
in the left and right sections. We then calculate the
Euclidian distance corresponding to four features of two
sections as the new features. We applied these new fea-
tures for classification.
2.2. Texture Features
A co-occurrence matrix (COM) is the square matrices of
relative frequencies P (i,j,d,θ) with which two neighbor-
ing pixels separated by the distance d at the orientation θ
occur in the image (Figure 3) , one with gray level i and
the other with gray level j [5]. A COM is therefore a
square matrix that has the size of the largest pixel value
in the image and present the relative frequency distribu-
tions of gray levels and describe how often one gray
level will appear in a specified spatial relationship to
another gray level within each image region [6]. There
are 14 features that may be extracted from COM matrix,
but usually four or five features are more interested ones.
In this paper four textural features were calculated from
the COM for direction h values of 0˚ and a distance d of
1.
The matrix was normalized by the following function:
R
djip
djip ),,,(
),,,(
(3)
R is the normalized function, which is usually set as
the sum of the matrix.
Energy is also called Angular Second Moment. It is a
measure of the homogeneousness of the image and can
be calculated from the normalized COM. It is a suitable
measure to detect disorder in texture image. Higher
values for this feature mean less changes in the image
amplitude or intensity result in a much sparser COM.
The energy is formulated by the following equation:
2
11
((,))
ij
J
pi j

(4)
Contrast is a measure of amount of the local variation
in the image. It will have a large value for images which
have a large amount of local variation in gray levels and
a smaller value for images with uniform gray level dis-
tributions and is defined as:
2
11
()(,
ij
Gijp

 )ij
(5)
The Inverse Difference Moment (IDM) reflects the
local texture changes. It is another feature of image con-
trast and is defined as:
2
11
1(, )
1( )
ij
I
DMp ij
ij


 (6)
Entropy gives a measure of complexity of the image.
Complex textures tend to have higher entropy. Entropy
is represented by the following equation:
11
(, )log((, ))
ij
Spijpi

 j
(7)
Figure 3. Co-accurance matrix calculation.
80 A. R. Fallahi et al. / J. Biomedical Science and Engineering 3 (2010) 78-82
SciRes Copyright © 2010
JBiSE
Figure 4. Exterial symmetry (left) and interial symme-
try (right) feature calculation.
Figure 5. Result of applying morphological operation.
Figure 6. Result of classifing data with SVM.
2.3. Symmetrical Feature
Symmetrical features including two types: Interior sym-
metry and exterior symmetry.
1) Interior symmetry: We partition one image in ten
parts with same length, where is the part number,
is the sum of symmetry pixel points in each part,
is the sum of all the pixel points in each part. If
then point A is symmetrical to point B.
p
i
S
i
V
4xy
x
is
the gray scale value of point A and is the gray scale
value of point B. From the two edges of each part to the
center, for detecting the interior symmetrical pixel point
their sum per pixel line is calculated. In a symmetrical
images, the value of
y
p
Sy is greater than an unsymmet-
rical images. Therfore, the value of in the normal
images is greater than the abnormal ones. Interior sym-
metry is defined as:
p
Sy
1
1
n
i
in
p
i
i
s
Sy
v
(8)
2) Exterior symmetry: Let us represents the X
coordinate value of midpoint of each pixel line in image,
, the height of the image and
i
m
n
M
the average X coor-
dinate value of all the pixel line in image (Figure 4).
The more symmetrical image has higher value of.
But, if there are pathological changes in the image, the
value of is uncertain. Exterior symmetry is defined
as:
E
S
E
S
2
1
()
n
i
i
E
mM
Sn
(9)
2.4. Morphological Operations
Morphological operations are capable of deleting small
disconnected regions, filling cavities and smoothing the
region-of-interest [7]. Tow types of digital morphologi-
cal operations, opening followed by closing, are applied
to the image to eliminate the small isolated regions.
These operations are defined as ordered combinations of
fundamental operations, dilation and erosion. If the
translation operation is defined as
}:{ AA
axax (10)
Then the operators’ erosion and dilation can be writ-
ten as:
}AB:{BA)B,A(  x
xE
(11)
})(:{),(
A
BBABA xxD (12)
where A is the image and B is the structuring element.
Note that –B denotes the reflection of B with regard to
the origin, x denotes a point in space, and is a point
in the image A [8]. Here we use circular element with
radius r which can be determined by a compromise be-
tween the noise suppression performance and preserva-
tion of details.
a
2.5. Classification
We selected a set of 6 well known classifiers that their
computation procedures would be described briefly in
the following sections.
1) Linear Bayes Normal Classifier: This computes
the linear classifier between the classes of the dataset by
assuming normal densities with equal covariance matri-
ces. The joint covariance matrix is the weighted by a
priori probabilities average of the class covariance ma-
A. R. Fallahi et al. / J. Biomedical Science and Engineering 3 (2010) 78-82
SciRes Copyright © 2010 JBiSE
81
Table 1. Accuracy of classifiers without morphological operations.
Table 2. Accuracy of classifiers with morphological operations.
Table 3. Result of other papers.
trices. The covariance matrix of the classes is then de-
composed as G = W*W' + sigma^2 * eye (K), where W
is a K×M matrix containing the M leading principal
components and sigma^2 is the mean of the K-M small-
est eigenvalues. Finally, the classification is computed.
2) Quadratic Bayes Normal Classifier: It also com-
putes the quadratic classifier between the classes of the
dataset, assuming normal densities. The covariance ma-
trix of the classes is then decomposed as G = W*W' +
sigma^2 * eye (K), where W is a K×M matrix, contain-
ing the M leading principal components and sigma^2 is
the mean of the K-M smallest eigenvalues. The classifi-
cation is then performed.
3) K-NN Classifier: It computes the common K-
nearest neighbor classifier for the dataset.
4) Decision Tree: It computes a decision tree classi-
fier out of a dataset using a binary splitting criterion.
5) Back Propagation Neural Classifier: A feed-
forward neural network classifier with five and ten hid-
den units in the second layer that number of input neu-
rons depends on number of features and hidden neurons
are selected manually is computed for the dataset.
6) SVM (Support Vector Machines): SVM is a new
classification method for both linear and nonlinear data.
It uses a nonlinear mapping to transform the original
training data into a higher dimension. With the new di-
mension, it searches for the linear optimal separating
hyperplane. SVM finds this hyperplane using support
vectors (“essential” training tuples) and margins that
defined by the support vectors (Figure 5). With an ap-
propriate nonlinear mapping to a sufficiently high di-
mension, data from two classes can always be separated
by a hyperplane.
3. RESULTS
To evaluate the method, we used 88 images, which 44
images are normal and the remaining is abnormal. We
selected 70% of dataset as training data and 30% as test-
ing data. Table 1 and 2 shows the result of classifiers for
two cases: features with morphological operation and
features without them. We extracted symmetry, gray
scale and texture features with dimension of 10, 4 and 5
respectively. We used a toolbox written for MATLAB
named PRTools. This toolbox consists of a complete and
useful set of functions for pattern recognition and in-
cludes most of the well known classification algorithms
[11].
Most of the classifiers showed that the morphological
operations improve results in using symmetry and gray
scale features and all of them showed reduction results
in texture feature that can be caused by reduction of sta-
tistical variation in the image because of applying mor-
phological operations. Table 1 and 2 show that the result
of SVM is more accurate than the other classifiers.
When a mixture of the features is used, results are better
than using the features sole except K-NN and Decision
Classes SymmetryGrayscaleTexture total
1 : Bayes-Normal-(Quadratic) 97.75 66.75 59 98.5
2 : Bayes-Normal-(linear) 99.25 67.75 67.5 99.25
3 : K-NN Classifier 98.5 66.75 37.25 45.2
4: Decision Tree 89.25 54 62.75 83
5 hidden neuron 93 74 79 95
5:BP N N 10 hidden neuron 97 73 67 90
6:SVM 97 88 90 100
Classes SymmetryGrayscaleTexture total
1 : Bayes-Normal-(Quadratic) 98.5 58.25 61.25 100
2 : Bayes-Normal-(linear) 99.25 70 64 100
3 : K-NN Classifier 100 65.75 45.25 45
4: Decision Tree 91.25 45.75 54 88.75
5 hidden neuron 100 85 75 97
5:BP NN 10 hidden neuron96 81 65 95
6:SVM 97 90 86 100
Author classifier Symmetry Grayscale Texture Total
See5 85-95 72-76 75-78 90-94
Zhang et.al RBF NN 85-89 72-75 62-65 83-86
See5 85-93 - 75-78 -
RBF NN 85-89 - 67-71 -
Wang et.al Outlier
Detection 91-98.5 - 76-80 -
82 A. R. Fallahi et al. / J. Biomedical Science and Engineering 3 (2010) 78-82
SciRes Copyright © 2010 JBiSE
Tree, that may caused by increasing complexity. Using 5
neurons to run BPNN led better results than using 10
neurons for it. It should be noted that using 10 neurons
may result in overfitting problem that reduces accuracy
of the test. Table 3 shows the result of another works in
this area and we can see that our method, using SVM
and morphological operation can improve these results.
4. CONCLUSIONS
In this study, we applied morphological operations to the
images and then extracted the features. Analysis result
from classifiers shows that these operations can improve
classification result in symmetry and grayscale features
but reduce results in texture features. According to Table
1 and 2, we conclude that by using SVM classifier, we
can classify the patients more accurately into the corre-
sponding groups. Because of the brain symmetrical
structure, symmetrical features have best accuracy. Our
experiments show that texture features have lower accu-
racy. In the future works we can apply another feature
extraction and feature selection techniques to improve
classification accuracy.
REFERENCES
[1] Zhang, W.L. and Wang, X.Z. (2007) Extraction and
classification for human brain CT images. Proceedings
of Sixth International Conference on Machine learning
and cybernetics, IEEE., 1155-1156.
[2] Stoitsis, J., Valavanis, I., Valavanis, S.G., Golemati, S.,
Nikita, A. and Nikita K.S. (2006) Computer aided diag-
nosis based on medical image processing and artificial
intelligence methods, Nuclear Instruments and Methods
in Physics Research, 569, 591-595.
[3] Haruka, D. and Teruak, A. (2007) Characterization of
spatiotemporal stress distribution during food fracture by
image texture analysis methods. Journal of Food
Engineering, 81, 429-436.
[4] Wang, X.Z. and Lin, W.X. (2007) Application of induc-
tive learning in human brain CT image recognition.
Proceedings of Sixth International Conference on
Machine learning and cybernetics, IEEE., 1155-1156.
[5] Haralick, R.M., Shanmugam, K. and Dinstein, I. (1973)
Textural features for image classification. IEEE
Transactions on Systems, Man, and Cybernetics, SMC-3,
6, 610-621
[6] Haruka, D. and Teruak, A. (2007) Characterization of
spatiotemporal stress distribution during food fracture by
image texture analysis methods, Journal of Food Engin-
eering, 81, 429-436.
[7] Giardina, C.R. and Dougherty, E.R. (1988) Morpholo-
gical Methods in Image and Signal Processing. Engle-
wood Cliffs, NJ, Prentice–Hal.
[8] Chen, C.W., Luo, J. and Parker, K.J. (1998) Segmen-
tation via adaptive K-Mean clustering and knowledge-
based morfological operations with biomedical applica-
tions, IEEE Trans, Image Processing, Vol. 7, 12, 1673-
1683.
[9] Mitchell, T.M.(2003) Machin learning. China Machine
Press, Beijing.
[10] Mandayam, S. and Policar, R. Artificial neural networks.
Lecture Note.
[11] Duin, R.P.W., Juszczak, P., Paclik, P., Pekalska, E., de
Ridder, D. and Tax, D.M.J. (2004) A matlab toolbox for
pattern recognition. PRTools4, Delft University of Tech-
nology.