J. Biomedical Science and Engineering, 2010, 3, 52-58
doi: 10.4236/jbise.2010.31008 Published Online January 2010 (http://www.SciRP.org/journal/jbise/
JBiSE
).
Published Online January 2010 in SciRes. http://www.scirp.org/journal/jbise
Modelling the inhalation of drug particles in a human nasal
cavity
Kiao Inthavong, Jian Wen, Ji-Yuan Tu*
School of Aerospace, Mechanical and Manufacturing Engineering, RMIT University, Bundoora, Australia.
Email: jiyuan.tu@rmit.edu.au
Received 6 August 2009; revised 25 October 2009; accepted 27 October 2009.
ABSTRACT
A human nasal cavity was reconstructed from CT
scans to make a Computational Fluid Dynamics
(CFD) model. With this model, fluid flow and inhala-
tion of aerosol analysis can be investigated. The sur-
face of the interior nasal cavity is lined with highly
vascularised mucosa which provides a means for di-
rect drug delivery into the blood stream. Typical
sprayed particles from a nasal spray device produce
a particle size distribution with a mean diameter of
50μm, which leads to early deposition due to inertial
impaction. In this study low-density drug particles
and submicron particles (including nanoparticles)
are used to evaluate their deposition patterns. It was
found that the low-density particles lightens the par-
ticle inertial properties however the particle inertia is
more sensitive to the particle size rather than the
density. Moreover the deposition pattern for nano-
particles is spread out through the airway. Thus an
opportunity may exist to develop low-density and
nanoparticles to improve the efficiency of drug de-
livery to target deposition on the highly vascularised
mucosal walls.
Keywords: Nasal Airway; Ultrafine, Fibre; Morphology;
CFD; Deposition
1. INTRODUCTION
Nasal drug delivery provides an alternative approach to
traditional delivery methods such as oral drug routes that
fail in the systemic delivery of compounds due to its
dissociation by the digestive system. The nasal airway is
dominated by the nasal turbinates that are lined with
highly vascularised mucosa opening to the paranasal
sinuses. Because of these characteristics it is hypothe-
sised that drug delivery to combat health problems such
as lung diseases, cancers, diabetes, sinus infections etc.
may be viable if the drug formulation can be deposited
in the turbinate region [1].
Despite these advantages, studies have found that tar-
geted drug delivery is inefficient [2,3]. The atomisation
of the drug formulation produces a mean droplet size of
50μm [4] which exhibits high inertia. This leads to a
large proportion of particles impacting in the anterior
regions of the nasal cavity. Most drug formulations have
close to unit density as they are suspensions in aqueous
solutions. Lighter porous drug particles have been de-
veloped for pulmonary delivery [5], where the drug par-
ticle sizes are in the low micron to sub-micron range and
deposition is targeted at the pulmonary airways that ex-
hibit much smaller spaces such as the airway branches in
the lungs. Another alternative is the use of engineered
nanoparticles which exhibit a large surface area to size
ratio leading to greater biologic activity. This increased
biologic activity can be exploited for targeted drug and
gene delivery, tissue engineering, cell tracking and bio-
separation [6,7]. One advantage for nasal drug delivery
is its extremely small size which would allow the parti-
cles to deposit through diffusion rather than inertial im-
paction. Thus an opportunity exists for the development
of new porous-based particles and/or nano-sized parti-
cles for nasal drug delivery.
Computational Fluid Dynamics (CFD) simulations
have evolved into a feasible alternative to complement
experimental data. For example CFD simulations for
airflow patterns [8,9,10] have complemented experi-
mental results [11] by confirming regions of vortices
within the nasal vestibule, the olfactory region and pos-
terior to the nasal valve. Simulations for particle deposi-
tion however, are fewer in numbers. Spherical particle
deposition under conditions related to pharmaceutical
nasal spray applications has been studied [3]. Particles in
the range of 10 µm to 50 µm subjected to a breathing
flow rate of 20L/min found that a large proportion of
particles deposited in the anterior third of the nasal cav-
ity which were attributed to the injected particles exist-
ing in a high inertial regime. On the other hand nano-
sized particles in the nasal cavity under laminar condi-
tions were simulated [12] which found that diffusion was
the dominant deposition mechanism for the smallest
range of particles (1–30 nm).
K. Inthavong et al. / J. Biomedical Science and Engineering 3 (2010) 52-58
SciRes Copyright © 2010 JBiSE
53
Human nasal cavity
i) CT scan
ii) Image processing
iv) Surface
reconstruction
iii) Segmentation
2D images
Gray value
Binary volume data
Closed polygonal surface
Figure 1. Steps in the construction of the computational model.
Figure 2. Different views of the computational model. Three coronary slices
and the inlet show the internal mesh with a dense region near the walls.
A human nasal cavity was reconstructed from CT
scans and a computational model developed for particle
flow analysis within the airway. This study presents the
use of CFD techniques to investigate the airflow patterns
and deposition of low density and nano-sized particles for
drug delivery in a human nasal cavity. The nasal airway
was chosen for investigation as it is one of the major en-
tries into the respiratory system which can be penetrated
to reach the blood streams. With this in mind, it is antici-
pated that this research will assist in new designs of
aerosols and particulates and also help to guide practical
clinical tests for toxicological and therapeutic studies.
2. METHOD
The model reconstruction involved four main steps
(Figure 1): 1) CT images acquisition; 2) image process-
ing and editing to improve the quality of the image
volume; 3) segmentation; and 4) surface reconstruction.
CT images of a 25 yr-old Asian male (75kg, 170cm)
provided a 3D matrix of volume elements (voxels), in
which different tissues and structures having different
attenuation characteristics were distinguished from one
another by differences in brightness or greyscale.
2.1. Image Processing
The scan was performed using a CTI Whole Body
Scanner (General Electric). The single-matrix scanner
was used in helical mode with 1-mm collimation, a
40-cm field of view (FOV), 120 kV peak and 200 mA to
produce contiguous images (slices) of 1-mm thickness
K. Inthavong et al. / J. Biomedical Science and Engineering 3 (2010) 52-58
SciRes Copyright © 2010 JBiSE
54
Left Cavity Right Cavity
Figure 3. Path streamlines in the left and right cavities.
with voxel size 0.25×0.25×1 mm. The original set of CT
images is converted into a file format compatible with
the package MegaWave2 (MW2), by means of C lan-
guage self-developed routines. The conversion program
also performs an image enhancement, by rescaling the
grey-level histogram to 1-200 and remapping the image
volume to an 8-bit/pixel depth file.
A 3D convolution with a Gaussian kernel was used to
reduce the background noise present in the images. Be-
cause of its isotropic shape, the Gaussian filter has opti-
mal properties such as smoothing mask, removing
small-scale texture and noise, which could alter the re-
gional segmentation, without distorting lower spatial
frequencies. Filtering was applied in three dimensions in
order to obtain a smoothed CT image volume also along
the axial direction. Such a procedure attenuates the spa-
tial discontinuities among the slices introduced during
acquisition, as an effect of the slice thickness.
2.2. Segmentation & Surface Reconstruction
A 2D segmentation is used to detect and extract, slice by
slice, the walls of the airway. For the segmentation
process, a region growing algorithm, based on the
Mumford and Shah [13] method implemented WM2 is
used. The regional segmentation has been included be-
cause it allows the tracking only of the domains of inter-
est, even in the presence of noise. A first regional seg-
mentation with a greater number of partitioning regions
than necessary is performed on each single slice. This
allows the algorithm to detect the walls even in severely
disturbed images. A threshold binarisation process is
then applied in order to remove sub-regions unrelated to
the airway, which typically present a lower intensity
value with respect to the signal. In this wok, the thresh-
old has been empirically chosen and represents 45% of
the maximum grey-level value of the study. Generation
of a surface or solid model from the 2D contour data
began with the translation of the segmented, modified
and smoothed contour points into a data series that was
read into CAD package used in this study: CATIA. The
contours were lofted to define surface splines which en-
closed the airway volume.
Right cavity Left Cavity
x = 2.6cm from the anterior tip of the nose
Figure 4. Contour plot of axial velocity (x-velocity) com-
bined with cross flow path streamlines (y-z velocity) in the
left and right cavities.
Figure 5. Deposition efficiency vs inertial parameter com-
parisons for the simulation micron spherical particles.
2.3. Adaptive Meshing
The CATIA models were imported into a 3D modelling
program called GAMBIT. An initial model with 82,000
cells was created and used to solve the air flow field at a
flow rate of 7.5 L/min. The original model was refined
by cell adaptation techniques that included refining large
volume cells, cells that displayed high velocity gradients
and near wall refinements. This process was repeated
twice, with each repeat producing a model with a higher
K. Inthavong et al. / J. Biomedical Science and Engineering 3 (2010) 52-58
SciRes Copyright © 2010 JBiSE
55
cell count than the previous model. Subsequently four
models were produced, 82000, 586000, 950000 and 1.44
million cells. A grid independence test found that the
results for average velocity converged at 950,000 cells.
Subsequently the 950,000 cell model was used and is
shown in Figure 2.
2.4. Numerical Method
Due to the complex geometry of the anatomically real
nasal cavity a commercial CFD code, FLUENT, was
used to predict the continuum air phase flow through
solutions of the conservation equations of mass and
momentum. The steady continuity and momentum equa-
tions for the gas phase (air) in Cartesian tensor notation
are:

0
g
gi
i
u
x
(1)
gg
g
gii
jg
j
ij j
p
uu
u
x
xx x





(2)
where
g
i
u is the i-th component of the time averaged
velocity vector and
g
is the air density. These equa-
tions were discretised using the finite volume approach.
The third order accurate QUICK scheme was used to
approximate the momentum equation whilst the pres-
sure-velocity coupling was realized through the SIMPLE
method. To be consistent with experimental data, a con-
stant flow rate of 7.5 L/min. was used to simulate light
breathing. At this flow rate, the flow regime has been
determined to be laminar [11,14]. A steady flow rather
than a cyclic unsteady flow was used in this case to al-
low the results to emphasize the effects of particle mor-
phology on deposition sites independent from cyclic
conditions. Moreover the effects of a periodic inhalation
on the overall flow field are found to be negligible from
the Womersley frequency variable which is used to de-
termine the importance of the fluctuating sinusoidal pat-
tern of the inhalation-exhalation breathing cycle. The
Womersley frequency variable,
0.5
2g
WD

(3)
was calculated as 0.3 where D is the local cross-sectional
distance between the two nasal walls and is about 0.5 cm
in this nasal cavity, g
is the kinematic viscosity of air
and ω is the breathing frequency.
2.5. Drug Particles
For spherical particles the drag force is related to the
drag coefficient which has been studied quite extensively.
The general correlation for smooth spherical particles is
given as [15]:
24 18Re182.367Rew
Dp
C
p
for Re<20 (4)
Table 1. Deposition efficiency based on Figure 5.
Density dae Inertial Parameter (IP) Deposition % present simu-
lation
100 15.8 41,667 67.4%
200 22.4 83,333 95.3%
1000 50.0 416,667 100%
50μm 100 kg/m3
50μm 1000 kg/m3
Figure 6. Deposition pattern for low density particles where ρ = 100kg/m3 and 1000kg/m3.
K. Inthavong et al. / J. Biomedical Science and Engineering 3 (2010) 52-58
SciRes Copyright © 2010 JBiSE
56
where

10
0.820.05 logRe
w
For submicron particles the drag force per unit particle
mass taking the form of Stokes' drag law [16] defined as,
2
18
g
p
Di
ppc
i
F
uu
dC

(5)
Cc is the Cunningham correction factor to Stokes' drag
law. The Brownian force by Li and Ahmadi [17] can be
re-arranged to highlight the diffusion coefficient as:
22
2
1B
B
d
kT
FmtD
(6)
where md is the mass of the particle, T is the absolute
temperature of the fluid, ν is the kinematic viscosity, kB
is the Boltzmann constant, and is the diffusion co-
efficient. Eq.6 is inputted into the user-defined-function
option in Fluent. Additional forces include Saffman's lift
force [18]
D

12
14
2ij
L
pp lkkl
Kd
p
F
vv
ddd


(7)
and the thermophoretic force [19]
1
TT
p
T
FD
mT i

(8)
Particle rebounding from the surfaces was ignored and
particle deposition was determined when the distance
between the particle centre and a surface was less than or
equal to the particle radius.
3. RESULTS AND DISCUSSION
3.1. Airflow Patterns
Path streamlines which act as massless particle tracers to
track the flow path of the inhaled air, were released from
the nostril inlet to provide visualisation of the flow field
(Figure 3). The streamlines in the left nasal cavity at a
flow rate of 7.5L/min show flow separation and reversed
flow in the upper anterior part of the cavity (olfactory
region). This low flow characteristic in the olfactory
region is important as it is a defence mechanism that
prevents particles whose trajectories are heavily de-
pendent on flow patterns from being deposited onto the
sensitive olfactory nerve fibres, while vapours are al-
lowed to diffuse for olfaction. For both cavities, the air
flow squeezes through the nasal valve region, before
decelerating due to the expansion in the cross-sectional
area. The nasal valve region is approximately 2cm from
the nostril inlet.
A cross-sectional area located just immediate of the
anterior nasal valve at 2.6cm was chosen to reflect the
rapid changes in the flow field. The cross-section shown
Figure 7. Deposition efficiency of 1nm-150nm particles
in a human nasal cavity at a steady inhalation rate of
10L/min.
in Figure 4 is from a frontal perspective (positive flow
into the paper). The contours reflect the axial velocity
(x-component of velocity) and are combined with
streamlines of secondary flow (y-z component of veloc-
ity). The red contours are maximum values which repre-
sent the bulk flow regions. For the cross-section located
at 2.6cm from the anterior tip of the nose, two vortices in
the right cavity and one in the left are found. The bulk
flow is found in the middle and upper regions of the both
cavities.
3.2. Deposition of Drug Particles
A parameter used for normalizing impaction-dominant
deposition studies is the inertial parameter, IP given by:
2
ae
I
PQd (9)
where Q is the air flow rate, given in cm3/s and dae is the
aerodynamic diameter given in µm. It is a convenient
parameter that compares deposition against different
flow rates and particle sizes at aerodynamic diameters.
Monodispersed particles in the range of 1-30μm were
released passively (with the airflow) into the nasal cavity
at flow rates of 5, 7.5, 10 and 15L/min. The deposition
of particles over a range of the inertial parameter is
shown in Figure 5 and is compared with other experi-
mental results.
Since the drug particles exhibit different densities,
they can be compared in terms of their aerodynamic
properties (inertia, and settling properties) through the
equivalent aerodynamic diameter, dae defined as:
/1000
aep p
dd
(10)
This means that a small diameter, very dense particle
can have the same aerodynamic as a large diameter, but
less dense particle if their dae are the same.
Particles in the micron particle size range exist in the
inertial regime where deposition by inertial impaction is
K. Inthavong et al. / J. Biomedical Science and Engineering 3 (2010) 52-58
SciRes Copyright © 2010 JBiSE
57
(a) Side view
individual particle deposition
(c) Side view – contours of normalised local regional
deposition
(b) Top view
individual particle deposition
(d) Top view – contours of normalised local regional
deposition
Ni / Nmax
Figure 1. Regional deposition patterns of 1nm particles under a flow rate of 10L/min in a human nasal cavity.
relevant. The idea of low-density porous drug particles
will decrease the particle inertial properties, although
this decrease is not as significant as changing the particle
size. The inertial parameter incorporates both the geo-
metric equivalent spherical diameter along with the par-
ticle density to give the particle aerodynamic diameter
(Eq.12). Thus a larger porous particle will have a
smaller equivalent aerodynamic diameter than a particle
of equal size but with a higher density. The effect of par-
ticle density on the deposition of a 50μm particle is
shown below.
The particle deposition patterns in the nasal cavity in
Figure 6 shows particles with density of 100kg/m3 and
1000kg/m3 for brevity as the deposition pattern for ρ =
200kg/m3 becomes similar to that of ρ = 100kg/m3. For
particles with densities of 100kg/m3 a portion of the par-
ticles deposit superiorly on the septum walls of both
sides of the nasal cavity. This suggests that the fluid flow
is close to the inner septum walls forcing the particles
into this region.
A second concentration of deposited particles oc-
curs at the back of the nasal cavity where the flow
changes directions from horizontal to vertically
downwards. The change in the flow direction causes
the particles to impact in this region. For particles
with density of 1000 kg/m3 deposition is found in the
frontal area with only a small proportion of particles
passing through the nasal valve region. These parti-
cles finally impact onto the superiorly on the septum
wall of the left nasal cavity, however this pattern is
not found in the right nasal cavity.
Deposition of submicron particles (1 to 150nm) was
simulated under a flow rate 10 L/min in order to make
comparisons with experimental data reported by [20]
which found deposition efficiencies for a variety of hu-
man subjects under a flow rate of 10 L/min. The solid
line in Figure 7 corresponds to the CFD model predic-
tion. The deposition curve is high for very small
nanoparticles and the particle diameter range in which
the deposition drops from 72% to 18% is between
1nm-10nm. From 10nm-150nm however, there is only a
small change in the deposition curve from 18%-15%.
This deposition curve profile is characteristic of the
Brownian diffusion, where the particles are so small that
the fluid may no longer be considered continuous. The
trajectory of the nanoparticle is then caused by the colli-
sion of the air molecules and concentration gradients to
produce the random motion.
Local deposition patterns for a 1nm particle are shown
in Figure 8. The deposition pattern of the 1nm particle is
distributed evenly through the nasal cavity where the
diffusion disperses the particles in all directions. The
wall contours in Figure 8(c), (d) show regions of high
concentrations which is determined by the number of
particles that deposit onto a wall face divided the maxi-
mum number of particles that deposit on any one face.
Few particles are able to reach the wider meatus region,
and instead the particles remain close to the nasal septum
wall (inner regions). High concentrations are found at the
upper regions of the cavity with a higher distribution of
deposition within that one area.
In general the deposition pattern is spread out through
the nasal cavity well. This has interesting applications
for drug delivery where traditional nasal sprays are pro-
ducing micron sized droplets that are prone to inertial
deposition. This deposition mechanism leads to high
K. Inthavong et al. / J. Biomedical Science and Engineering 3 (2010) 52-58
SciRes Copyright © 2010 JBiSE
58
inertial impaction (up to 100% for a mean atomised par-
ticle droplet of 50μm) in the anterior region of the nasal
cavity [2,3]. However for high drug efficacy, the deliv-
ery of the droplets needs to be deposited in the middle
regions of the nasal cavity, where the highly vascularised
walls exist. Smaller particles such as 1μm were found to
be less affected by inertial properties, which allowed it
to bypass the anterior region of the nasal cavity. How-
ever because of the particles ability to follow the stream-
lines more readily, the particles were less likely to de-
posit in any region of the nasal cavity and instead by-
passes it completely, leading to the undesired effects of
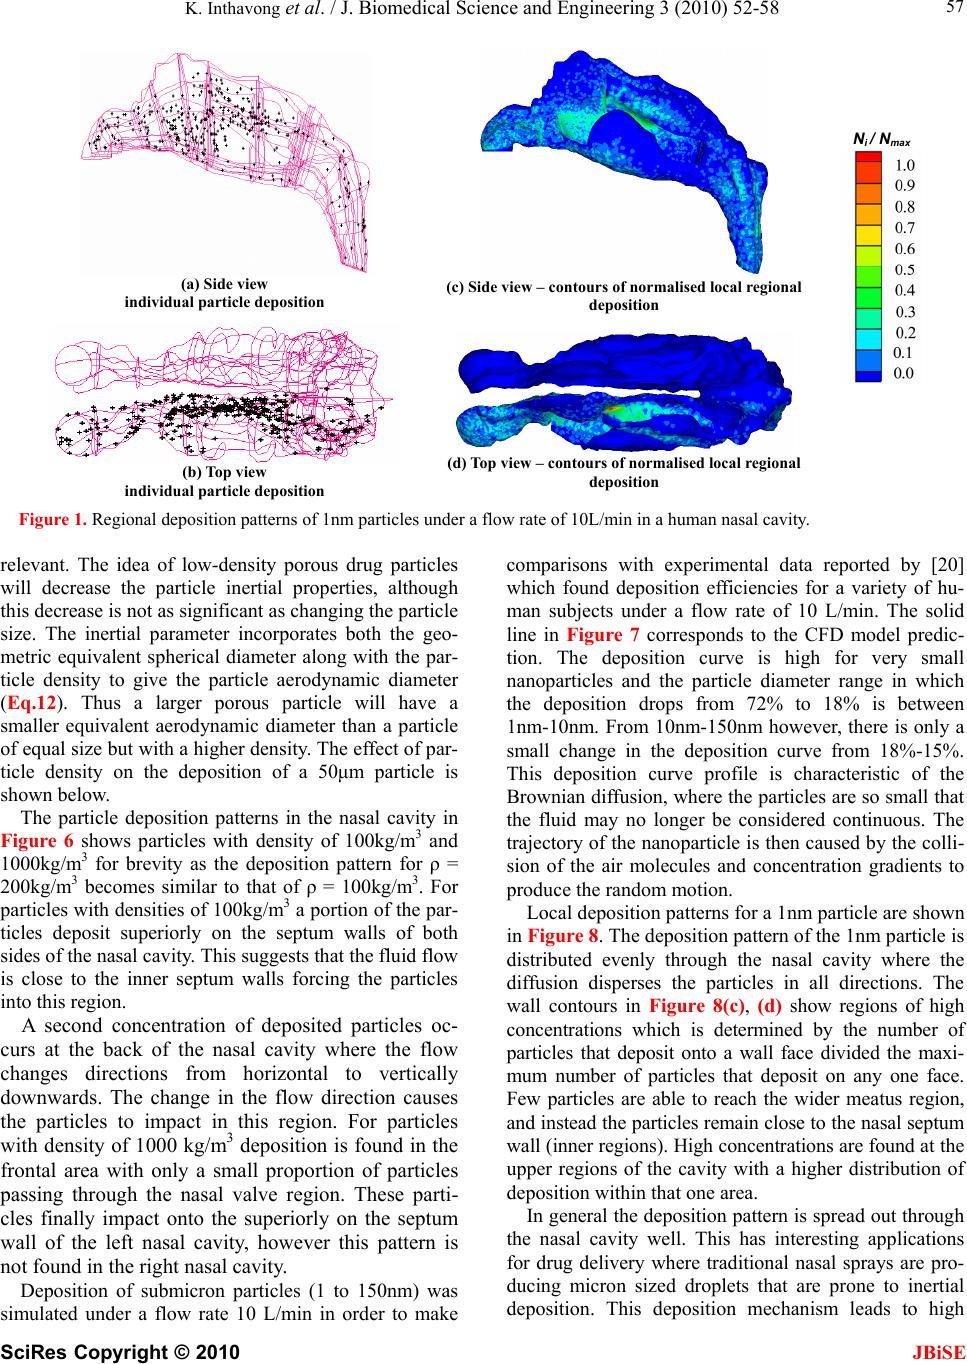
lung deposition. Delivery of nanoparticles especially
1nm-5nm particles therefore, can provide improved
deposition in the middle regions whilst minimising deep
lung deposition.
4. CONCLUSIONS
Simulations of air-particle flows in the nasal cavity
found vortices primarily in the upper olfactory region
and just posterior to the nasal valve where the geometry
begins to expand. This suggests that high inertial parti-
cles are unlikely to reach the sensitive olfactory region.
Multiple secondary flow regions were found in the lower
middle regions within the nasal valve. Low density po-
rous drug particles lightens the particle inertial proper-
ties however the particle inertia was more sensitive to
the particle diameter rather than its density. The deposi-
tion of nanoparticles in the nasal cavity was distributed
evenly throughout the airway with a deposition that
drops from 72% to 18% for 1nm to 10nm. Because of
the evenly distributed deposition pattern for nanoparti-
cles there exists an opportunity to develop low-density
and nanoparticles to improve the efficiency of drug de-
livery to target deposition on the highly vascularised
mucosal walls.
5. ACKNOWLEDGEMENTS
The financial support provided by the Australian Research Council
(project ID LP0989452) and by RMIT University through an Emerging
Research Grant are gratefully acknowledged.
REFERENCES
[1] Kimbell, J., Shroeter, J.D., Asgharian, B., Wong, B.A.,
Segal, R.A., Dickens, C.J., Southall, J.P. and Millerk F.
J. (2004) Optimisation of nasal delivery devices using
computational models. Res. Drug Del., 9 233-238.
[2] Inthavong, K., Tian, Z.F., Tu, J.Y., Yang, W. and Xue, C.
(2008) Optimising nasal spray parameters for efficient
drug delivery using computational fluid dynamics.
Computers in Biology and Medicine, 38(6), 713-726.
[3] Inthavong, K., Tian, Z.F., Li, H. F., Tu, J.Y., Yang, W.,
Xue, C.L. and Li, C.G. (2006) A numerical study of
spray particle deposition in a human nasal cavity.
Aerosol Science Technology, 40, 1034-1045.
[4] Cheng, Y.S., Holmes, T.D., Gao, J., Guilmette, R.A.,
Li, S., Surakitbanharn, Y. and Rowlings, C. (2001)
Characterization of nasal spray pumps and deposition
pattern in a replica of the human nasal airway. J.
Aerosol Medicine, 14 (2), 267-280.
[5] Edwards, D.A., Hanes, J., Caponetti, G., Hrkach, J.,
Ben-Jebria, A., Eskew, M.L., Mintzes, J., Deaver, D.,
Lotan, N. and Langer, R. (1997) Large porous particles
for pulmonary drug delivery. Science, 276, 1868-1872.
[6] Gupta, A.K. and Gupta, M. (2005) Synthesis and sur-
face engineering of iron oxide nanoparticles forbio-
medical applications. Biomaterials, 25(18), 3995.
[7] McCarthy, J.R., Kelly, K.A., Sun, E.Y. and Weissleder,
R. (2007) Targeted delivery of multifunctional mag-
netic nanoparticles. Nanomedicine, 2(2), 153-167.
[8] Keyhani, K., Scherer, P.W. and Mozell, M.M. (1995)
Numerical simulation of airflow in the human nasal
cavity. J. Biomechanical Engineering, 117, 429-441.
[9] Subramaniam, R.P., Richardson, R.B., Morgan, K.T.,
Kimbell, J.S. and Guilmette, R.A. (1998) Computa-
tional fluid dynamics simulations of inspiratory air-
flow in the human nose and nasopharynx. Inhalation
Toxicology, 10, 91-120.
[10] Finckl M.H. and Wlokas, D.I. (2006) Simulation of
nasal flow by lattice Boltzmann methods. Computers
Biology Medicine, 37(6), 739-749.
[11] Hahn, I., Scherer, P.W. and Mozell, M.M. (1993) Ve-
locity profiles measured for airflow through a large-
scale model of the human nasal cavity. J Appl.
Physiol., 75(5), 2273-2287.
[12] Zamankhan, P., Ahmadi, G., Wang, Z., Hopke, P.H.,
Cheng,Y.S., Su, W.C. and Leonard, D. (2006) Airflow
and deposition of nanoparticles in a human nasal cav-
ity. Aerosol Science Technol., 40, 463-476.
[13] Mumford, D. and Shah, J. (1989) Optimal approxima-
tions by piecewise smooth functions and associated
variational problems. Commincations Pure and Ap-
plied Mathematics, XLII, 577-685.
[14] Swift, D.L. and Proctor, D.F. (1977) Access of air to
the respiratory tract., in Respiratory Defence Mecha-
nisms., Brain, J.D., Proctor, D.F. and Reid, L.M. Edi-
tors, Marcel Dekker, New York, NY, 63-93.
[15] Clift, R., Grace, J.R. and Weber, M.E. (1978) Bubbles,
Drops, and Particles. London, Academic Press Inc,
UK, London, Ltd.
[16] Ounis, H., Ahmadi, G.M.J.B., (1991) Brownian diffusion
of submicrometer particles in the viscous sub- layer. J.
Colloid and Interface Science, 143(1), 266-277.
[17] Li, A. and Ahmadi, G. (1992) Dispersion and deposi-
tion of spherical particles from point sources in a tur-
bulent channel flow. Aerosol ScienceTechnology, 16,
209-226.
[18] Saffman, P.G. (1965) The lift on a small sphere in a
slow shear flow. J. Fluid Mechanics, 22, 385-400.
[19] Talbot, L., Cheng, R.K., Schefer, R.W. and Willis, D.
R. (1980) Thermophoresis of particles in a heated
boundary layer. J. Fluid Mech, 101(4), 737-758.
[20] Cheng, K.H., Cheng, Y.S., Yeh, H.C., Guilmette, A.,
Simpson, S.Q., Yang, Y.H. and Swift, D.L. (1996)
In-vivo measurements of nasal airway dimensions and
ultrafine aerosol deposition in the human nasal and
oral airways. J. Aerosol Science, 27(5), 785-801.