Journal of Cancer Therapy
Vol.5 No.2(2014), Article ID:43217,9 pages DOI:10.4236/jct.2014.52026
Differences in Treatment Patterns and Health Care Costs among Non-Hodgkin’s Lymphoma and Chronic Lymphocytic Leukemia Patients Receiving Rituximab in the Hospital Outpatient Setting versus the Office/Clinic Setting
![]()
1Optum, Eden Prairie, USA; 2Genentech Inc., South San Francisco, USA.
Email: Stacey.dacostabyfield@optum.com, Artsmall@gene.com, laura.becker@optum.com, reyes.carolina@gene.com
Copyright © 2014 Stacey DaCosta Byfield et al. This is an open access article distributed under the Creative Commons Attribution License, which permits unrestricted use, distribution, and reproduction in any medium, provided the original work is properly cited. In accordance of the Creative Commons Attribution License all Copyrights © 2014 are reserved for SCIRP and the owner of the intellectual property Stacey DaCosta Byfield et al. All Copyright © 2014 are guarded by law and by SCIRP as a guardian.
Received December 1st, 2013; revised January 2nd, 2014; accepted January 10th, 2014
KEYWORDS
Lymphoma; Leukemia; Rituximab; Treatment Setting; Costs
ABSTRACT
Objective: To examine whether differences in treatment patterns and health care costs exist among chronic lymphocytic leukemia (CLL) and non-Hodgkin’s lymphoma (NHL) patients receiving rituximab in a hospital outpatient setting versus those receiving rituximab in a physician office/community clinic setting. Methods: This retrospective database study used medical and pharmacy claims (1/2007-7/2012) from a large US health plan. Patients ≥18 years with ≥2 rituximab claims and ≥2 claims for either NHL or CLL were identified. The date of the first rituximab claim were set as the index date, and differences in treatment patterns and health care costs were examined during the period following the index date. Costs were adjusted for patient characteristics using a multivariate regression model. Results: A total of 4441 patients were identified; 3167 received rituximab in the office/clinic setting, and 1274 in the hospital outpatient setting. From 2007 to 2012, the percentage of patients receiving rituximab in the hospital outpatient setting increased from 22% to 39%. Patients treated in the hospital outpatient setting vs. the office/clinic setting had fewer average counts of rituximab infusions (5.60 vs. 7.49, p < 0.001), higher total health care costs (cost ratio = 1.325, p < 0.001), higher infusion day drug and administration costs (cost ratio = 1.509, p < 0.001), and higher rates of ER visits and inpatient stays (both p < 0.001). Conclusions: These findings suggest that site of care may impact treatment patterns and costs of patients receiving rituximab, and additional research is needed to better understand the reason(s) for these differences by site of service.
1. Introduction
Chronic lymphocytic leukemia (CLL) and non-Hodgkin’s lymphoma (NHL) are two common types of hematological cancer that are treated with the monoclonal antibody rituximab, which targets malignant B cells positive for the CD20 antigen [1]. Rituximab is administered intravenously, as a single agent or in combination with other chemotherapy, as standard of care with demonstrated progression-free and overall survival benefit in DLBCL, follicular lymphoma and CLL [2-7].
Recent reports indicate site of service may influence costs and treatment patterns for cancer patients receiving chemotherapy, with higher costs but fewer chemotherapy sessions typically being reported in the hospital outpatient setting compared to the physician office setting [8,9]. While these previous studies provided a general overview of costs and chemotherapy patterns of cancer patients based on site of service, they did not stratify patients by specific cost drivers, such as drug regimen. Given the potential of site of service to impact cancer treatment patterns and health care costs in the US, we performed a detailed comparison between NHL and CLL patients receiving rituximab in a hospital outpatient setting vs. those receiving rituximab in a physician office/community clinic setting. The objective of this study was to examine the shift in site of service over the last six years for patients receiving rituximab, and investigate how site of service may influence health care costs and treatment patterns of patients receiving rituximab.
2. Methods
2.1. Data Sources and Subject Identification
This study included commercial and Medicare Advantage health plan members who received rituximab and who were diagnosed with NHL or CLL. The study was retrospective and used medical and pharmacy claims data and enrollment information from a large national health plan database. Additionally, linked data on the occurrence of death was obtained from the Social Security Death Master File.
To be included in the final study sample, subjects were required to be 18 years or older and have 2 or more claims on separate days indicating receipt of rituximab (HCPCS code J9310) between January 2007 and July 2012 (defined as the study period). The date of the first rituximab claim was defined as the index date. Patients were also required to have ≥2 claims with a diagnosis of NHL (ICD-9-CM codes 200.xx, 202.0x - 202.2x, 202.7x - 202.8x) or CLL (ICD-9-CM code 204.1x), at least 30 days apart and occurring between 6 months prior to the index date and the end of the study period. Patients may or may not have been newly/recently diagnosed. Continuous enrollment for 6 months prior to the index date (baseline period) and at least 6 months after the index date until the end of continuous enrollment or the end of the study (follow-up period) was required, with the exception that patients with less than 6 months of follow-up time due to death were also included. Patients with evidence of rituximab during the baseline period were excluded from the study. Patients with more than one type of primary cancer (in addition to NHL or CLL) between 6 months prior to the index date and the end of the study period were also excluded (patients were defined as having another cancer type if they have ≥2 claims of the same cancer type at least 30 days apart). Diagnoses appearing on claims for a laboratory or diagnostic service were not considered when identifying (including or excluding) any cancer diagnosis, as a diagnosis appearing on such claims often reflects a “rule-out” diagnosis that hasn’t been confirmed.
Subjects were stratified for cohort assignment based on site of service where rituximab was received (physician office/clinic vs. hospital outpatient facility). Patients who received rituximab at more than one site of service type (that is, office/clinic and outpatient setting) were excluded (approximately 7% of patients were excluded). General comorbid conditions were determined during the baseline period based on the presence of ICD-9-CM diagnosis codes on medical claims, and a Quan-Charlson comorbidity score was calculated for the baseline period [10]. Date of death was identified using a combination of Social Security Death Master File data and facility-based discharge codes identifying death.
2.2. Episodes of Care
An episode of care (EOC) was defined as beginning on the date of the first infusion for rituximab (index date) and ending at the earliest of the following: death; disenrollment; end of the study period; or 30 days after a rituximab administration that occurred prior to a ≥7 month gap in therapy during the study period (the length of the gap was based on the rituximab dosing schedule, which includes a 6 month gap for some indications). The EOC length and count of rituximab infusions during the EOC were captured. Additionally, evidence of cancer-related surgery, hormone therapy, radiation therapy, and other anti-cancer systemic therapy (chemotherapy, targeted therapy) was captured during the EOC. During the EOC, it was determined whether rituximab was received as monotherapy or in combination with other anti-cancer therapy.
2.3. Health Care Costs and Utilization
Total health care costs (medical and pharmacy costs) were computed as the combined health plan and patient paid amounts in the post-index period. Costs were presented as per-patient-per-month (PPPM) amounts to account for varying lengths of follow-up time. Costs were adjusted using the annual medical care component of the Consumer Price Index to reflect inflation between 2007 and 2012. Additionally, aggregate costs of rituximab and drug administration incurred by a patient on each day of infusion were captured (defined as infusion day costs); these costs were also presented as costs PPPM. Health care resource utilization was calculated in the post-index period for emergency room visits and inpatient admissions as rates (events/person-time).
2.4. Statistical Analysis
Differences between cohorts were evaluated by chisquare test (proportions) and t-test (continuous measures). Differences in rates of health care utilization were evaluated using the binomial exact test. The number of rituximab infusions during the EOC was modeled using a negative binomial regression with offset to account for variable observation time. Health care costs were modeled with a generalized linear model using a gamma distribution with a log link. All models were adjusted for age, squared age, gender, insurance type, baseline Charlson comorbidity score and receipt of rituximab as monotherapy.
3. Results
In total, 4441 patients were identified for final inclusion in the study (full study population). There were no significant differences in average age or gender distribution, or in the proportion of patients with NHL or CLL, between the cohort who received rituximab infusions in the office/clinic setting and the cohort who received rituximab in the outpatient setting (Table 1). Some geographic differences were observed: in the Northeast a higher percentage of patients received treatment in the hospital outpatient setting (vs. the office clinic setting), while in the South a higher percentage of patients received treatment in the office/clinic setting (vs. the hospital outpatient setting) (both p < 0.001) (Table 1). The mean baseline Charlson comorbidity index score was slightly higher among patients in the hospital outpatient setting compared to the office/clinic setting (3.27 vs. 3.11, p = 0.007) (Table 1). The percentage of patients who died during the study period and the mean time to death were not significantly different between the hospital outpatient and office/clinic cohorts (Table 1). Of the patients in the full study population, 3074 had commercial insurance and 1367 had Medicare insurance; these individuals were assigned to a commercial population subgroup and Medicare population subgroup, respectively (Table 1).
Over the course of the study period (from 2007 to 2012), the proportion of patients in the full population receiving rituximab infusions in the office/clinic setting decreased, while the proportion of patients receiving rituximab in the hospital outpatient setting increased. In 2007, about 78% of patients in the full population received rituximab in the office/clinic setting, and this percentage decreased to only about 61% in 2012 (Figure 1). Conversely, the proportion of patients receiving rituximab in the hospital outpatient setting nearly doubled over this same period, from 22% in 2007 to 39% in 2012 (Figure 1). Similar shifts in site of service were seen for both the commercial population and the Medicare population (Figure 1).
Characteristics of episodes of care (EOCs) were investigated. In the full population, EOCs in the office/clinic setting were on average longer than EOCs in the hospital outpatient setting (246 days vs. 226 days, p = 0.004), and EOCs in the office/clinic setting had a higher average count of rituximab infusions (7.49 vs. 5.60, p < 0.001) (Table 2). The recommended dose for rituximab is 6 to 8 cycles [11]. The percentages of EOCs with evidence of combination therapy (p = 0.942), radiation treatment (p = 0.094), or hormone therapy (p = 0.229) were similar between the office/clinic setting and the hospital outpatient setting (Table 2). However, a higher percentage of EOCs had evidence of cancer-related surgery in the hospital outpatient setting vs. the office/clinic setting (32% vs. 26%, p < 0.001) (Table 2). In the commercial and Medicare populations, EOC treatment trends were generally similar to those observed for the full population (Table 2).
Health care costs were calculated during the follow-up period, and were adjusted for patient demographic and clinical characteristics with a multivariate regression model. In the full study population, patients in the outpatient group had higher adjusted total health care costs (PPPM) than those in the office/clinic group (cost ratio = 1.325, p < 0.001). Adjusted PPPM total health care costs of the outpatient group compared to the office/clinic group were $16,515 vs. $12,466 (Figure 2). Adjusted infusion day costs (which comprised all rituximab and drug administration costs incurred on the day of infusion) were also significantly higher in the outpatient group compared to the office/clinic group (cost ratio = 1.509, p < 0.001). Adjusted PPPM infusion day costs were $9843 (60% of total costs) for the hospital outpatient group vs. $6521 (52% of total costs) for the office/clinic group (Figure 2). Site of service health care cost trends in the commercial population were similar to those observed for the full population for adjusted total and infusion day costs (both p < 0.001) (Figure 2). However, in the Medicare population, adjusted total health care costs and adjusted infusion day costs tended to be slightly higher for patients who received treatment in the office/clinic setting vs. those who received treatment in the hospital outpatient setting (both p < 0.001) (Figure 2).
Incidence rates of health care visits were measured during the follow-up period as the number of events per person-month. In the full population, rates of ER visits (rate ratio = 1.36, p < 0.001) and inpatient stays (rate ratio = 1.35, p < 0.001) were both significantly higher among patients who received rituximab in the hospital outpatient setting vs. the office/clinic setting (data not shown). Similar trends in health care utilization incidence rates were observed in both the commercial population and the Medicare population, though rates in inpatient stays among the Medicare population were not significantly different by cohort (data not shown).

Table 1. Patient population characteristics.
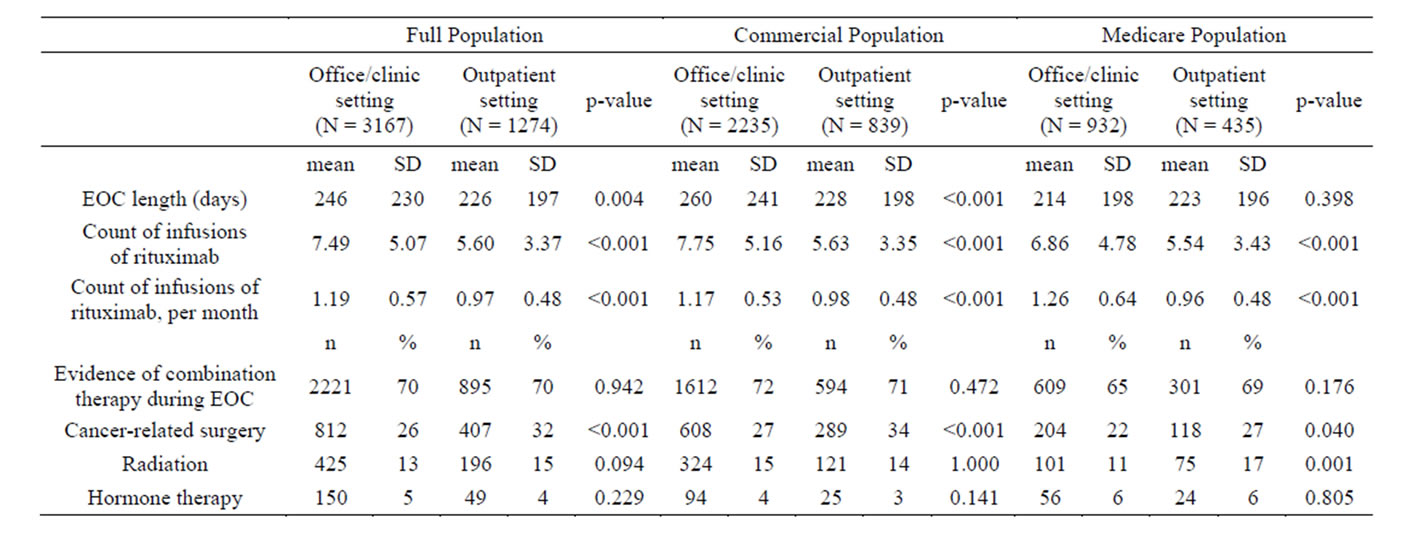
Table 2. Treatment characteristics during episodes of care (EOCs).
4. Discussion
In this retrospective study, we used claims data to better understand differences in treatment patterns and health care costs of NHL and CLL patients who were administered rituximab in a hospital outpatient setting and those who were administered rituximab in a physician office/ community clinic setting. In the full study population, patients treated in the hospital outpatient setting had fewer average counts of rituximab infusions, higher adjusted total health care costs, higher adjusted infusion day costs, and higher rates of ER visits and inpatient stays,
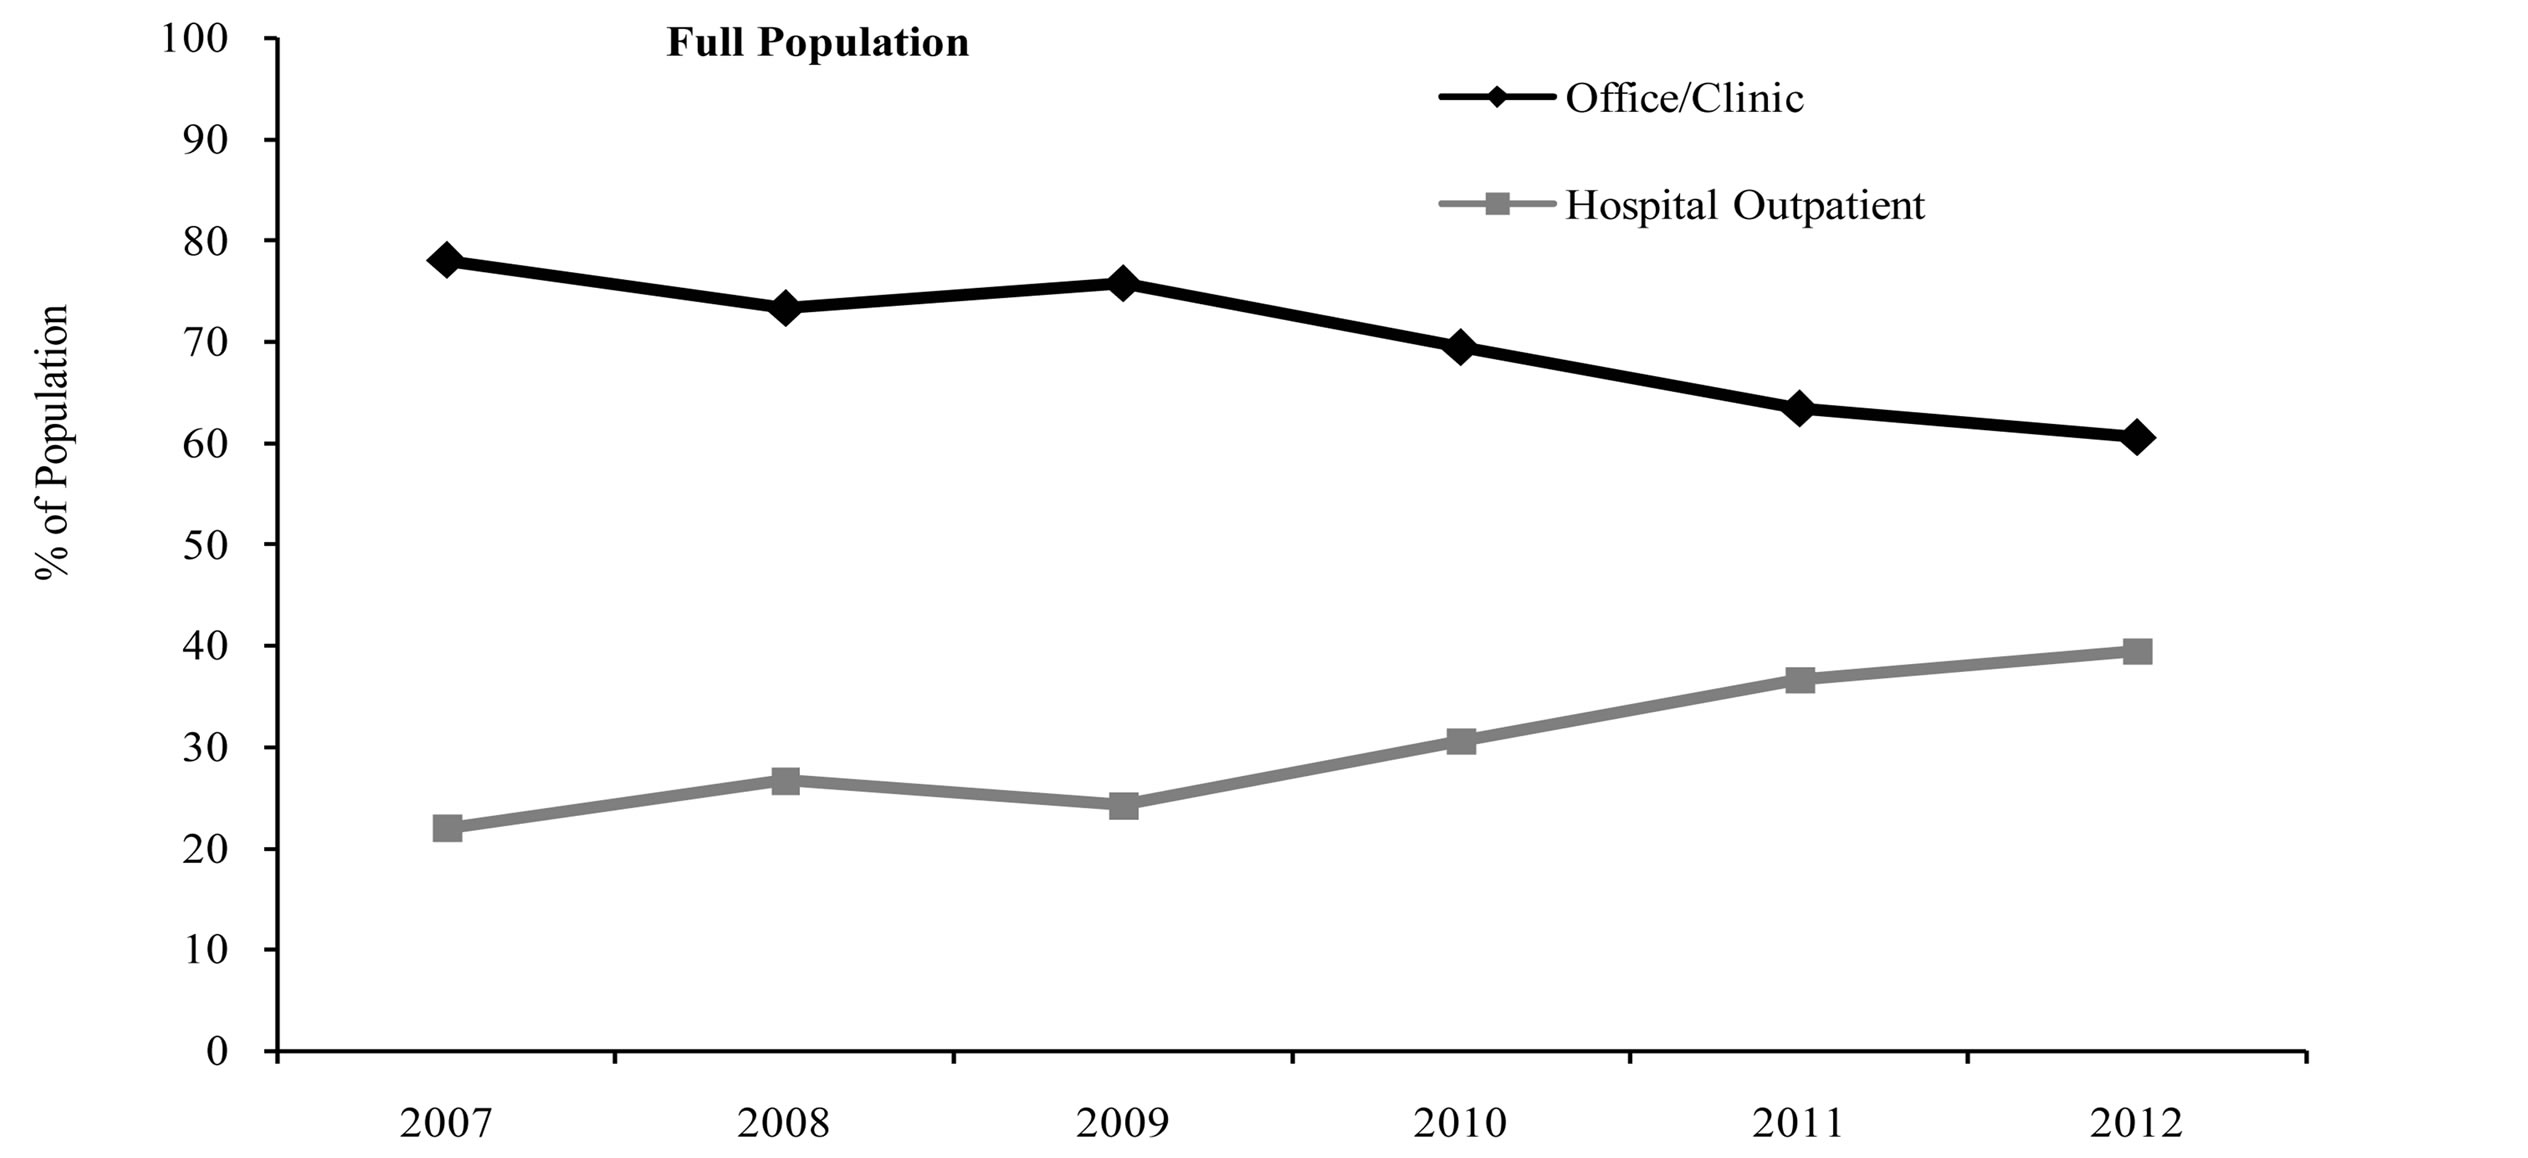
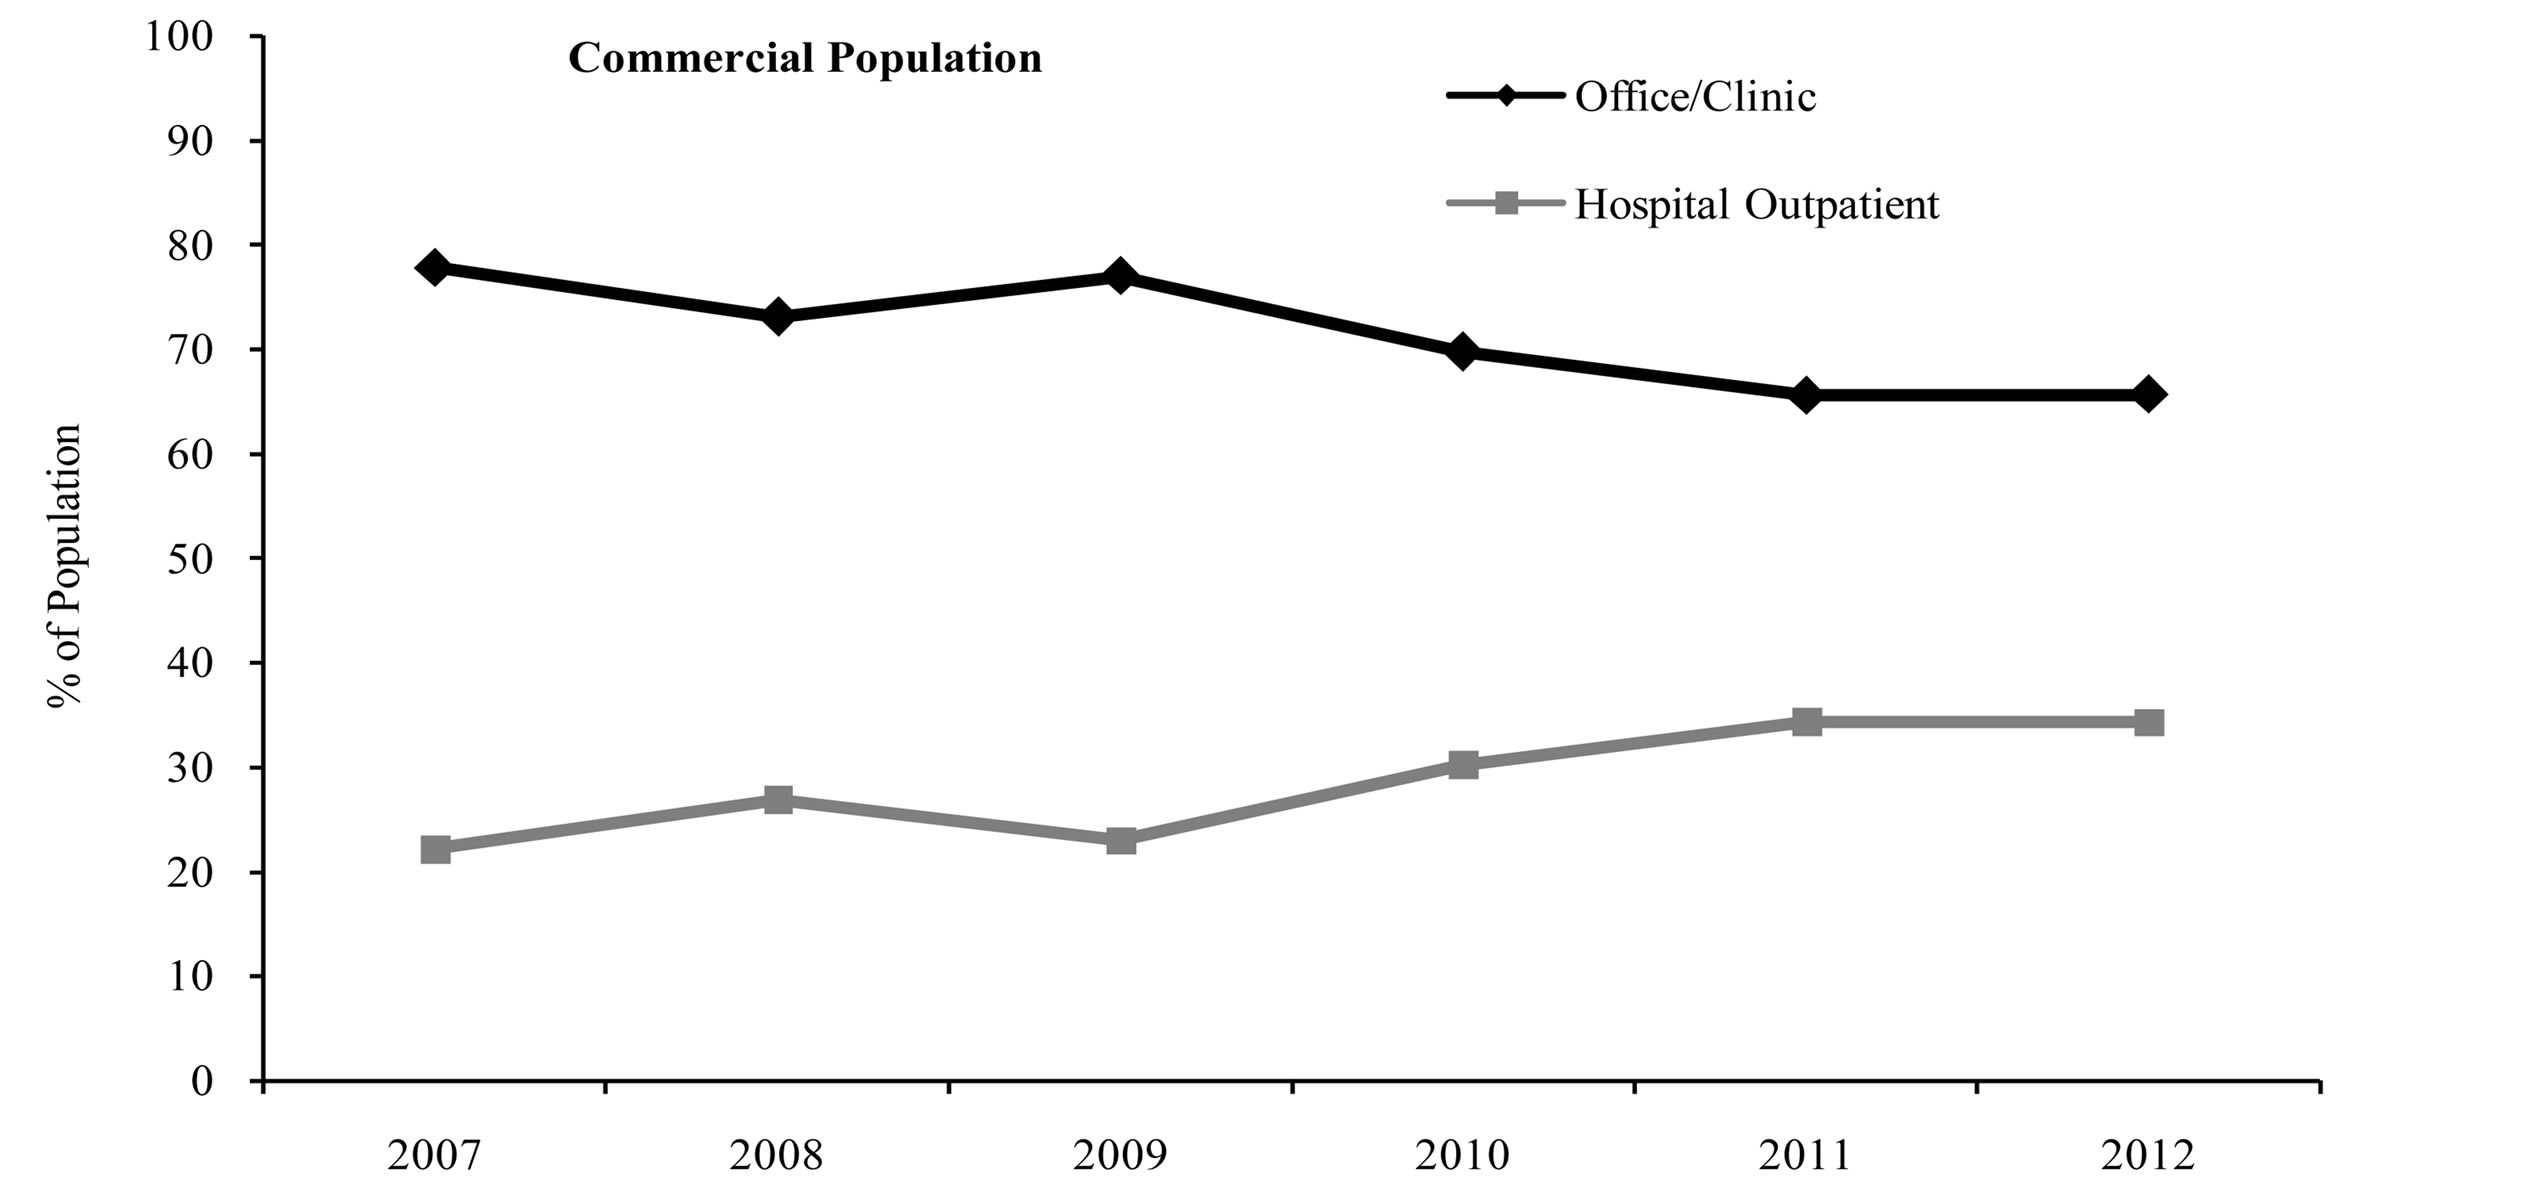
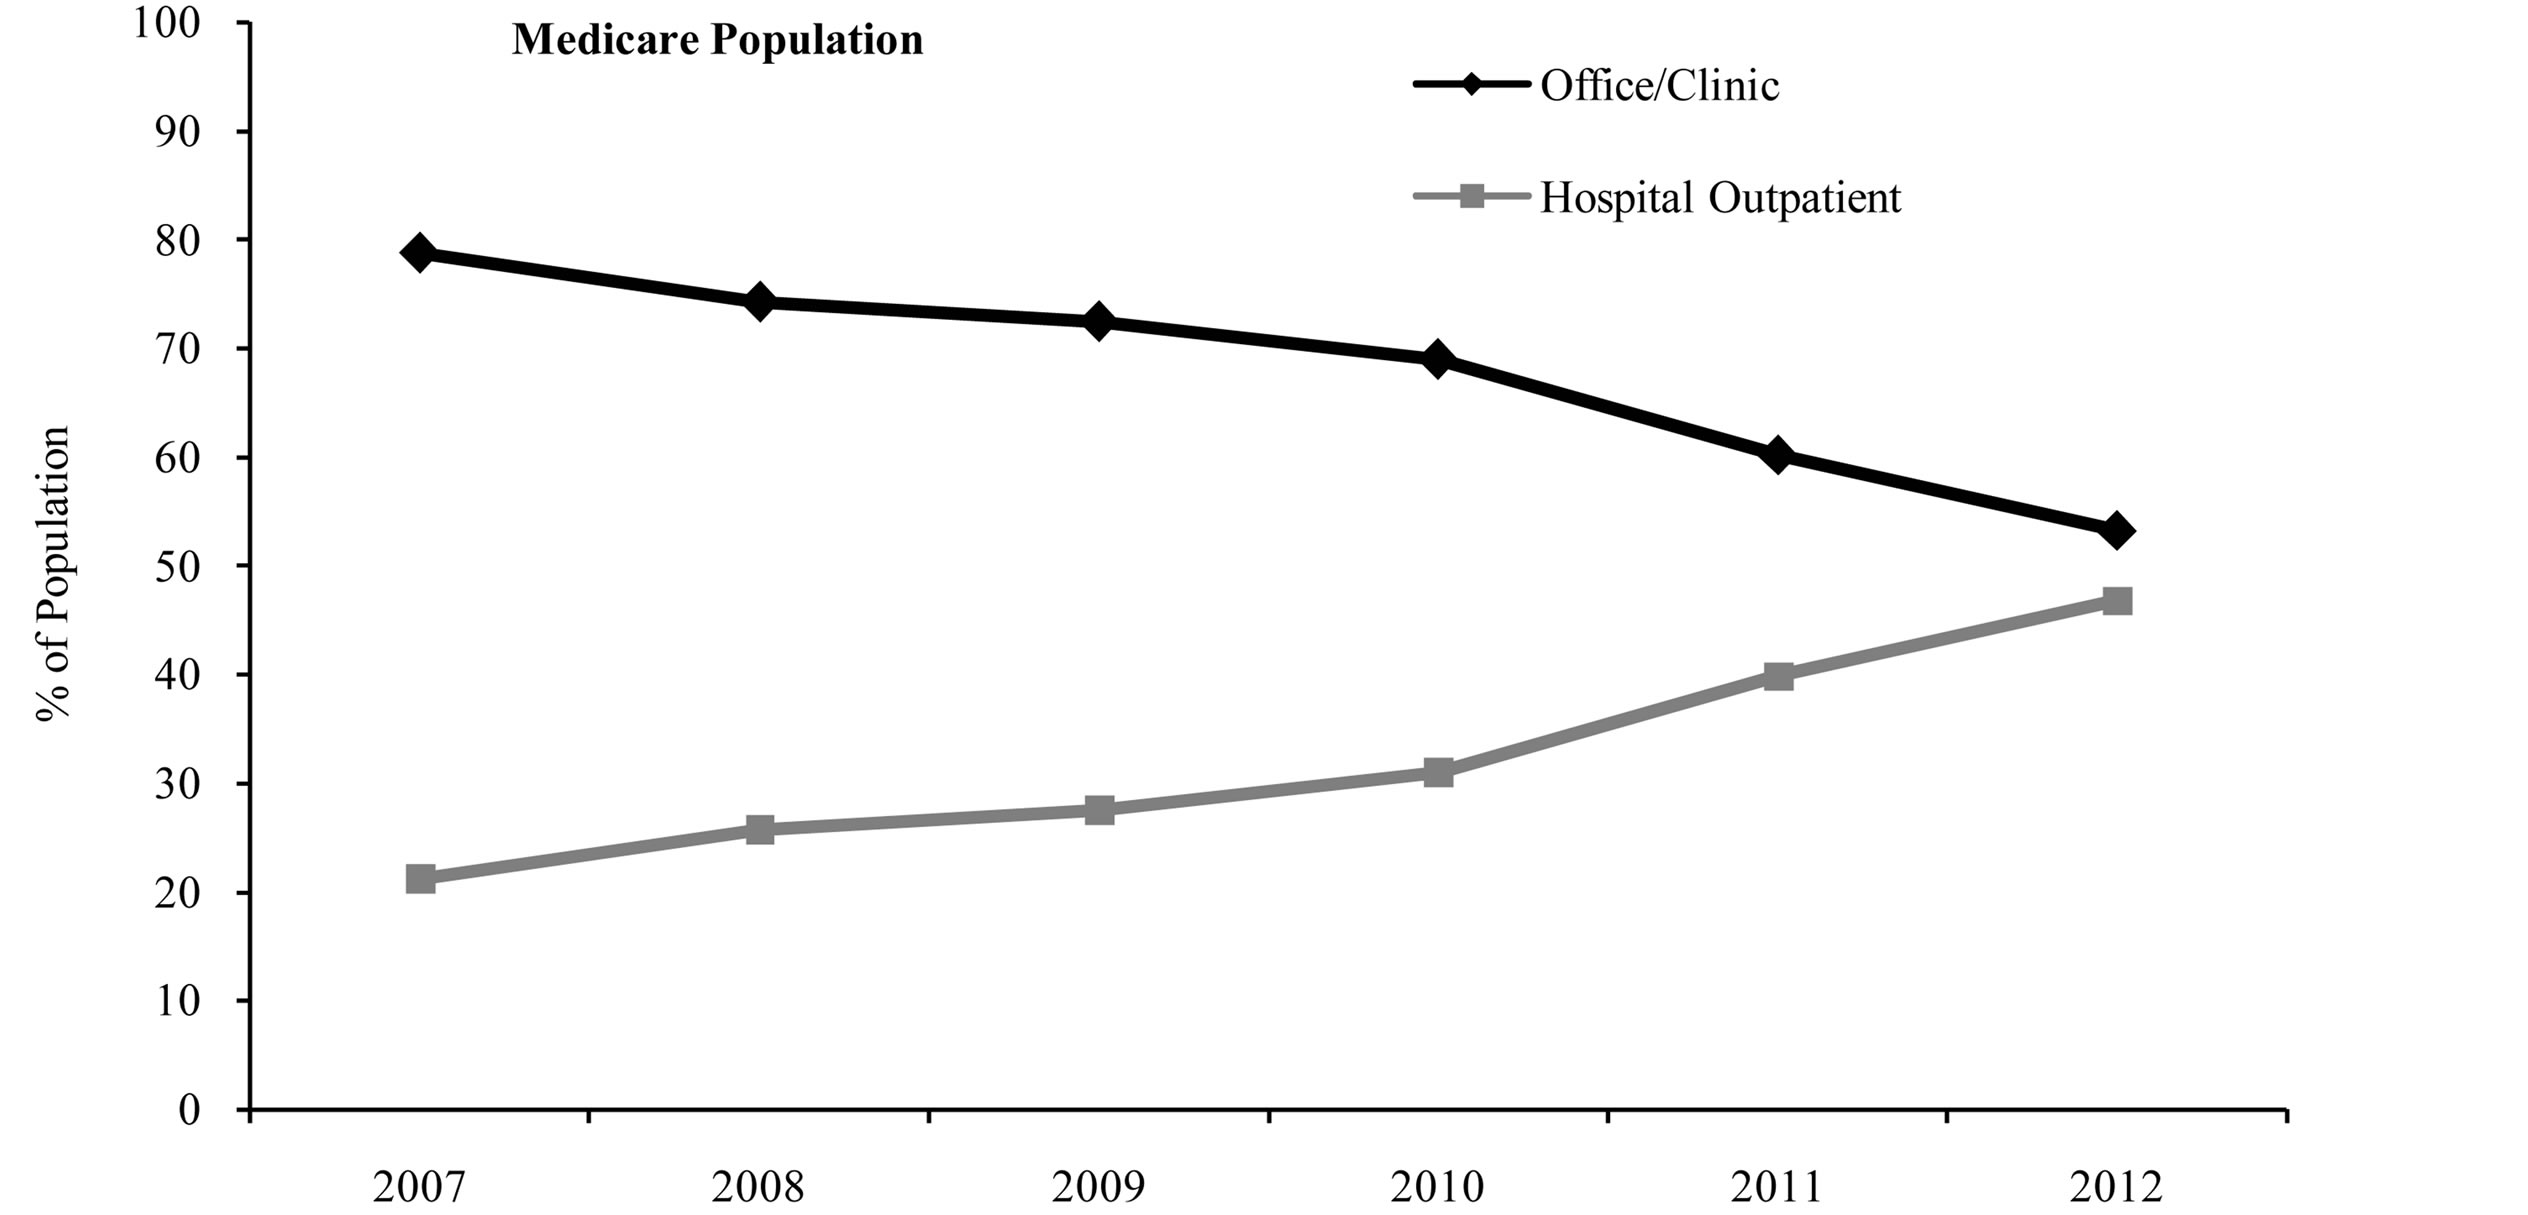
Figure 1. Site of service by index year.

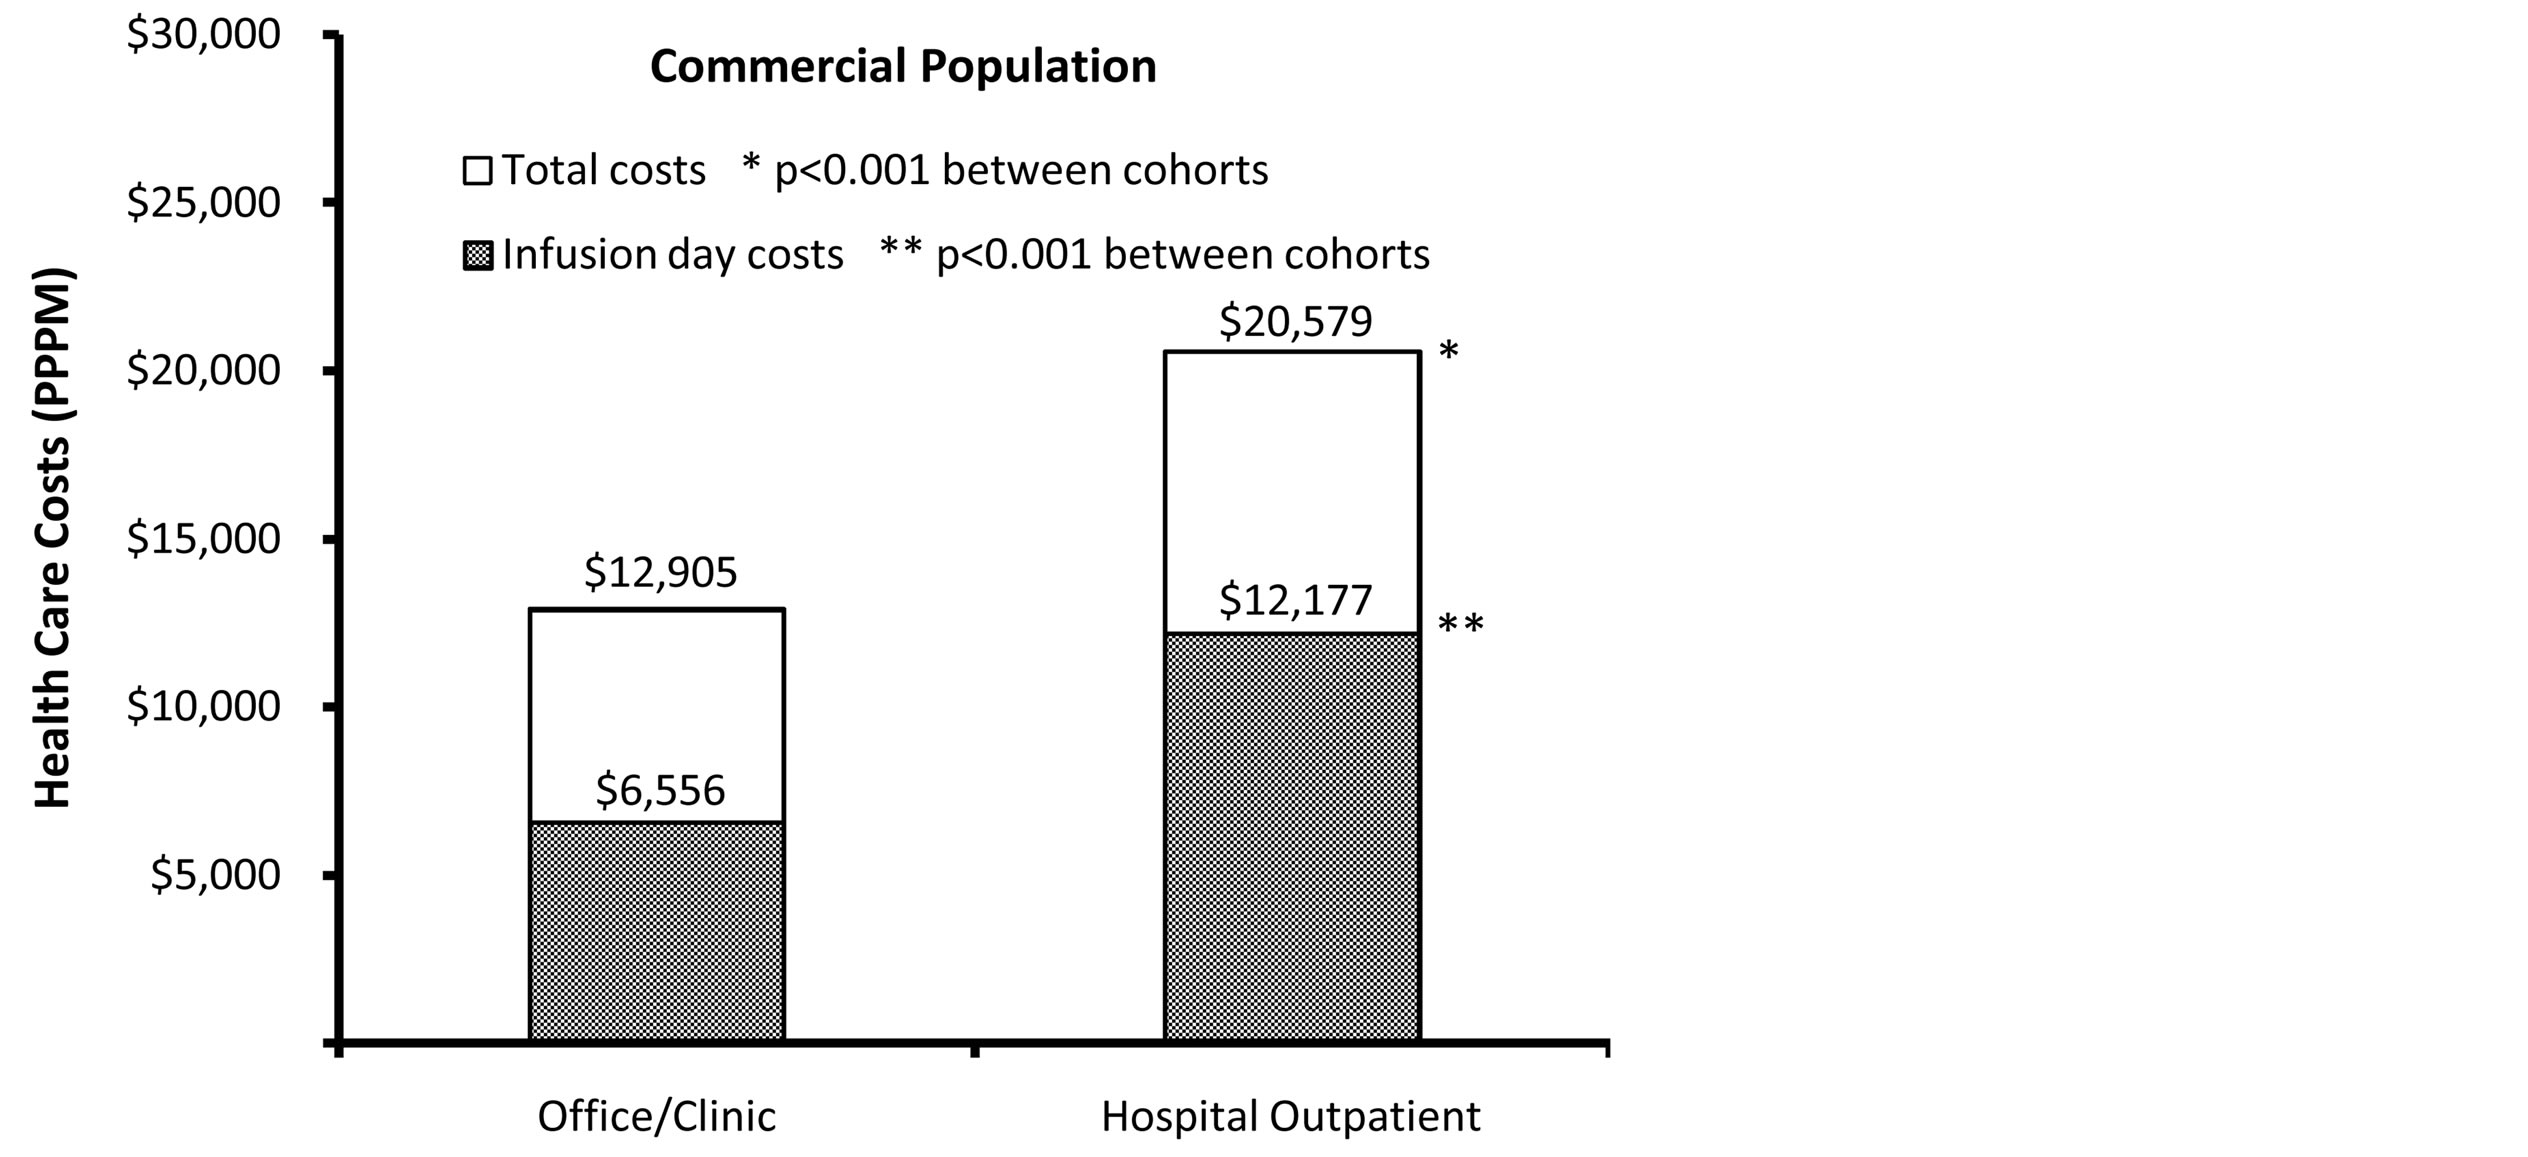

Figure 2. Adjusted† total and infusion day health care costs (PPPM). †Costs of full population, commercial population, and Medicare population adjusted for age, squared age, gender, insurance type, baseline Charlson comorbidity score and receipt of rituximab as monotherapy.
compared with patients treated in the office/clinic setting. Further, we found a marked increase in the proportion of patients receiving treatment in the hospital outpatient setting over the course of the study period (from 2007- 2012). These findings indicate that there may be differences by site of service in treatment patterns and health care costs among NHL and CLL patients receiving rituximab, and they warrant further investigation to assess the impact of these differences on clinical outcomes by site of care.
We also investigated site of service trends among subgroups of patients with either commercial or Medicare insurance. For the commercial insurance subgroup, differences in treatment patterns, health care costs, and resource use by site of service were similar to those observed in the full study population. Also, the results in the present study are consistent with findings from another study of cancer patients with commercial insurance, which examined differences in chemotherapy treatment patterns and health care costs in a hospital outpatient setting vs. a physician’s office [8]. In this prior study, the average length of a chemotherapy episode was found to be longer among patients treated in a physician’s office compared with patients treated in a hospital outpatient department (3.8 months vs. 3.4 months), and the average cost of care of office-managed episodes was substantially lower than the average costs of hospital-managed episodes ($19,640 vs. $26,300) [8]. Although this prior study did not stratify patients by type of treatment, the present study used a more narrowly defined population of patients who received treatment with a specific drug. For the subgroup of patients with Medicare insurance, treatment patterns and resource utilization were generally similar to trends observed for the full population. Unlike the full population, the total health care costs and infusion day costs in the Medicare population were higher in the office/clinic setting than the hospital outpatient setting. A prior study of cancer patients with Medicare insurance reported that those receiving chemotherapy in a physician’s office had lower PPPM health care costs than those receiving chemotherapy in a hospital outpatient setting ($4361 vs. $4981) [9], which differs from the findings of the present study. However, this prior study also found that the average number of annual chemotherapy sessions was higher for patients in the physician office setting than in the hospital outpatient setting (6.6 sessions vs. 3.9 sessions), which is consistent with the present study [9].
As this was not a randomized controlled study, it was not possible for us to determine the reason(s) for the differences in health care costs, resource utilization, and rituximab treatment patterns that were observed between the office/clinic and hospital outpatient settings. Some information is not readily available in claims data that could have had an effect on study outcomes, such as certain clinical and disease-specific parameters. For example, reasons for receiving care in the hospital outpatient setting versus the office/clinic setting, or whether the lower average count of rituximab infusions in the hospital outpatient setting was related to specific comorbidity or performance status, could not be assessed. In addition, differences may have resulted in part from patient case-mix differences between the office/clinic and physician outpatient settings (e.g., it is possible patients with more severe disease were more likely to receive treatment at one site rather than the other). The differences between sites may also be in part attributable to other factors. For example, insurance plans may reimburse the same or similar drugs or services at different rates depending on site of service [12-14]. Also, others have suggested that patients may be more likely to develop personal relationships with caregivers in a smaller setting such as a physician’s office or clinic, and this may lead to a higher likelihood of completing more cycles of chemotherapy[15]. Future research would be needed to better understand the reason(s) for the site of service differences observed in this study. Additional limitations should be considered when interpreting the results of this study. Differences in treatment patterns are difficult to interpret as appropriate care or not, since reasons for differences in treatment regimens were not available. Care received within a clinical trial may not necessarily be captured in a claims database. Finally these results are most applicable to a population of commercially insured patients or Medicare Advantage patients, and may not be generalizable to other patient populations.
An understanding of how costs and outcomes may differ by site of service has important implications from a health care public policy perspective. Starting in 2005, cuts to the Medicare program led to reductions in the reimbursement rates for many cancer drugs [16]. While hospitals may still be able to receive reduced prices on outpatient drugs through the federal 340B drug discount program, these discounts are typically not available for drugs administered in physicians’ offices [17]. A recent report found that the Medicare payment rate for rituximab is about 45% higher than the average acquisition cost for 340B hospitals [18]. Additionally, independently of the 340B program, Medicare reimbursement rates for services offered in a physician’s office frequently differ from rates for the same services offered in a hospital outpatient setting, when taking into account the total Medicare reimbursement to both the physician and the facility under the hospital outpatient prospective payment system [12-14]. These policies may influence where cancer patients receive care. A report highlighting trends among community oncology practices found an increase in the number of practices closing, in financial difficulty, or merging with hospitals [19]. Further, some physicians have reported referring patients to hospitals to receive chemotherapy treatment due to financial reasons, and there are concerns as to whether hospitals will be able to adequately absorb an influx of new patients [15,20].
In conclusion, we found significant differences in health care costs and treatment patterns among CLL and NHL patients, depending on the site of rituximab administration. Given the trend we observed towards an increase in the proportion of patients who were treated in the hospital outpatient setting over the study period (and a corresponding decrease of those treated in the office/clinic setting), these findings underscore the need to better understand the reason(s) behind these site of service differences and their clinical impact.
Acknowledgments
This study was sponsored by Genentech.The authors would like to thank Jesse Potash, PhD, at Optum for assistance with preparation of this manuscript.
REFERENCES
- G. M. Keating, “Rituximab: A Review of Its Use in Chronic Lymphocytic Leukaemia, Low-Grade or Follicular Lymphoma and Diffuse Large B-Cell Lymphoma,” Drugs, Vol. 70, No. 11, 2010, pp. 1445-1476. http://dx.doi.org/10.2165/11201110-000000000-00000
- F. Hagemeister, “Rituximab for the Treatment of NonHodgkin’s Lymphoma and Chronic Lymphocytic Leukaemia,” Drugs, Vol. 70, No. 3, 2010, pp. 261-272. http://dx.doi.org/10.2165/11532180-000000000-00000
- R. Marcus, K. Imrie, P. Solal-Celigny, J. V. Catalano, A. Dmoszynska, J. C. Raposo, F. C. Offner, J. Gomez-Codina, A. Belch , D. Cunningham , E. Wassner-Fritsch and G. Stein, “Phase III Study of R-CVP Compared with Cyclophosphamide, Vincristine, and Prednisone Alone in Patients with Previously Untreated Advanced Follicular Lymphoma,” Journal of Clinical Oncology, Vol. 26, No. 28, 2008, pp. 4579-4586. http://dx.doi.org/10.1200/JCO.2007.13.5376
- M. Herold, A. Haas, S. Srock, S. Neser, K. H. Al-Ali, A. Neubauer, G. Dölken, R. Naumann, W. Knauf, M. Freund, R.Rohrberg, K. Höffken, A. Franke, T. Ittel, E. Kettner, U. Haak, U. Mey, C. Klinkenstein, M. Assmann, U. von Grünhagen, East German Study Group Hematology and Oncology Study, “Rituximab Added to First-Line Mitoxantrone, Chlorambucil, and Prednisolone Chemotherapy Followed by Interferon Maintenance Prolongs Survival in Patients with Advanced Follicular Lymphoma: An East German Study Group Hematology and Oncology Study,” Journal of Clinical Oncology, Vol. 25, No. 15, 2007, pp. 1986-1992. http://dx.doi.org/10.1200/JCO.2006.06.4618
- M. Pfreundschuh, L. Trümper, A. Osterborg, R. Pettengell, M. Trneny, K. Imrie, D. Ma, D. Gill, J. Walewski, P. L. Zinzani, R. Stahel, S. Kvaloy, O. Shpilberg, U. Jaeger, M. Hansen, T. Lehtinen, A. López-Guillermo , C. Corrado, A. Scheliga, N. Milpied, M. Mendila, M. Rashford, E. Kuhnt, M. Loeffler, MabThera International Trial Group, “CHOP-Like Chemotherapy plus Rituximab versus CHOP-Like Chemotherapy Alone in Young Patients with Good-Prognosis Diffuse Large-B-Cell Lymphoma: A Randomised Controlled Trial by the MabThera International Trial (MInT) Group,” Lancet Oncology, Vol. 7, No. 5, 2006, pp. 379-391. http://dx.doi.org/10.1016/S1470-2045(06)70664-7
- B. Coiffier, E. Lepage, J. Briere, R. Herbrecht, H. Tilly, R. Bouabdallah, P. Morel, E. Van Den Neste, G. Salles, P. Gaulard, F. Reyes, P. Lederlin and C. Gisselbrecht, “CHOP Chemotherapy plus Rituximab Compared with CHOP Alone in Elderly Patients with Diffuse Large-BCell Lymphoma,” New England Journal of Medicine, Vol. 346, No. 4, 2002, pp. 235-242. http://dx.doi.org/10.1056/NEJMoa011795
- M. Hallek, K. Fischer, G. Fingerle-Rowson, A. M. Fink, R. Busch, J. Mayer, M. Hensel, G. Hopfinger, G. Hess, U. von Grünhagen, M. Bergmann, J. Catalano, P. L. Zinzani, F. Caligaris-Cappio, J. F. Seymour, A. Berrebi, U. Jäger, B. Cazin, M. Trneny, A. Westermann, C. M. Wendtner, B. F. Eichhorst, P. Staib, A. Bühler, D. Winkler, T. Zenz, S. Böttcher, M. Ritgen, M. Mendila, M. Kneba, H. Döhner, S. Stilgenbauer, International Group of Investigators, German Chronic Lymphocytic Leukaemia Study Group, “Addition of Rituximab to Fludarabine and Cyclophosphamide in Patients with Chronic Lymphocytic Leukaemia: A Randomised, Open-Label, Phase 3 Trial,” Lancet, Vol. 376, No 9747, 2010, pp. 1164-1174. http://dx.doi.org/10.1016/S0140-6736(10)61381-5
- Avalere Health, LLC, “Total Cost of Cancer Care by Site of Service: Physician Office vs Outpatient Hospital,” 2012. http://www.avalerehealth.net/news/2012-04-03_COA/Cost_of_Care.pdf
- K. Fitch, B. Pyenson, Milliman Inc., “Siteof Service Cost Differences for Medicare Patients Receiving Chemotherapy,” 2011. http://publications.milliman.com/publications/health-published/pdfs/site-of-service-cost-differences.pdf
- H. Quan, V. Sundararajan, P. Halfon, A. Fong, B. Burnand, J. C. Luthi, L. D. Saunders, C. A. Beck, T. E. Feasby and W. A. Ghali, “Coding Algorithms for Defining Comorbidities in ICD-9-CM and ICD-10 Administrative Data,” Medical Care, Vol. 43, No. 11, 2005, pp. 1130- 1139. http://dx.doi.org/10.1097/01.mlr.0000182534.19832.83
- Genentech, “Rituxan Package Insert,” 2013. http://www.gene.com/download/pdf/rituxan_prescribing.pdf
- The Medicare Payment Advisory Commission (MedPAC), “Report to the Congress: Medicare Payment Policy,” 2012. http://medpac.gov/chapters/Mar12_Ch03.pdf
- T. U. Guidi, “Medicare’s Hospital Outpatient Prospective Payment System: OPPS 101,” Journal of Oncology Practice, Vol. 6, No. 6, 2010, pp. 321-324. http://dx.doi.org/10.1200/JOP.2010.000163
- B. O. Wynn, P. S. Hussey and T. Ruder, “Policy Options for Addressing Medicare Payment Differentials Across Ambulatory Settings,” 2011. http://www.rand.org/pubs/technical_reports/TR979.html
- W. R. Robinson and J. Beyer, “Impact of Shifting from Officeto Hospital-Based Treatment Facilities on the Administration of Intraperitoneal Chemotherapy for Ovarian Cancer,” Journal of Oncology Practice, Vol. 6, No. 5, 2010, pp. 232-235. http://dx.doi.org/10.1200/JOP.000058
- M. Jacobson, C. C. Earle, M. Price and J. P. Newhouse, “How Medicare’s Payment Cuts for Cancer Chemotherapy Drugs Changed Patterns of Treatment,” Health Affairs, Vol. 29, No. 7, 2010, pp. 1391-1399. http://dx.doi.org/10.1377/hlthaff.2009.0563
- R. M. Conti and P. B. Bach, “Cost Consequences of the 340B Drug Discount Program,” The Journal of the American Medical Association, Vol. 309, No. 19, 2013, pp. 1995-1996. http://dx.doi.org/10.1001/jama.2013.4156
- US Department of Health and Human Services, Office of the Inspector General, “Payment for Drugs under the Hospital Outpatient Prospective Payment System,” 2010. http://oig.hhs.gov/oei/reports/oei-03-09-00420.pdf
- Community Oncology Alliance, “Community Oncology Practice Impact Report: The Changing Landscape of Cancer care,” 2012. http://www.communityoncology.org/pdfs/community-oncology-practice-impact-report.pdf
- J. Zoeller and P. Sonnenreich, “A Survey of Oncology Trends: The Oncologist’s Perspective,” P & T, Vol. 36, No. 12, 2011, pp. 82682-82688.