Journal of Geographic Information System
Vol. 4 No. 6 (2012) , Article ID: 26326 , 10 pages DOI:10.4236/jgis.2012.46063
Black Spot Determination of Traffic Accident Locations and Its Spatial Association Characteristic Analysis Based on GIS
Zhuji Institute of Surveying and Mapping, Zhuji, China
Email: zjkcsjyjy@163.com
Received September 21, 2012; revised October 23, 2012; accepted November 25, 2012
Keywords: Black Spot; Traffic Accident; Spatial Analysis
ABSTRACT
In general, the location of traffic accidents is described as an address with text, so they are difficult to display on the map. The paper discusses how to utilize the geocoding technology and VRS-GPS positioning technology to record the traffic accidents with Geo-spatial information. Based on the spatial relationship between traffic accidents and road network elements, two-way association relationship is defined by spatial relationship computation. Then the paper presents the method which takes the potential of reducing accidents as an index to extract the black spots. Finally, in the discussion, the association relationship between black spots and traffic attributes is used to analyze the factors that resulting in traffic accidents.
1. Introduction
With the rapid development of our national economy, the issue of traffic safety becomes increasingly prominent, and has attracted widespread attention. Data mining in traffic accidents, which helps to find the hidden knowledge and rules, has become an important research area in traffic safety. Currently, most of the traffic information analysis is limited to general statistical analysis, which is hard to explore the rules hiding in traffic accident information. Statistical analysis does not have the capability of map displaying and spatial analysis, and hence is not able to find the spatial distribution characteristic and relationship between traffic accidents and road network elements. In recent years, GIS has been developed rapidly and used broadly in the field of traffic safety [1]. In developed countries, especially the US and Western Europe, GIS technology has been widely applied to urban traffic information management. In China however, research into the area of GIS technology applications in traffic safety were started rather late. The public transport information system developed by the Ministry of Public Security is representative of domestic traffic safety systems and it is not completely combined with GIS. The research groups in Jilin University and Tongji University have held discussions about project level traffic safety evaluation information systems based on GIS. In the meantime, some domestic universities and research institutions have also carried out research into applying GIS technology to the issue of traffic safety [2,3]. The domestic research and application of traffic accident information systems based on GIS is still in its infancy and a lot of problems need to be solved. In this paper, it is firstly discussed about how to utilize GIS technology to locate the traffic accidents that are described as address with text in the road network. Secondly, based on the spatial relationship between traffic accidents and road network elements, black spots are extracted. Finally, the reasons for the accident-prone spots are detected, which helps provide support for decisions about traffic safety.
2. Traffic Accident Location
2.1. Traffic Accident
Traffic accidents contain a lot of information. Some are to measure the loss from traffic accidents: the number of deaths, serious injuries, minor injuries, missing persons, economic loss, accident type etc. One is the time of traffic accidents: year-month-day. Others are the key information of traffic accidents: accident location, district number, accident number, etc. Spatial information of traffic accidents is important for traffic safety analysis [4]. However, the spatial information of traffic accidents is generally described as address with text. So they cannot be displayed on a map and analysed spatially. Geocoding is a coding method based on space positioning technology. It provides a way to convert geographical position information described as address to geographic coordinates that can be used in a GIS. Therefore, geocoding should be applied to create traffic accidents with spatial coordinates.
2.2. VRS-Based Traffic Accident Mobile Position
The location of traffic accidents can be captured by a VRS-based mobile position system. The location system contains three parts: the VRS network, the communication network, and the user terminal.
2.2.1. The VRS Network
The VRS network is a network RTK service that makes use of the reference stations in the region of the measurement position. Using the observations from the GPS reference stations, the network computes the difference correction message of the position point. The government and the corporation manage the construction and operation of the VRS system.
2.2.2. The Communication Network
In this part, the General Packet Radio Service (GPRS) network system provided by a telecom service is utilized. The telecom network provides the communication and delivery of the difference message between the VRS and the user. The user needs to apply to the telecom service provider for this service and pay for the communication cost.
2.2.3. User Terminal
The user part contains a small Bluetooth GPS receiver and PDA. The data storage and calculation is carried out by the PDA. Because of the Objective existence of the VRS and communication system, the user terminal can be extended. The study can focus on equipment integration and terminal software development. The Figure 1
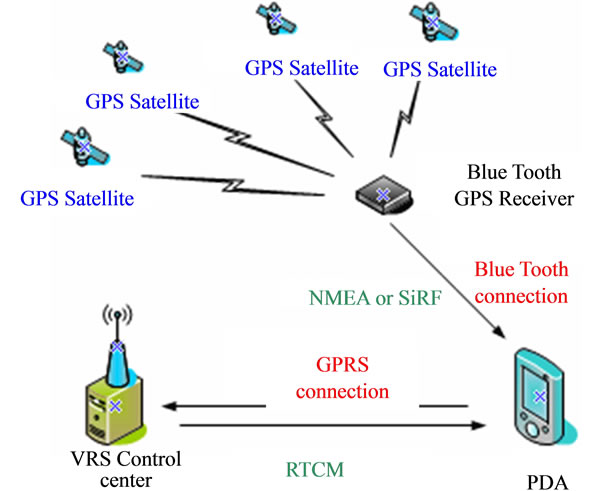
Figure 1. Mobile position data flow chart.
gives the structural frame of the whole system.
As shown in Figure 1, the user terminal receives the difference message from the VRS system continually via the communication network, whilst it also carries out the position calculation from the GPS signal. That can meet the high precision position that is required. In the process of position calculation, the PDA is the middle link. On the one hand, it obtains the difference data from the VRS control center; on the other hand, it acquires the data from Bluetooth GPS. In addition, it is in control of data download, data decoding, result displaying and equipment control. This allows the mobile location instrument to obtain the high precision position of each traffic accident and also to store attribute information using the functions of the PDA.
2.3. Traffic Accident Geocoding
However, a lot of traffic accidents still have no location because of the descriptive record of each one before the use of the mobile position instrument. There are two clear steps that should be taken in geocoding: address parsing and standardizing; and address matching [5]. The former is to divide an address into several standard fields and each field should be cleaned up in order to make the formatting and spelling correct. The latter is to determine the spatial position on the map, whose goal is to get the most accurate matching results for any input address.
2.3.1. Address Parsing and Standardizing
Address parsing and standardizing has been regarded as the key step in geocoding. There are many problems we must solve because of the nonstandard named address and manual input error. Based on the study and analysis of naming rules, an address is divided into several fields and each field should be standardized [6].
The occurrence of traffic accidents is difficult to predict and they can happen almost anywhere on urban roads. As a whole, traffic accidents are sorted into two categories: some occur at intersections and the others occur on road segments. In order to describe the location of traffic accidents clearly and uniquely, the traffic accident address is divided into the fields shown in Table 1. The value of the fields ROAD and INTSECRD must be checked up with the road names in road network database. In the paper, the address data of traffic accidents have been performed in batch processing using Excel VBA according to the characteristics of address data and the results provide a basis for address matching. Figure 2 shows the samples of traffic accident address parsing and standardizing.
2.3.2. Address Matching
The second step of address matching will be in progress according to the fields: ROAD, KEYWORD, INT-
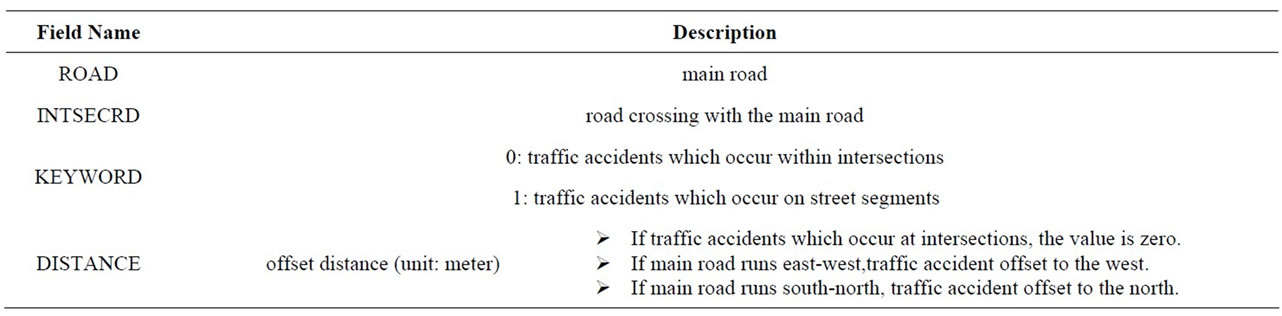
Table 1. Parsing of traffic accident address.
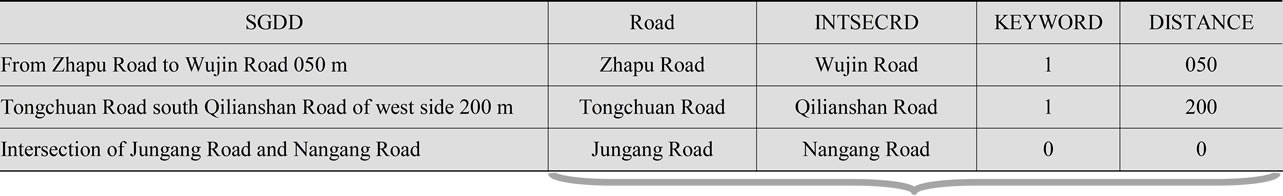
Figure 2. Address parsing and standardizing of traffic accidents address.
SECRD, and DISTANCE. The elements of road network are stored in an SHP file (ArcGIS) and each of them exits as a polyline feature with spatial information. Traffic accidents are closely related spatially to the road network, so the road network provides a basis of spatial location for address matching .The process of address matching is shown in Figure 3 and continues as follows Firstly, the point of intersection is determined according to the fields ROAD and INTSECRD. The traffic accident is located on the map according to fields KEYWORD and DISTANCE. The results of address matching are also stored in the SHP file. Each successfully matched traffic accident displays on the map as a geographical point with the specific geographic location (X-coordinate, Y-coordinate), corresponding to the coordinate system of the road network. Figure 4 shows the results of address matching of the traffic accident address data provided in Figure 2.
3. Spatial Relation Computation of Traffic Accident
By using geocoding technology, traffic accidents are given a geographic coordinate and each of them has the corresponding spatial location on the road network. This allows accident-intensive areas to be detected intuitively when traffic accidents and the road network are presented on the same map. A traffic accident itself is an entity with strong spatial attributes, closely related to the elements of the road network in space. For further exploration of the spatial distribution characteristic of traffic accidents, it is essential to know with certainty how many accidents happened on each road network element and on which road network element each accident happened. Therefore, the two-way association relationship between traffic accidents and road network elements can be defined based on their spatial relationship.
3.1. Spatial Data Preparation
The urban road network is the geographical expression of urban roads. It is a complicated entity set. Each road is described as a polyline feature via abstraction in a GIS. To meet the need for traffic safety analysis, each feature should be reedited and reprocessed. In reality, intersections are the meeting places for vehicles and the accidents occurring at intersections account for a large proportion of all traffic accidents, so the research on the traffic accidents which occur at intersections has an important significance. For this reason, intersections are extracted from the road network and stored in the intersections layer. Each intersection is described as a point feature. The segments between two intersections are described as polyline features and also stored in separate road sections layer road sections layer. As the intersections layer and the road sections layer road sections layer are all extracted and materialized from the urban road network, some of the entities’ attributes are inherited from the road network, others are the results of spatial computation .The entities of these two layers lay a foundation for the spatial relation computation.
3.2. Spatial Relation Computation
In spatial terms, traffic accidents are located either at intersections or on street segments, while traffic accidents layer, intersections layer and microscopic road sections layer are combined together, showing on the same map. When enlarging the map to some road segments and intersections, it can be seen that traffic accidents are distributed on each of them. Therefore, each traffic accident
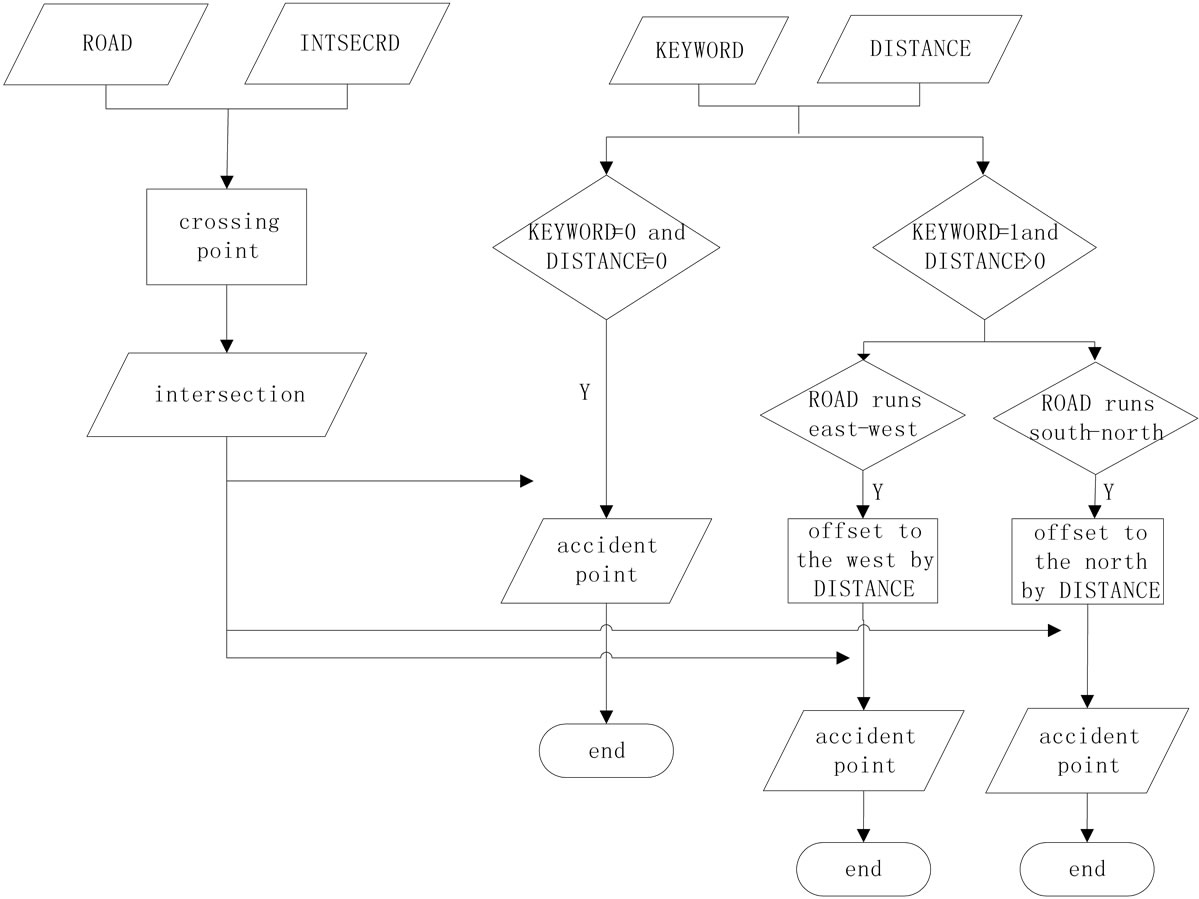
Figure 3. Address matching process.
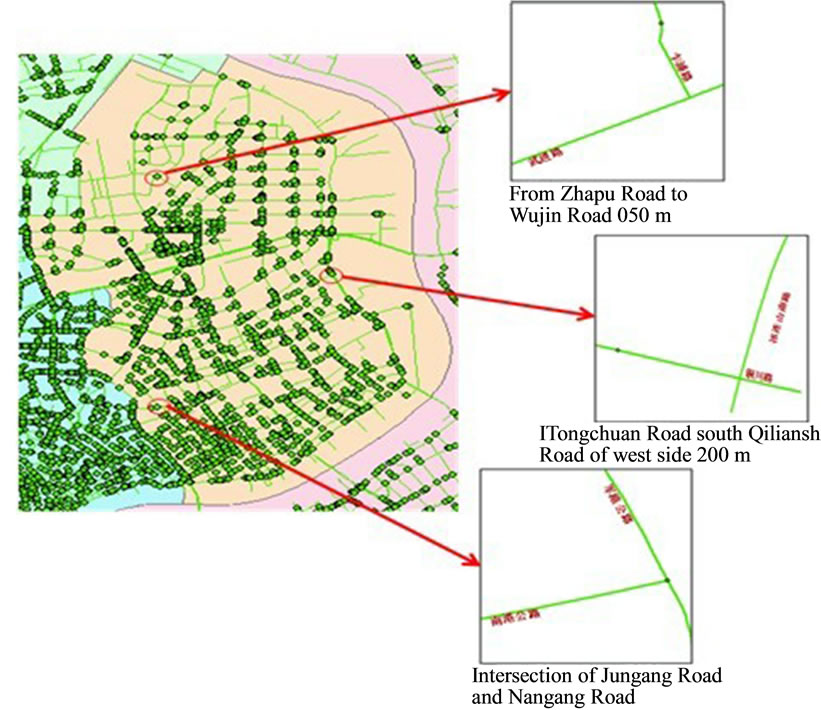
Figure 4. Results of address matching.
has a close spatial relationship with microscopic a road section or intersection via geocoding. The author has related each road network element to every traffic accident by using ArcGIS VBA based on the spatial analysis function of GIS, such as Buffer analysis, overlay analysis and so on. In this process, the rule that accidents occur either at an intersection or on a road section is followed. The values of the relationship are stored in the attribute field of traffic accidents layer. The number of traffic accidents happening on each road network element is stored in the attribute field of either the intersections layer or microscopic road sections layer.
Upon the computation mentioned above, traffic accidents are not just the entities which can display on the map. Both road network elements and traffic accident objects are all recorded with their subordinate relations and quantity relationship in non-spatial attributes, which define the two-way association relationship between traffic accidents and road network elements.
4. Black Spots Determination
4.1. Black Spots
The distribution of traffic accidents in the road space is decentralized and intensive. Decentralized distribution of accidents mostly concerns the unsafe behavior of the drivers and other road users. But intensive distribution of accidents is more related to the road level, conditions of traffic facilities and the traffic environment. A distribution showing an accident-intensive section of the road network is usually called accident-prone point or accident-prone section, normally known as an accident black spot in foreign countries. The definition of black spot is different from country to country. Also, there are no clear and uniform definitions in China [7].
Based on two types of road element: microscopic road sections and intersections, accident-prone section and accident-prone point are defined as follows in the paper:
1) Accident-prone section. The road segments whose occurrence is higher among comparable ones;
2) Accident-prone point. The intersections whose possibility of accident happening is much higher than the average.
4.2. Black Spot Identification Based on the Potential of Reducing Accidents
Black spot identification is important in the research of traffic safety. Many countries and cities have applied various methods to identifying black spots with the real situation of road traffic. Meanwhile, many documents [8,9] have discussed the methods of black spot identification, and also compared the advantages and disadvantages of them. The method based on potential of reducing accidents is selected in this paper [10].
The identification is based on two objects—microscopic road sections and intersections—and the steps are as follows:
1) On the research of the data used in the paper, intersection accidents and microscopic road section accidents are all grouped into several categories by the types of traffic facilities.
The classification of intersections is determined by two factors as shown in Table 2. Accordingly, intersection accidents have ten types.
Considering of the complexity of microscopic road sections, the classification of microscopic road sections are determined by three factors as shown in Table 3. Microscopic road section accidents have twelve types.
2) Calculate the potential of reducing accidents: the value of the potential of reducing accidents is the difference between the number of the accidents and the average number of the accidents occurred on the same kind of traffic facilities.
3) Sort the values obtained in the previous step in descending order, and the traffic facilities whose values are at the top are regarded as black spots.
The paper has adopted one year traffic accidents data in a region, which are described as address with text. By geocoding technology, it is possible to display the traffic accidents on the map. Based on the spatial relationship computation, the identification that takes the potential of reducing accidents as an index identifies thirty black spots. Figure 5 shows the process.
5. Association Analysis of Black Spots
Traffic accident is a difficult to predict event, and the

Table 2. Types of intersections.

Table 3. Types of microscopic road sections.
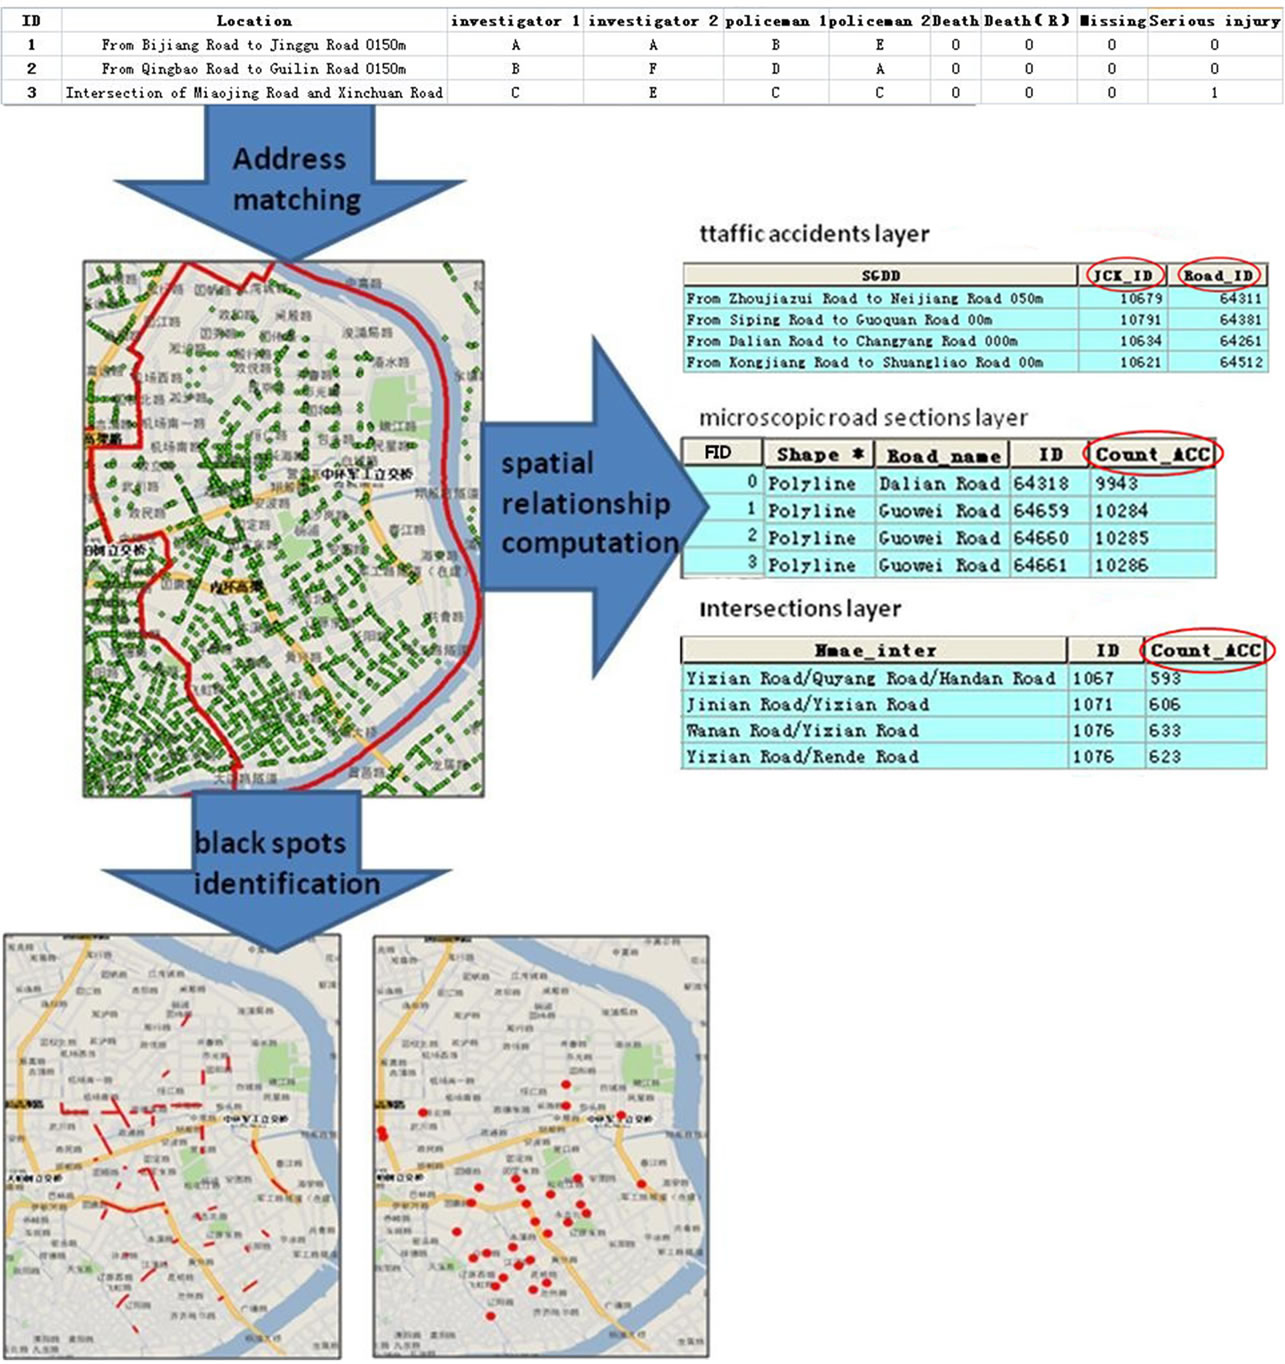
Figure 5. Process from geocoding to black spot identification.
inducing factors are complicated. There are subjective and objective ones, also direct and indirect ones. People, vehicles, and roads are the three elements of transportation systems that are all likely to become the inducing cause. All in all, road conditions take the dominant position. Black spots are the road sections or intersections where road traffic accidents are concentrated. Due to its potential of harm, research into the relationship between black spots and the road network elements is the focus of traffic safety. Aided by GIS, analyzing the distribution characteristic of black spots in a spatial context, and detecting the relationship between black spots with intersections or microscopic road sections can help to take effective measures to reduce the number of accidents.
GIS databases can record both the spatial and nonspatial information. In advance of association relationship analysis, non-spatial information should be cleaned up, and the attributes that are likely to become the inducing causes for accidents should be chosen. The paper focuses on the relationships between black spots and road elements, so that the relative attributes are selected from the intersections layer and microscopic road sections layer. Among these attributes, some are provided with traffic data, others are calculated through the existing spatial entities by GIS, as shown in Tables 4 and 5.
5.1. Association Relationship Analysis in Microscopic Road Sections
Microscopic road sections are vectorized into polyline features in GIS. Each polyline feature contains many attributes in order to describe its characteristics in detail. Since microscopic road sections are the key ingredients in the road network, detecting the association relationship in the attributes of microscopic road sections plays a big role. Some attributes such as road level, average traffic volume, intersection spacing are selected for association analysis. It is conducted with the number of the traffic accidents occurring on accident-prone sections as the first component and the value of the attributes mentioned above as the second component. Figure 6 shows the result.
The statistical chart shows that the roads with lower road level, smaller traffic volume and smaller intersection spacing are more likely to induce traffic accidents.
The result is basically consistent with the description in previous research [11,12]. The condition of the road and other ancillary facilities are different with the road level. Traffic accidents are more likely to happen on the roads whose level is lower .Because the lower the road level, the traffic conditions are worse. Meanwhile, accident-prone sections have a close relationship with traffic volume. With the traffic volume decreasing, the spacing of vehicles increases, so drivers can choose the speed according to their own habits without the interference from the vehicles traveling in the same direction. In contrast, drivers are more careful when the number of vehicles is larger with the traffic volume increasing, which lead to the decrease of traffic accidents. Further, the smaller intersection spacing makes the turning vehicles change lanes smoothly and vehicles continuing straight on to drive fast. So the smaller intersection spacing is one of the factors to induce accidents.
5.2. Association Relationship Analysis in Intersections
An intersection is a meeting place for vehicles. With the traffic flow going straight, turning left and turning right at intersections, complex interference causes crashes to take place. Therefore in general, intersections are accident-prone points. Also, some attributes such as the number of branches and average traffic volume are selected as the second component for association analysis. The result is shown in Figure 7.
The statistical chart shows that the intersections with
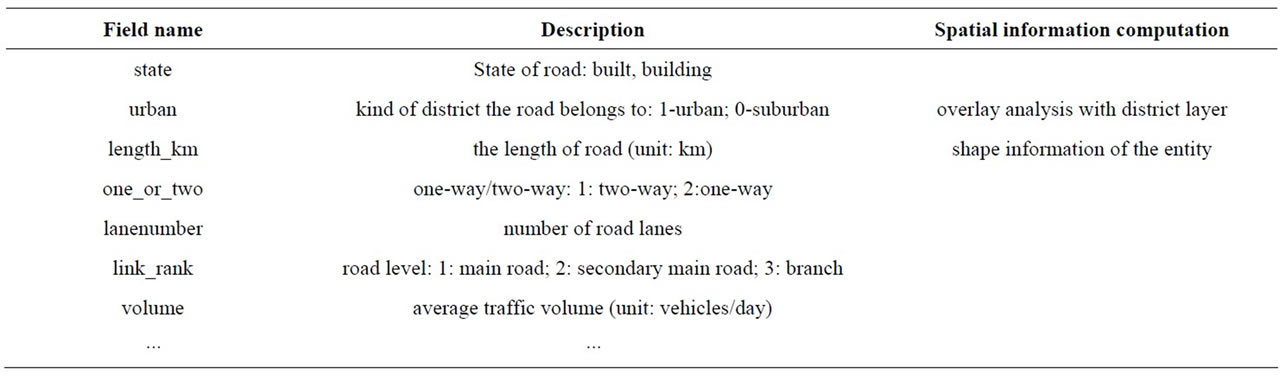
Table 4. Attributes of microscopic road sections layer adopted to association relationship analysis.
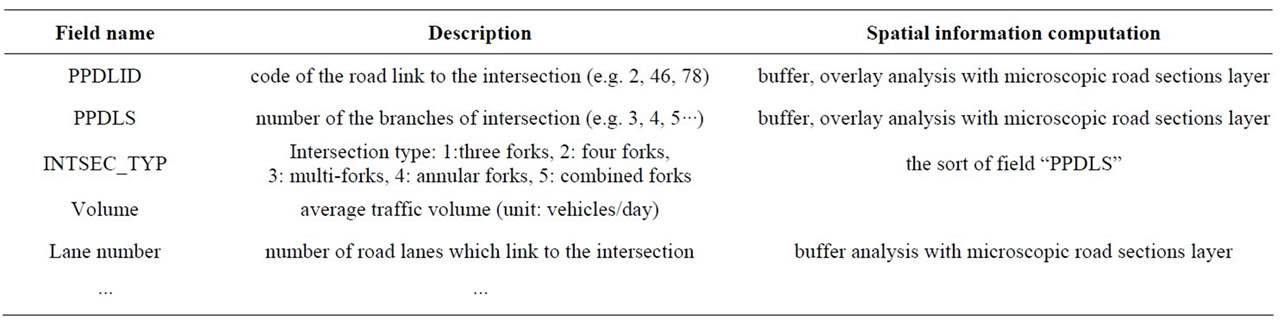
Table 5. Attributes of intersections layer adopted to association relationship analysis.
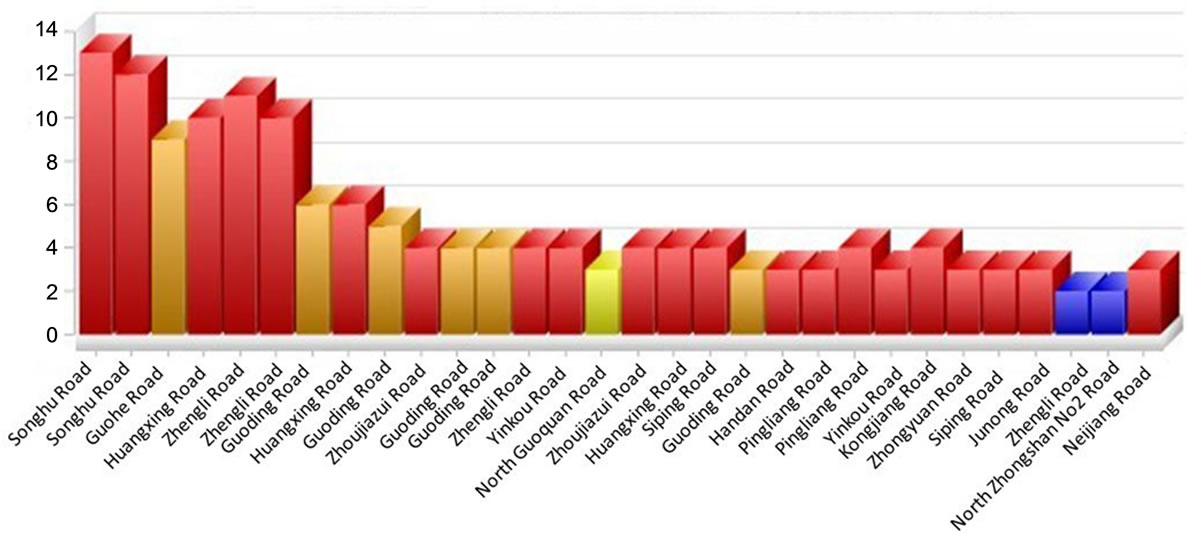 (a) Relationship with road level
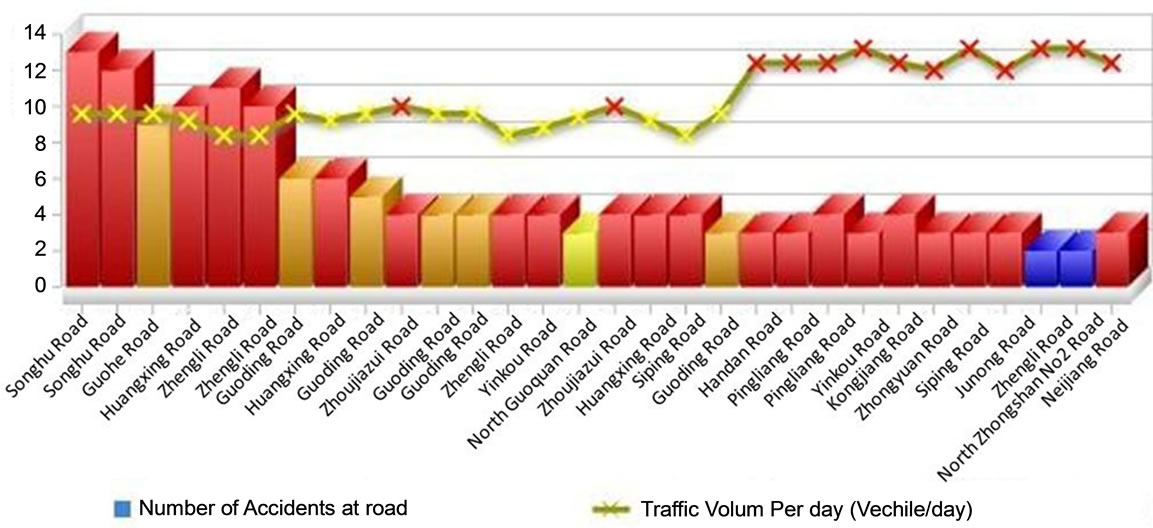 (b) Relationship with average traffic volume
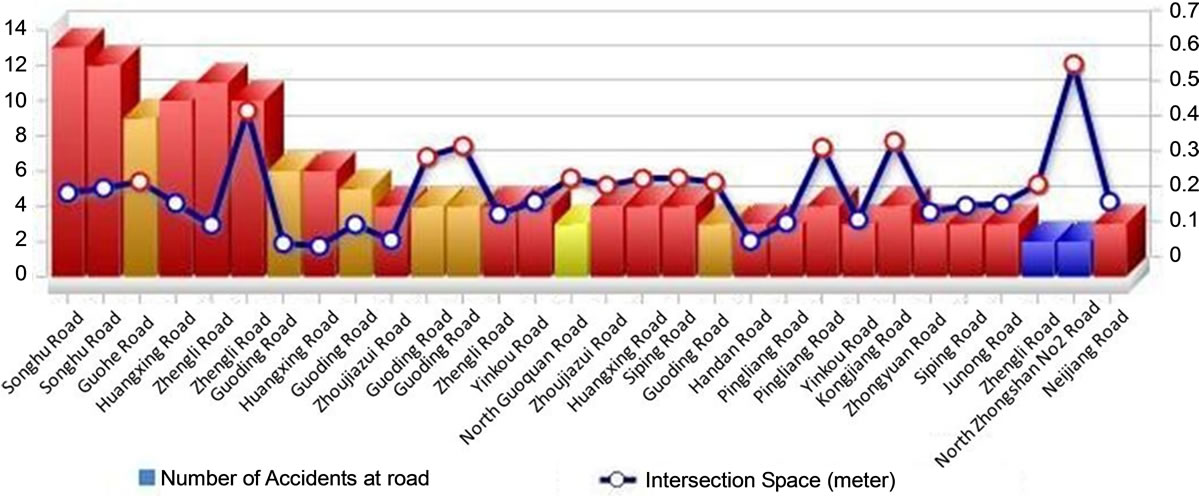 (c) Relationship with intersection spacing
Figure 6. Statistical analysis on accident-prone section.
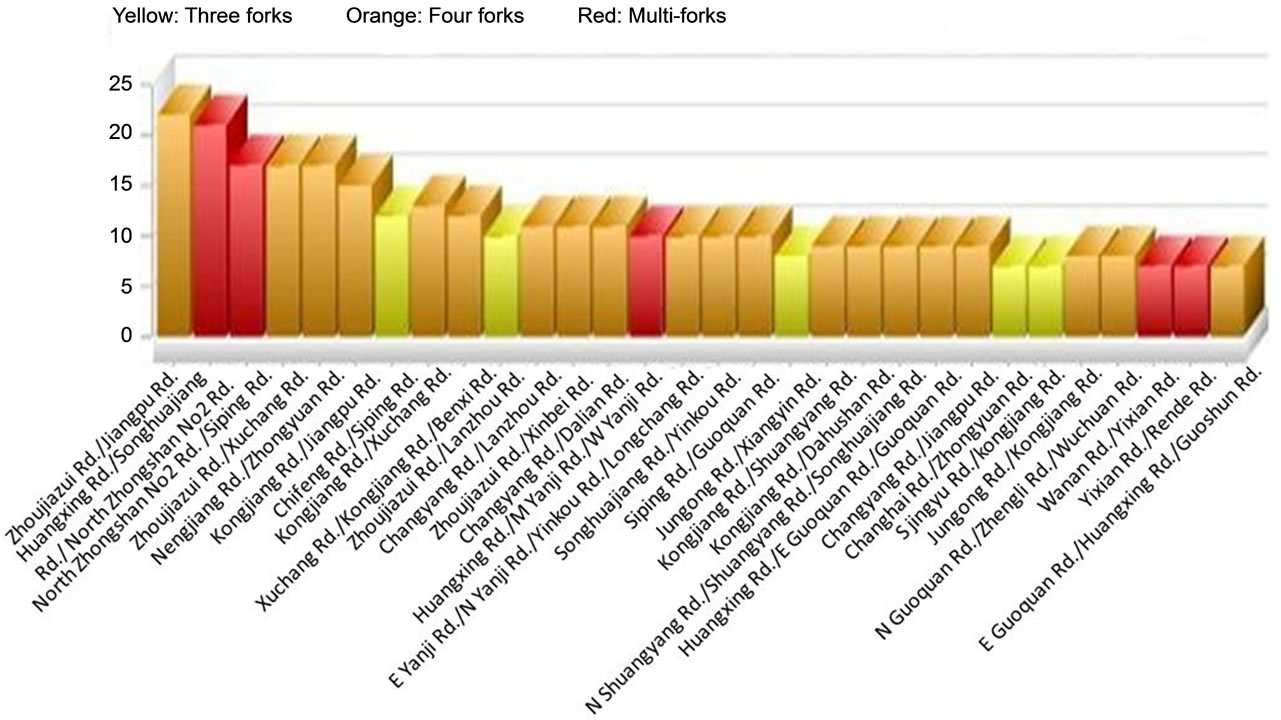 (a) Relationship with the number of branches
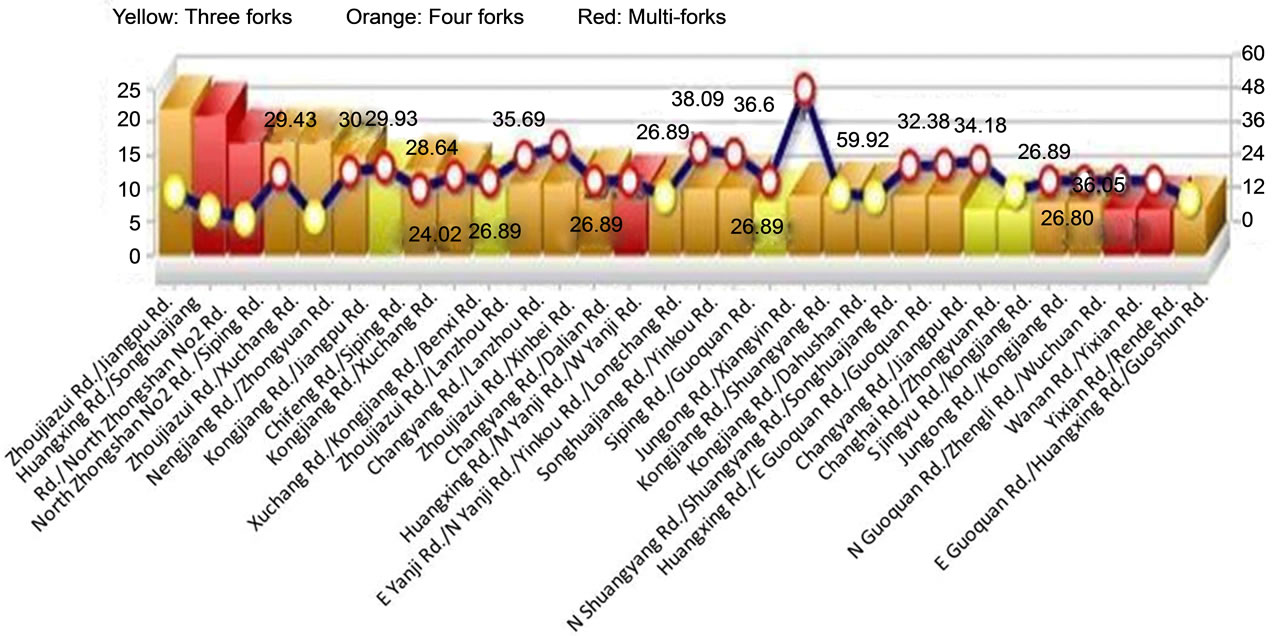 (b) Relationship with average traffic volume
Figure 7. Statistical analysis on accident-prone point.
more branches and bigger traffic volume are more likely to induce traffic accidents.
The result is basically consistent with the description in previous research [11,13]. Traffic flows disperse and converge in the vicinity of the intersections, so a lot of conflict and weaving points are developed with the traffic flows of different directions. Therefore, the number of traffic accidents is becomes larger as the number of the intersection branches increases. At intersections, a large traffic volume of turning vehicles leads to a reduced capacity of the main road and the security of driving, thus it is easy to induce traffic accidents.
There are also many factors inducing traffic accidents, including conditions of road surface, the number of road lanes, alignment design of road, intersections with or without traffic signal control systems, and the state of in-out lane etc. Due to the complexity of road elements, the causes for traffic accidents are intricate. Suppose the data is complete, more association relationships should have been detected by the method mentioned above, so as to ensure the greater traffic safety by improving the conditions of traffic facilities.
6. Conclusion
Traffic accidents are rich with spatial information. But in general, the location of traffic accidents is described as an address as text, so the spatiality is difficult to present. Aided by geocoding technology, spatial coordinates of traffic accidents are generated. They are consistent with the coordinate system of the road network and can display on the urban road network visually. Traffic accidents have a close spatial relationship with the road network elements. It is easy to utilize GIS to determine the road network element one which each traffic accident occurred, and how many accidents occurred on each road network element. Thus, it is not only the traffic accidents that attribute the spatial information, but also road network elements and traffic accident objects are recorded with their subordinate relations and quantity relationship in non-spatial attributes. Black spot identification is demanding significant attention in traffic safety analysis. The paper adopts the method that takes the potential of reducing accidents as an index to extract the black spots .Based on the methods of the GIS data storage, the association relationships between black spots and the attributes of road network elements are illustrated in graph diagram. By analyzing the relationship, the main inducing causes for traffic accidents are identified, which provides a basis for improving the conditions of traffic facilities and enhancing traffic safety.
REFERENCES
- H. Y. Zhen and W. Wang, “Research into GIS-Based Urban Traffic Safety Management,” Computer and Communications, Vol. 20, No. 3, 2002, pp. 6-9.
- B. Li. “A Component Perspective on Geographic Information Services,” Cartography and Geographic Information Science, Vol. 27, No. 1, 2000, pp. 75-86. doi:10.1559/152304000783548055
- Y. Y. Zhao, C. Y. Shang and G. Shang, “Application of Geographical Information System to Highway Management,” Highway, Vol. 9, No. 3, 2001, pp. 89-91.
- H. Q. Guo, “Study on Road Traffic Accidents Information Management System for Harbin Based on GIS,” Master’s Thesis, Northeast Forestry University, Harbin, 2007.
- Z. Jiang and Q. Li, “Research on the Applications of Geocoding,” Geography and Geo-Information Science, Vol. 19, No. 3, 2003, pp. 22-25.
- Q. Hu, J. H. Xu and Z. H. Wang, “Study on the Method of Address Automatically Matching in GIS Database,” Geomatics & Spatial Information Technology, Vol. 31, No. 6, 2008, pp. 50-52.
- X. M. Hu, T. Liu, T. H. Zhang, Y. Huang, H. W. Xie and T. Yu, “Highway Black Spot Recognition and Improvement,” Journal of Traffic and Transportation Engineering, Vol. 4, No. 1, 2004, pp. 106-109.
- J. B. Hu, “Research on Forming Mechanics and Method for Hazardous Location of Highway,” Doc. Thesis, Beijing Polytechnic University, Beijing, 2005.
- L. J. Wang and Y. G. Zhi, “Differentiation and Improvement of Road Accident-Prone Locations,” Journal of Guang Dong Communications Polytechnic, Vol. 5, No. 4, 2006, pp. 26-29.
- D. R. D. McGuigan, “The Use of Relationships between Road Accidents and Traffic Flow in ‘Black-Spot’ Identification,” Traffic Engineering and Control, Vol. 22, No. 8-9, 1981, pp. 448-453.
- S. Cheng. “Study on Traffic Accident Black Spot Identification Method,” Beijing Jiaotong University, Beijing, 2007.
- M. C. Wang, “Analysis of Road Conditions for Affecting Traffic Safety,” Chongqing Jiaotong University, Chongqing, 2008.
- L. Huang, “The Identification Method for Traffic Accident Potential Spots,” Dalian Jiaotong University, Dalian, 2009.